SlideShare a Scribd company logo
1 of 10
Download to read offline
IJRET: International Journal of Research in Engineering and Technology eISSN: 2319-1163 | pISSN: 2321-7308
__________________________________________________________________________________________
Volume: 03 Issue: 01 | Jan-2014, Available @ http://www.ijret.org 186
STATISTICAL ANALYSIS TO IDENTIFY THE MAIN PARAMETERS TO
EFFECTING WWQI OF SEWAGE TREATMENT PLANT AND
PREDICTING BOD
A.K.Khambete1
, R.A.Christian1
1, 2
Associate Professor, Faculty of civil Eng. S.V. National Institute of Technology, Surat
Abstract
The present study was conducted to determine the wastewater quality index and to study statistical interrelationships amongst
different parameters. The equation was developed to predict BOD and WWQI. A number of water quality physicochemical parameters
were estimated quantitatively in wastewater samples following methods and procedures as per governing authority guidelines.
Wastewater Quality Index (WWQI) is regarded as one of the most effective way to communicate wastewater quality in a collective way
regarding wastewater quality parameters. The WWQI of wastewater samples was calculated with fuzzy MCDM methodology. The
wastewater quality index for treated wastewater was evaluated considering eight parameters subscribed by Gujarat Pollution control
Board (GPCB), a governing authority for environmental monitoring in Gujarat State, India. Considerable uncertainties are involved
in the process of defining the treated wastewater quality for specific usage, like irrigation, reuse, etc.
The paper presents modeling of cognitive uncertainty in the field data, while dealing with these systems recourse to fuzzy logic. Also a
statistical study is done to identify the main affecting variables to the WWQI. The Statistical Regression Analysis has been found to be
highly useful tool for correlating different parameters. Correlation Analysis of the data suggests that TDS, SS, BOD, COD, O&G and
Cl are significantly correlated with WWQI and DO of wastewater. The estimated BOD from independent variance DO for maximum,
minimum and average is 25.35 mg/L, 2.65 mg/L and 13.56 mg/L respectively. While estimated WWQI from independent variance DO
for maximum, minimum and average is 0.6212, 0.3074 and 0.4581 respectively. Out of eight parameters, TDS-BOD, TDS-COD, TDS-
Cl, SS-BOD, SS-COD, and BOD-COD are significantly correlated. Present study shows that WWQI is influenced by BOD, COD, SS
and TDS.
Keywords: Wastewater quality, Uncertainty, fuzzy set theory, correlation, Regression.
------------------------------------------------------------------***----------------------------------------------------------------
1. INTRODUCTION
As urban and industrial development increases, the quality of
waste generated also increases (Mohmmed, 2006). Discharge
of untreated waste in to surface waters, such as rivers, lacks
and seas, determine the contamination of waters for human
purposes (Gabrieli et al., 1997). The treatment objectives were
concerned with the removal of suspended floatable material,
the treatment of biodegradable organics and elimination of
pathogenic organisms ( Jamrah, 1999). So the wastewater or
sewage treatment is one such alternative, where in many
processes are designed and operated in order to copy the
natural treatment process to reduce contaminant load to a level
that environment can hold ( Ravi kumar, 2010). The WQI is
presenting a cumulatively derived numerical expression
defining a certain level of water quality (Bordelo, 2006).
Water quality indices aim at giving a single value to the water
quality of a source reducing great amount of parameters into a
simpler expression and enabling easy interpretation of
monitoring data (Bharti, 2011). In other words, WQI
summarizes large amounts of water quality data into simple
terms (e.g., excellent, good, bad, etc.) for reporting to
management and the public in a consistent manner. Various
researchers have considered similar approaches which brought
changes to the methodology depending on the usage and
parameters under consideration. Prati et al. (1971) considered
13 different parameters of equal weight in their system. And
water quality index that is able to rapidly assess whether an
effluent—properly polished—is adequate for agricultural or
recreational purposes could be of great help to managers and
decision makers in water resources planning as well as for
comparing different wastewater treatment sequences
(Verlicchi et al., 2012).
Also there is a need to define one common parameter which
could determine the overall efficiency of plant in terms of
physical, biochemical and microbiological removal
efficiencies (Jamwal 2009). A new fuzzy approach initiated by
Zadeh 1965, has been adopted. i.e. Wastewater Quality Index
(WWQI), which represent the wastewater quality in terms of
IJRET: International Journal of Research in Engineering and Technology eISSN: 2319-1163 | pISSN: 2321-7308
__________________________________________________________________________________________
Volume: 03 Issue: 01 | Jan-2014, Available @ http://www.ijret.org 187
numeric i.e. 0 to 1. Developing the WWQI on the line of WQI
is expected to be more practical in implementation and can
become effective decision making tool for authority.
The Multi Criteria Decision Making (MCDM) method is
applied to determine the WWQI at Surat WWTP, and
maximum, minimum and average values for WWQI were
found out, which are 0.6284, 0.2835 and 0.4433 respectively.
Once, WWQI was calculated the correlation between WWQI
and all the parameters was calculated. Factor Analysis (FA)
was adopted to assist the interpretation of elemental data
(Akobundu 2007). So, an attempt has been made to find out
the solution of this problem by developing WWQI and
computing correlation and regression equations to assess
the wastewater quality of an treated wastewater on the basis of
few parameters.
For this SPSS tool was used. From this analysis, parameters
significantly affecting WWQI were found out (TDS, COD,
and DO etc.). At last, considering significant parameters, a
regression equation was developed using SPSS.
This equation was used to calculate WWQI once again.
Finally, the results obtained from both MCDM method and
further the regression equations were compared and the
regression equation was developed to estimate WWQI and
BOD from measured value of DO.
2. WATER QUALITY INDEX BY MCDM
METHOD
Due to fluctuations in organic and hydraulic loading in a
wastewater treatment plant, the application of fuzzy logic,
using linguistic variables gave a better description of
performance parameters. The number of criteria in multi-
criteria decision making is virtually assumed to be finite
(Evangelos,2000 and Klir,1998). Balteiro and Romero (2004)
utilized a sustainability aggregating model in search an index
to natural systems sustainability. Chen et al. (2011) utilized
fuzzy MCDM approach and fuzzy AHP for selecting the best
environment-watershed plan in Taiwan.
2.1 Multi Criteria Decision Making (MCDM)
approach for Determination of the WWQI
The approach for the evaluating WWQI of treated wastewater
is based on somewhat analogous to the procedure suggested
by Singh and Tong (2005). The chart portrays an overview of
the fuzzy decision framework for evaluating the MPAI, which
is self-explanatory Figure 1.The first step is identification of
environmental experts.
Fig 1:Step Involved in a MCDM ModelAssignimportance
weightage to the sub criteria of wastewater.
Weight for each of the sub criterion is developed by
normalized weight method by consulting the environmental
experts. In the present study, five fuzzy numbers are selected
to describe the level of performance on decision criteria in
evaluation of MPAI. Five linguistic variables are used because
it is convenient for an expert to distinguish subjectively
between them.
The approach for developing MPAI was based on strength of
different parameters is somewhat analogous to the procedure
suggested by Singh and Tong (2005). Linguistic variables
assigned for the study were five; Highly Significant (HS),
Significant (S), Average Significant (AV), Low Significant
(LS), and Not Significant (NS).Each were defined with four
fuzzy numbers average of the numbers assigned by experts
presented in Table below.
Table 1: Fuzzy numbers associated with the corresponding
Linguistic Variables.
The graphical presentation of fuzzy numbers for the linguistic
variables used by seven environmental experts to develop
weightage for each criterion is shown in Figure2.
Linguistic variables Fuzzy Number
Highly Significant (HS) (0.7,0.8,0.9,1.0)
Significant (S) (0.5,0.6,0.7,0.8)
Average Significant(AS) (0.3,0.40.5,0.6)
Low Significant (LS) (0.1,0.2,0.3,0.4)
Not Significant (NS) (0.0,0.0,0.1,0.2)
IJRET: International Journal of Research in Engineering and Technology eISSN: 2319-1163 | pISSN: 2321-7308
__________________________________________________________________________________________
Volume: 03 Issue: 01 | Jan-2014, Available @ http://www.ijret.org 188
Fig 2: Graphical representation of trapezoidal membership
function
The weightage factors are computed for eight sub criteria
(parameters) of wastewater for raw and treated wastewater. On
the basis of the experts’ opinion (linguistic variable) or
perception, a fuzzy decision matrix for the sub criteria of
wastewater is computed.
Weights are evaluated using the equation given below. The
average fuzzy numbers for all the environmental experts’
opinion can be expressed as
Ak
ij = 1
p ai1
k
+ ai2
k
+ ai3
k
+ ⋯ … . . + ap
k
for j
= 1, 2, … … , p (1)
Where akij be the fuzzy number (weight) assigned to an
alternative Ai by DMj (Decision Maker i) for the decision
criteria Ck and p is the number of environment experts
involved in the evaluation process. The linguistic variables as
assigned by the experts are converted to fuzzy numbers used
in the above expressions through Figure. Now, the defuzzified
values for the sub-criteria are obtained by the equation below;
(Kaufmann; 1991).
e =X1 +X2 +X3+X4/4 (2)
The normalized weight for each sub criterion of raw and
treated wastewater is obtained by dividing the scores of each
sub criterion ( ijC
) by the total of all sub-criterion ( ijC
).
The next step is to convert the parametric values of raw and
treated wastewater to the fuzzy numbers (membership
functions) based on the specified statutory norms. Using
simple additive weighing method (Hwang and Yoon, 1981),
the overall score (OS) in terms of MPAI for raw and treated
wastewater criteria can be calculated using following
equation.
   ..,2,1kforCWX kkOS n  (3)
Where,
 kCW
=weight (importance value) of the sub criterion
k and
kX = crisp score (defuzzified value) of treated data against
the sub criterion k.
2.2Stastical Analysis
To evaluate wastewater quality from a large number of ample
each having number of parameters is difficult. To analyze the
water quality, different approaches like statistical analysis of
individual parameter, multi- stressor water quality indices ect.
have been considered (Venkatesha, 2010). Statistical analysis
are generally used to identify the calculated WWQI is
appropriate or not. For this purpose Correlation Analysis and
Multiple Linear Regression analysis were performed.
Correlation Analysis: Correlation is a measure of degree of
linear relationship between two variables. It expresses the
extent to which two variables vary together in same directions
or opposite directions. Correlation coefficients reveal the
magnitude and direction of the relationships. A correlation has
value ranging from -1 to 1.Values that are closer to the
absolute value 1 indicate that there is a strong positive linear
relationship between the variables being correlated, whereas
values closer to 0 indicate that there is no liner relationship
between two variables under study. Below table 5 shows the
correlation between different parameters, which are, applied to
evaluate WWQI for treated wastewater. Correlation between
different parameters was found out by Florence P. et al(2010)
for Water Quality Index and Correlation Study at
YercaudTaluk, Salem, Tamil Nadu, India. Also, correlation
analysis for lower Maniar Reservoir was carried out by
Thirupathaiah M. et. Al.(2012)
Multiple Linear Regression Analysis: It is one of the very
important statistical tools which are used in almost all fields of
sciences. According to Rastogi, 2011, the Statistical
Regression Analysis has been found to be highly useful tool
for correlating different parameters. This has twofold
advantages. First with the help of correlation analysis it is easy
to find out interrelationship between different parameters and
also the main parameters affecting the WWQI can be easily
figured out. Later with the help of the regression equation
WWQI was calculated again and the degree of match is
checked. With help of this one can easily eliminate tedious
laboratory work of determining all parameters and can carry
out its work only with the parameters that are significantly
correlated in the regression equation. In regression analysis
there are two types of variables. The variable whose value is
influenced is called dependent variable and the variables
which influence the dependent variable are called explanatory
(regressors) variables. And the model equation is:
Y= β0 + β1X1 + β2 X2 + β3X3 + β4 X4 + β5X5 + β6 X6 +
β7X7+ β8X8 + e (4)
This model should be free from (as assumptions of applying
this criteria), Multicolinearity (regressors are correlated),
IJRET: International Journal of Research in Engineering and Technology eISSN: 2319-1163 | pISSN: 2321-7308
__________________________________________________________________________________________
Volume: 03 Issue: 01 | Jan-2014, Available @ http://www.ijret.org 189
Heteroscedasticity (error variance is nonconstant), and Auto-
correlation (error terms are correlated).
In this study WWQI is considered as dependent variable and
parameters are considered as explanatory variables. Chenini et
al(2009) have successfully applied multiple linear regression
for Evaluation of ground water quality. Rene et. al.(2008) has
also applied regression equation for prediction of water quality
indices.
3. MATERIALS & METHODOLOGY
3.1 Site Selection
As the study is concerned with the development of WWQI for
the treated wastewaters. All the samples were collected from
Anjana Treatment Plant located in Surat city itself. All the
samples were collected at fix time i.e. at 1 PM to 1.30 PM for
a time period of 1 year.
3.2 Sampling Procedure
For sampling, the procedure described in Standard Methods
and IS 3025 was adopted. DO fixation was performed at the
location itself by adding Manganese Sulfate and Alkaline KI
solution. For other physico – chemical parameters, samples
were collected in 1 liter plastic bottles. Samples were collected
in container rinsed with detergents, nitric acid and finally with
distilled water. These plastic bottles were placed in ice box to
maintain the temperature during travelling periods of
sampling.
3.3 Sample Analysis
The collected water samples are analyzed for eight different
parameters including Temperature, Total dissolved solids
(TDS), Suspended solids (SS), Biochemical demand (BOD),
Chemical oxygen demand (COD), Oil and grease (O&G),pH
and Chlorides (Cl). All the analyses are carried out as per the
guidelines provided in Standard Methods and IS: 3025
(1964).Temperature, DO and pH were measured at the timeof
sample collation.
4 RESULTS AND DISCUSSION
Constant monitoring of all the parameters described by CPCB
was carried out weekly throughout the year 2011.maximum,
minimum and average values of the analyzed data is
summarized in Table 2. As the treated wastewater was
chlorinated before discharge the FC and FS are omitted as the
wastewater was chlorinated before final discharge in to river
Tapi. Out of measured nine parameters total eight parameters,
except DO were considered to develop WWQI (Table3).
Table 2Minimum, maximum and average Data at Anjana STP
Note: Except Temperature and pH all parameters are in mg/L
Table 3 Minimum, maximum and average values for WWQI by MCDM method and regression equation
Data WWQI by MCDM
WWQI by regression equation (With 6
paramters)
WWQI by regression equation (With 5
parameters)
Max 0.6284 0.5711 0.6172
Min 0.2835 0.2992 0.3059
Average 0.4433 0.4241 0.4465
Then with the help of Pearson Correlation (Table 4)
statistically significantly correlated variables were identified.
Parameters Temp. TDS SS BOD COD O & G Cl pH DO
Treated Wastewater
Discharge Limits 40 2100 100 30 100 10 600 6.5-8.5 -
Max 33.80 792.00 40.00 23.00 128.00 0.80 360.00 8.05 0.74
Min 24.50 634.00 6.00 5.00 32.00 0.10 280.00 7.49 5.34
Average 28.90 732.07 22.14 12.28 67.81 0.41 317.93 7.70 3.13
Weights 0.108 0.117 0.141 0.166 0.154 0.08 0.141 0.092 -
Membership Grade Xk
Max 0.8450 0.3771 0.4000 0.7667 1.0000 0.0800 0.6000 0.6999
Min 0.6125 0.3019 0.0600 0.1667 0.3200 0.0100 0.4667 0.3266
Average 0.7225 0.3486 0.2214 0.4093 0.6781 0.0410 0.5299 0.4666
IJRET: International Journal of Research in Engineering and Technology eISSN: 2319-1163 | pISSN: 2321-7308
__________________________________________________________________________________________
Volume: 03 Issue: 01 | Jan-2014, Available @ http://www.ijret.org 190
Table 4 Pearson Correlation Coefficients showing relation between all the parameters
Temp TDS SS BOD COD O&G Cl pH DO WWQI
Temp 1
TDS .989**
1
SS -.522**
-.513**
1
BOD -.945**
-.953**
.584**
1
COD .862**
.887**
-.245**
-.806**
1
OG -.985**
-.996**
.524**
.955**
-.887**
1
Cl .991**
.997**
-.509**
-.947**
.885**
-.991**
1
pH -.887**
-.897**
.517**
.970**
-.797**
.895**
-.893**
1
DO -.985**
-.996**
.522**
.958**
-.888**
1.000**
-.991**
.899**
1
WWQI .056 .287**
.720**
.920**
.893**
.089 .321**
.194 -.984**
1
Out of eight parameters, Out of eight parameters, TDS-SS,
TDS-BOD, TDS-COD, TDS-OG, TDS-pH, TDS-DO, SS-
BOD, SS-COD, SS-OG, SS-Cl, SS-pH, SS-DO, BOD-COD,
BOD-OG, BOD-Cl, BOD-pH, BOD-DO, COD-OG, COD-Cl,
COD-pH, COD-DO, OG-Cl, OG-pH, OG-DO, Cl-pH, Cl-DO,
pH-DO are found to be significantly correlated with each other
(Table 4). Also it was found that WWQI is significantly
correlated with TDS, SS, BOD, COD, Cl and DO which
means that out of these nine parameters, only Six parameters
are responsible for the deviation or change in the values of
WWQI. Now as our main motive is to check the WWQI is
correctly drawn or not, we go for regression. From Table 5,
unstandardized coefficients for the equation constant, TDS,
SS, BOD, COD, Chloride and DO as 0.456, 0.0000103,
0.000451, 0.002448, 0.000530, 0.000128, and -0.0412
respectively. These coefficients were replaced with the
coefficients of equation 4 and Y predicted is presented in
equation 2. Table 6 shows that the model fit with 98.5% of
accuracy.
Y Estimated = 0.456 + 0.0000103 X1+ 0.000451 X2 +
0.002448 X3 + 0.000530 X4 + 0.000128 X5 - 0.0412 X6
………………….(5)
Where Y= WWQI, X1= TDS, X2= SS, X3= BOD, X4 =
COD, X5 =Cl, and X6 = DO
Table 5: Coefficients for regression analysis (Model 1)
Coefficients Standard Error t Stat Significance
Constant 0.456091134 0.029309116 15.56140879 6.45896E-26
TDS 1.03817E-05 3.97293E-05 0.261309917 0.794525072
SS 0.000451482 0.000158837 2.842434083 0.005679048
BOD 0.002448483 0.000387202 6.323524967 1.36726E-08
COD 0.000530319 7.9732E-05 6.651263435 3.29148E-09
Cl 0.000128486 6.10444E-05 2.104788562 0.038448341
DO -0.041153394 0.003067748 -13.41485266 3.58124E-22
Table 6: Model Summary (Model 1)
Model R R Square Adjusted R Square Std. Error of the Estimate Durbin-Watson
1 .993 .986 .985 .00642 1.937
IJRET: International Journal of Research in Engineering and Technology eISSN: 2319-1163 | pISSN: 2321-7308
__________________________________________________________________________________________
Volume: 03 Issue: 01 | Jan-2014, Available @ http://www.ijret.org 191
Table 7: ANOVA (Model 1)
Model Sum of Squares df Mean Square F Sig.
1
Regression .240 6 .040 972.248 .000
Residual .003 80 .000
Total .244 86
This model is fitted significantly as F= 972.248 (Sig F: 0.000)
(Table 7), also root mean square error (RMSE) is 0.000. This
model is not having problem of auto correlation as Durbin-
Watson test statistic is 1.937 which is nearer to 2 (Table 6).
As TDS was found to be correlated significantly with most of
the other parameters, TDS was neglected and again the
regression analysis was executed in order to develop a new
equation. So TDS is dropped and re calculated the WWQI and
again fitted the regression model, and got the regression
equation as follows with 98.2% of accuracy (Table 9).
Y Estimated = 0.4595 + 0.000457 X1+ 0.002464 X2 + 0.000527
X3 + 0.000141X4 -0.0412X5 (Table 8) (6)
Where Y= WWQI after dropping TDS, X1=SS, X2=BOD,
X3=COD, X4 = Cl, and X5 =DO
Table 8: Coefficients for Regression Analysis (b)
Coefficients Standard Error t Stat P-value
Constant 0.459523038 0.026050707 17.63956079 1.79428E-29
SS 0.000456715 0.00015666 2.915317416 0.004593801
BOD 0.002464727 0.000379976 6.486540962 6.48043E-09
COD 0.000527356 7.84664E-05 6.720784388 2.32032E-09
Cl 0.000140821 3.84823E-05 3.659358498 0.000448766
DO -0.041114604 0.003046481 -13.49576953 1.99668E-22
Table 9: Model Summary (b)
Model R R Square Adjusted R Square Std. Error of the Estimate Durbin-Watson
1 .993 .986 .986 .00638 1.954
Table 10: ANOVA (b)
Model Sum of Squares df Mean Square F Sig.
2
Regression .240 5 .048 1180.260 .000b
Residual .003 81 .000
Total .244 86
This model is fitted significantly as F= 1180.260 (p-value:
0.000) (Table 10), also root mean square error (RMSE) is
0.000. Each parameter has significant effect on WWQI (Table
8). This model is not having problem of auto correlation as
Durbin-Watson test statistic is 1.954 which is nearer to 2
(Table 9).
Now DO depends on the strength of wastewater i.e. WWQI.
As the value of WWQI is close to 1, poor is the quality of
treated wastewater and measured DO will be less in quantity
and for the WWQI nearer to zero , quality of wastewater is
very good for reuse and the DO will be more. In order to
predict BOD, regression equation can be fitted with BOD as
explanatory variable and DO as dependent variable. Following
equation was developed to calculate BOD.
Y Estimated = 29.182 + 0.951 X1+e (Table 11)
……..……. (7)
Where Y=BOD, X1= DO and e is error term.This model is
fitted significantly as F= 356.781 (p-value: 0.000) (Table 13),
also root mean square error (RMSE) is 0.000 with 96.9% of
accuracy (Table 12).
IJRET: International Journal of Research in Engineering and Technology eISSN: 2319-1163 | pISSN: 2321-7308
__________________________________________________________________________________________
Volume: 03 Issue: 01 | Jan-2014, Available @ http://www.ijret.org 192
Table 11: Coefficients for Regression Analysis (c)
Table 12: Model Summary (c)
Table 13: ANOVA (c)
Model Sum of Squares df Mean Square F Sig.
1 Regression 1237.090 1 1237.090 356.781 .000a
Residual 294.726 85 3.467
Total 1531.816 86
a. Predictors: (Constant), DO
b. Dependent Variable: BOD
Similarly the WWQI can be estimated from regression
equation fitted with WWQI as explanatory variable and DO as
dependent variable. Following equation was developed to
calculate WWQI.
Y Estimated = 0.672 - 0.068 X1+e (Table 14)
Where Y=WWQI, X1= DO and e is error term.
This model is fitted significantly as F= 2800.788 (p-value:
0.000) (Table 16), also root mean square error (RMSE) is
0.000 with 97.1 % of accuracy (Table 15).
Table 14: Coefficients for Regression Analysis (d)
Table 15: Model Summary (d)
Model R R Square Adjusted R Square Std. Error of the Estimate R Square Change Durbin-Watson
1 .985a
.971 .970 .0091875 .971 1.608
Model Unstandardized Coefficients Standardized
Coefficients
t Sig.
B Std. Error Beta
1 (Constant) 29.182 .951 30.698 .000
DO -4.966- .273 -.892- -18.203- .000
Model R R Square Adjusted R Square Std. Error of the Estimate
3 .985(a) .969 .969 4.18460
Model
Unstandardized Coefficients Standardized Coefficients
t Sig.
B Std. Error Beta
1
(Constant) .672 .004 150.041 .000
DO -.068 .001 -.985- -52.922- .000
a. Dependent Variable: WWQI
IJRET: International Journal of Research in Engineering and Technology eISSN: 2319-1163 | pISSN: 2321-7308
__________________________________________________________________________________________
Volume: 03 Issue: 01 | Jan-2014, Available @ http://www.ijret.org 193
Table 16: ANOVA (c)
Model Sum of Squares df Mean Square F Sig.
1
Regression .236 1 .236 2800.788 .000a
Residual .007 85 .000
Total .244 86
a. Predictors: (Constant), DO
b. Dependent Variable: WWQI
The graphical comparison for WWQI developed by MCDM
Method and both regression equations is shown in Figure 3.
The Figure 3shows that the result slightly deviates with TDS
and it almost matches without TDS.
Fig 3 Comparison in WWQI calculated by MCDM method and two regression equations
Figure 4 shows the comparison between BOD and BOD
Estimated from regression equation and Figure 5 shows the
Comparisonbetween WWQIand WWQI Estimated.
Figure 4 shows the comparison between BOD and BOD Estimated
0.2000
0.2500
0.3000
0.3500
0.4000
0.4500
0.5000
0.5500
0.6000
0.6500
1 4 7 10 13 16 19 22 25 28 31 34 37 40 43 46 49 52 55 58 61 64 67 70 73 76 79 82 85
WWQI
Number of samples
No. of Samples V/S WWQI WWQI by MCDM
WWQI by Regression Equation (With TDS)
0
5
10
15
20
25
3.21
3.27
1.89
3.76
4.85
3.55
4.47
4.29
3.06
2.34
2.27
3.83
2.83
3.82
3.64
4.59
4.21
1.53
3.23
2.65
3.62
3.04
BOD&EstimatedBOD
DO mg/L
DO v/s BOD
BOD BOD Estimated
IJRET: International Journal of Research in Engineering and Technology eISSN: 2319-1163 | pISSN: 2321-7308
__________________________________________________________________________________________
Volume: 03 Issue: 01 | Jan-2014, Available @ http://www.ijret.org 194
Fig 5 shows the comparison between WWQI and WWQI Estimated.
CONCLUSIONS
First WWQI was found and later the correlation for the
interrelation between different parameters and their correlation
with WWQI was determined with help of SPSS. From this
analysis WWQI is significantly correlated with TDS, SS,
BOD, COD, Cl and DO which means that out of these nine
parameters, only Six parameters are responsible for the
deviation or change in the values of WWQI. Also it was found
that TDS, SS, BOD, COD, Cl and DO were significantly
correlated with WWQI at 0.01 Level.
When 6 parameters were considered and regression equation
was developed, it was found nearly 98.2 % accurate.
Y Estimated = 0.456 + 0.0000103 X1+ 0.000451 X2 +
0.002448 X3 + 0.000530 X4 + 0.000128 X5 - 0.0412 X6 .
It has the standard error of 0.00642. Now, as it has R Square >
.75, the equation is acceptable and can be applied to determine
WWQI instead of performing whole tedious procedure of
MCDM Method.
Further omitting TDS and considering five parameters and
developed regression equation it was found 98.6 % fitting with
the original WWQI. The equation was like:
Y Estimated = 0.4595 + 0.000457 X1+ 0.002464 X2 +
0.000527 X3 + 0.000141 X4 - 0.0412X5.
It has the standard error of 0.969. Now, as it has R Square >
.75, this equation is also acceptable and can be applied to
determine WWQI instead of performing whole tedious
procedure of MCDM Method. But, as accuracy increases only
about 0.04%, we can neglect determination of TDS also which
may result in considerable time saving and reduce
complications in determination of WWQI.
The estimated BOD from independent variance DO for
maximum, minimum and average is 25.35 mg/L, 2.65 mg/L
and 13.56 mg/L respectively. While estimated WWQI from
independent variance DO for maximum, minimum and
average is 0.6212, 0.3074 and 0.4581 respectively.
Hence, instead of analyzing all 9 parameters (neglecting FC
and FS) only 6 or 5 parameters can provide results with
sufficient accuracy around 98-99 %. This eliminates tedious
procedure of determining and testing each and every
parameter which ultimately results in considerable amount of
time, chemicals and money savings. Also higher accuracy
eliminates any chances of deviation form original WWQI
expect shock loadings.
REFERENCES
[1] Akobundu A. N., Quality assessment of Aba River
using heavy metal pollution index, Am. J. Environ.
Engin., 2012, 2(1), 45-49.
[2] American public health association, (APHA). Standard
methods for the examination of water and wastewaters,
2003. (21th
edn). Washington, DC, USA.
[3] Balteiro, L., and Romero, C., In search of a natural
systems sustainability index, 2004, Ecological
Economics, 49 (3), 401-405.
[4] Bharti N. and Katyal D., Water quality indices used for
surface water vulnerability assessment, International
Journal of Environmental Science, 2011, 2(1), 154-173.
0.2000
0.2500
0.3000
0.3500
0.4000
0.4500
0.5000
0.5500
0.6000
3.21
3.27
1.89
3.76
4.85
3.55
4.47
4.29
3.06
2.34
2.27
3.83
2.83
3.82
3.64
4.59
4.21
1.53
3.23
2.65
3.62
3.04
WWQI
DO
DO v/s WWQI
WWQI
WWQI Estimated
IJRET: International Journal of Research in Engineering and TechnologyeISSN: 2319-1163 | pISSN: 2321-7308
__________________________________________________________________________________________
Volume: 03 Issue: 01 | Jan-2014, Available @ http://www.ijret.org 195
[5] Bordalo A. A., Teixeira R. and Wiebe W. J., A water
quality index applied to an international shared river
basin : The case of the Douro River, Environ. Manag.,
38(1), 2006, 910–920.
[6] Chen,Y., C., Lien, H., P., Tzeng, G., H., and Yang, L.,
S., Fuzzy MCDM approach for selecting the best
environment-watershed plan, Applied Soft Computing
Journal, 2011,11(1), 265-275.
[7] Chenini I. and Khemiri S., Evaluation of ground water
quality using multiple linear regression and structural
equation modelling, Int.J. Environ. Sci. Tech., 2009, 6
(3), 509-519.
[8] Evangelos., P mastering visual basic 6, BPP
Publications, New Delhi, (2000).
[9] Florence P. L., Paulraj A.,Ramachandramoorthy T.,
Water Quality Index and correlation study for the
assessment of water quality and its parameters of
YercaudAluk, Salem District, Tamil Nadu, India,
Chem. Sci.Trans., 2010,1(1), 139-14.
[10] Gabrieli, R.; Divizia, M.; Donia, D.; Ruscio, V.;
Bonadonna, L.; Diotallevi, C.; Villa, L.; Manzone, G.;
Panà, A., Evaluation of the wastewater treatment plant
of Rome airport. Water Science and Technology, 1997,
vol. 35, issue 11-12. p. 193-196
[11] Hwang, C., and Yoon, K. Multiple attribute decision
making – methods and applications, A state of the art
survey, Springer-Verlag, Berlin. ,1981.
[12] Jamrah, A., I., Assessment of characteristics and
biological treatment technologies of Jordanian
wastewater, 1999, Bioprocess Engineering, 21: 331-
340.
[13] Jamwal, P., Mittal, A., K. and Mouchel,J., M.
Efficiency evaluation of sewage treatment plants with
different technologies in Delhi, (India). 2009,
Environmental Monitoring assessment,153, 293-305.
[14] Kaufman, A., and Gupta, M., M. , Fuzzy mathematical
modelling in engineering and management sciences,
Fuzzy Set and Systems, 1991, 43, 17–32.
[15] Klir, G., J., and Yuan, B. , Operation of fuzzy sets in:
Ruspini, E. H., Bonissone, P. P. and Pedryez W.,
Handbook of Fuzzy Computation, Institute of Physics
Publishing, Dirac House, temple Bath, Bristol , 1998.
[16] Mohammed,B , Design and Performance Evaluation of
a Wastewater Treatment Unit.” Australian Journal of
Technology. , 2006, 9(3): 193-198 .
[17] Prati L., Pavanello R. and PesarinF.,Assessment of
surface water quality by a single index of pollution, J.
Wat. Res.,1971, 5(1), 74.
[18] Rastogi. G.K. and Sinha D. K., A novel approach to
water quality management through correlation study,
Journal of Environmental Research and Development ,
2011, 5 ,(4), 1029-1035.
[19] Ravikumar, P., Liza, B., Pinto. andSomashekar, R., K.,
Assessment of the Efficiency of Sewage Treatment
plants: A Comparative Study between
NagasandraandMailasandra Sewage Treatment Plants.
2010, Kathmandu University, Journal of Science
Engineering and Technology, 6(2), 115-125.
[20] Rene E. and Saidutta M. B., Prediction of Water
Quality indices by regression analysis and artificial
neural networks, Int. Environ. Res., 2008,2(2), 183-
188.
[21] Singh, D. and Robert L. K.Tiong, A fuzzy decision
framework for contractor selection, 2005, Journal of
Construction Engineering and Management (ASCE),
131(1), 62-70.
[22] Thirupathaiah M., Samatha C. andSammaiah C.,
Analysis of water quality using physico-chemical
parameters in lower manair reservoir of
Karimnagardistrict,Andhra Pradesh, Int. J. Environ.
Sci., 2012,3(1), 172-180.
[23] Venkatesharaju K., Somashekar R. K and Prakash K.
L., Study of seasonal and spatial variation in surface
water quality of Cauvery River Stretch in Karnataka, J.
Ecol. Nat. Environ., 2010, 2(1), 1-9.
[24] Verlicchi P, Masotti L, Galletti A. Wastewater
polishing index: a tool for a rapid quality assessment of
reclaimed wastewater. Environtal Monitoring and
Assessment; 2011, 173(1-4):267-77. doi:
10.1007/s10661-010-1386-7. Epub 2010 Mar 9.
BIOGRAPHIES
Mrs. Anjali Khambete has received her
bachelor’s and master’s from S V National
Institute of Technology, Surat. Currently
working as Associate Professor in the department of Civil
engineering. At SVNIT, Surat. Her research interests are in the
field of water and wastewater engineering. Fuzzy logic,
Dr. Robin Christian has received his master’s
and PhD from S V National Institute of
Technology, Surat. Currently working as
Associate Professor in the department of Civil
engineering. At SVN IT, Surat. His research interests are noise
pollution, application of fuzzy logic in environmental field.
Published many papers in international journals related to
environmental engineering.

More Related Content

What's hot

Assessment of salt water intrusion into the coastal aquifers of Kerala
Assessment of salt water intrusion into the coastal aquifers of KeralaAssessment of salt water intrusion into the coastal aquifers of Kerala
Assessment of salt water intrusion into the coastal aquifers of KeralaIRJET Journal
 
Comparison of actual release schedule and optimal
Comparison of actual release schedule and optimalComparison of actual release schedule and optimal
Comparison of actual release schedule and optimalIAEME Publication
 
IRJET- Pollution Assessment of Water Bodies in Muvattupuzha Muncipality A...
IRJET-  	  Pollution Assessment of Water Bodies in Muvattupuzha Muncipality A...IRJET-  	  Pollution Assessment of Water Bodies in Muvattupuzha Muncipality A...
IRJET- Pollution Assessment of Water Bodies in Muvattupuzha Muncipality A...IRJET Journal
 
SSS_Vol_II_HHRA_Appendix_J_b_GolderBioaccessibilityRound1
SSS_Vol_II_HHRA_Appendix_J_b_GolderBioaccessibilityRound1SSS_Vol_II_HHRA_Appendix_J_b_GolderBioaccessibilityRound1
SSS_Vol_II_HHRA_Appendix_J_b_GolderBioaccessibilityRound1Guy Gilron
 
Water quality index mapping of kengeri industrial area of bangalore city usin...
Water quality index mapping of kengeri industrial area of bangalore city usin...Water quality index mapping of kengeri industrial area of bangalore city usin...
Water quality index mapping of kengeri industrial area of bangalore city usin...IAEME Publication
 
PERFORMANCE INDEX DEGRADATION MODEL OF SURFACE IRRIGATION SYSTEM
PERFORMANCE INDEX DEGRADATION MODEL OF SURFACE IRRIGATION SYSTEMPERFORMANCE INDEX DEGRADATION MODEL OF SURFACE IRRIGATION SYSTEM
PERFORMANCE INDEX DEGRADATION MODEL OF SURFACE IRRIGATION SYSTEMIAEME Publication
 
LIFE CYCLE ASSESSMENT ON ALUMINIUM CAN AND GLASS BOTTLE
LIFE CYCLE ASSESSMENT ON ALUMINIUM CAN AND GLASS BOTTLELIFE CYCLE ASSESSMENT ON ALUMINIUM CAN AND GLASS BOTTLE
LIFE CYCLE ASSESSMENT ON ALUMINIUM CAN AND GLASS BOTTLERajat Nag
 
Comparison of Spatial Interpolation Techniques - A Case Study of Anantnag Di...
Comparison of Spatial Interpolation Techniques - A Case Study  of Anantnag Di...Comparison of Spatial Interpolation Techniques - A Case Study  of Anantnag Di...
Comparison of Spatial Interpolation Techniques - A Case Study of Anantnag Di...IJMER
 

What's hot (9)

Assessment of salt water intrusion into the coastal aquifers of Kerala
Assessment of salt water intrusion into the coastal aquifers of KeralaAssessment of salt water intrusion into the coastal aquifers of Kerala
Assessment of salt water intrusion into the coastal aquifers of Kerala
 
Comparison of actual release schedule and optimal
Comparison of actual release schedule and optimalComparison of actual release schedule and optimal
Comparison of actual release schedule and optimal
 
IRJET- Pollution Assessment of Water Bodies in Muvattupuzha Muncipality A...
IRJET-  	  Pollution Assessment of Water Bodies in Muvattupuzha Muncipality A...IRJET-  	  Pollution Assessment of Water Bodies in Muvattupuzha Muncipality A...
IRJET- Pollution Assessment of Water Bodies in Muvattupuzha Muncipality A...
 
SSS_Vol_II_HHRA_Appendix_J_b_GolderBioaccessibilityRound1
SSS_Vol_II_HHRA_Appendix_J_b_GolderBioaccessibilityRound1SSS_Vol_II_HHRA_Appendix_J_b_GolderBioaccessibilityRound1
SSS_Vol_II_HHRA_Appendix_J_b_GolderBioaccessibilityRound1
 
Water quality index mapping of kengeri industrial area of bangalore city usin...
Water quality index mapping of kengeri industrial area of bangalore city usin...Water quality index mapping of kengeri industrial area of bangalore city usin...
Water quality index mapping of kengeri industrial area of bangalore city usin...
 
PERFORMANCE INDEX DEGRADATION MODEL OF SURFACE IRRIGATION SYSTEM
PERFORMANCE INDEX DEGRADATION MODEL OF SURFACE IRRIGATION SYSTEMPERFORMANCE INDEX DEGRADATION MODEL OF SURFACE IRRIGATION SYSTEM
PERFORMANCE INDEX DEGRADATION MODEL OF SURFACE IRRIGATION SYSTEM
 
20320130406020 2
20320130406020 220320130406020 2
20320130406020 2
 
LIFE CYCLE ASSESSMENT ON ALUMINIUM CAN AND GLASS BOTTLE
LIFE CYCLE ASSESSMENT ON ALUMINIUM CAN AND GLASS BOTTLELIFE CYCLE ASSESSMENT ON ALUMINIUM CAN AND GLASS BOTTLE
LIFE CYCLE ASSESSMENT ON ALUMINIUM CAN AND GLASS BOTTLE
 
Comparison of Spatial Interpolation Techniques - A Case Study of Anantnag Di...
Comparison of Spatial Interpolation Techniques - A Case Study  of Anantnag Di...Comparison of Spatial Interpolation Techniques - A Case Study  of Anantnag Di...
Comparison of Spatial Interpolation Techniques - A Case Study of Anantnag Di...
 

Viewers also liked

Investigatory project. yani gustilo
Investigatory project. yani gustiloInvestigatory project. yani gustilo
Investigatory project. yani gustiloyanireckless
 
The effectiveness of lemon grass as natural insect repellent
The effectiveness of lemon grass as natural insect repellentThe effectiveness of lemon grass as natural insect repellent
The effectiveness of lemon grass as natural insect repellentJohn Daniel Gumban
 
Calamansi (Citrofortunella Microcarpa) Fruit Extract as a perfume
Calamansi (Citrofortunella Microcarpa) Fruit Extract as a perfumeCalamansi (Citrofortunella Microcarpa) Fruit Extract as a perfume
Calamansi (Citrofortunella Microcarpa) Fruit Extract as a perfumeJulienne Mae Potonia
 
Investigatory paper sample
Investigatory paper sampleInvestigatory paper sample
Investigatory paper sampleMarlo Ortinez
 
Research paper - Calamansi (Citrofortunella Microcarpa) Fruit Extract as Perfume
Research paper - Calamansi (Citrofortunella Microcarpa) Fruit Extract as PerfumeResearch paper - Calamansi (Citrofortunella Microcarpa) Fruit Extract as Perfume
Research paper - Calamansi (Citrofortunella Microcarpa) Fruit Extract as PerfumeJulienne Mae Potonia
 
Sample Methodology
Sample MethodologySample Methodology
Sample MethodologyAiden Yeh
 

Viewers also liked (12)

NORMAL DISTRIBUTION
NORMAL DISTRIBUTIONNORMAL DISTRIBUTION
NORMAL DISTRIBUTION
 
Chapter three
Chapter threeChapter three
Chapter three
 
Investigatory project. yani gustilo
Investigatory project. yani gustiloInvestigatory project. yani gustilo
Investigatory project. yani gustilo
 
The effectiveness of lemon grass as natural insect repellent
The effectiveness of lemon grass as natural insect repellentThe effectiveness of lemon grass as natural insect repellent
The effectiveness of lemon grass as natural insect repellent
 
Chapter 3
Chapter 3Chapter 3
Chapter 3
 
Calamansi (Citrofortunella Microcarpa) Fruit Extract as a perfume
Calamansi (Citrofortunella Microcarpa) Fruit Extract as a perfumeCalamansi (Citrofortunella Microcarpa) Fruit Extract as a perfume
Calamansi (Citrofortunella Microcarpa) Fruit Extract as a perfume
 
Investigatory paper sample
Investigatory paper sampleInvestigatory paper sample
Investigatory paper sample
 
Research paper - Calamansi (Citrofortunella Microcarpa) Fruit Extract as Perfume
Research paper - Calamansi (Citrofortunella Microcarpa) Fruit Extract as PerfumeResearch paper - Calamansi (Citrofortunella Microcarpa) Fruit Extract as Perfume
Research paper - Calamansi (Citrofortunella Microcarpa) Fruit Extract as Perfume
 
Chapter 3
Chapter 3Chapter 3
Chapter 3
 
Investigatory Project
Investigatory ProjectInvestigatory Project
Investigatory Project
 
Chapter iii
Chapter iiiChapter iii
Chapter iii
 
Sample Methodology
Sample MethodologySample Methodology
Sample Methodology
 

Similar to Statistical analysis to identify the main parameters to effecting wwqi of sewage treatment plant and predicting bod

Statistical analysis to identify the main parameters to
Statistical analysis to identify the main parameters toStatistical analysis to identify the main parameters to
Statistical analysis to identify the main parameters toeSAT Publishing House
 
Statistical analysis to identify the main parameters to
Statistical analysis to identify the main parameters toStatistical analysis to identify the main parameters to
Statistical analysis to identify the main parameters toeSAT Publishing House
 
IRJET- Modelling BOD and COD using Artificial Neural Network with Factor Anal...
IRJET- Modelling BOD and COD using Artificial Neural Network with Factor Anal...IRJET- Modelling BOD and COD using Artificial Neural Network with Factor Anal...
IRJET- Modelling BOD and COD using Artificial Neural Network with Factor Anal...IRJET Journal
 
Use of Fuzzy Set Theory in Environmental Engineering Applications: A Review
Use of Fuzzy Set Theory in Environmental Engineering Applications: A ReviewUse of Fuzzy Set Theory in Environmental Engineering Applications: A Review
Use of Fuzzy Set Theory in Environmental Engineering Applications: A ReviewIJERA Editor
 
Water quality index for groundwater of southern part of bangalore city
Water quality index for groundwater of southern part of bangalore cityWater quality index for groundwater of southern part of bangalore city
Water quality index for groundwater of southern part of bangalore cityeSAT Journals
 
An Efficient Method for Assessing Water Quality Based on Bayesian Belief Netw...
An Efficient Method for Assessing Water Quality Based on Bayesian Belief Netw...An Efficient Method for Assessing Water Quality Based on Bayesian Belief Netw...
An Efficient Method for Assessing Water Quality Based on Bayesian Belief Netw...ijsc
 
An efficient method for assessing water
An efficient method for assessing waterAn efficient method for assessing water
An efficient method for assessing waterijsc
 
Review of performance evaluation of canal irrigation system
Review of performance evaluation of canal irrigation systemReview of performance evaluation of canal irrigation system
Review of performance evaluation of canal irrigation systemRonak Patel
 
IRJET-­­­­Water Quality Assessment in Terms of Water Quality Index using Remo...
IRJET-­­­­Water Quality Assessment in Terms of Water Quality Index using Remo...IRJET-­­­­Water Quality Assessment in Terms of Water Quality Index using Remo...
IRJET-­­­­Water Quality Assessment in Terms of Water Quality Index using Remo...IRJET Journal
 
Factor analysis as a tool for evaluation of spatial and temporal variations i...
Factor analysis as a tool for evaluation of spatial and temporal variations i...Factor analysis as a tool for evaluation of spatial and temporal variations i...
Factor analysis as a tool for evaluation of spatial and temporal variations i...IOSR Journals
 
IRJET- Review of Remote Sensing-based Irrigation System Performance Asses...
IRJET-  	  Review of Remote Sensing-based Irrigation System Performance Asses...IRJET-  	  Review of Remote Sensing-based Irrigation System Performance Asses...
IRJET- Review of Remote Sensing-based Irrigation System Performance Asses...IRJET Journal
 
Chlorine Dose Determination in Water Distribution System of Jabalpur City usi...
Chlorine Dose Determination in Water Distribution System of Jabalpur City usi...Chlorine Dose Determination in Water Distribution System of Jabalpur City usi...
Chlorine Dose Determination in Water Distribution System of Jabalpur City usi...IRJET Journal
 
“A STUDY ON THE SEASONAL VARIATION IN WATER QUALITY OF SHANTIGRAMA LAKE IN HA...
“A STUDY ON THE SEASONAL VARIATION IN WATER QUALITY OF SHANTIGRAMA LAKE IN HA...“A STUDY ON THE SEASONAL VARIATION IN WATER QUALITY OF SHANTIGRAMA LAKE IN HA...
“A STUDY ON THE SEASONAL VARIATION IN WATER QUALITY OF SHANTIGRAMA LAKE IN HA...IRJET Journal
 
“A STUDY ON THE SEASONAL VARIATION IN WATER QUALITY OF SHANTIGRAMA LAKE IN HA...
“A STUDY ON THE SEASONAL VARIATION IN WATER QUALITY OF SHANTIGRAMA LAKE IN HA...“A STUDY ON THE SEASONAL VARIATION IN WATER QUALITY OF SHANTIGRAMA LAKE IN HA...
“A STUDY ON THE SEASONAL VARIATION IN WATER QUALITY OF SHANTIGRAMA LAKE IN HA...LaishramDipolin
 
Analysis of Water Quality Index for Groundwater in Gudur Mandal, SPSR Nellore...
Analysis of Water Quality Index for Groundwater in Gudur Mandal, SPSR Nellore...Analysis of Water Quality Index for Groundwater in Gudur Mandal, SPSR Nellore...
Analysis of Water Quality Index for Groundwater in Gudur Mandal, SPSR Nellore...IJERA Editor
 
IRJET- Hydrodynamic Integrated Modelling of Basic Water Quality and Nutrient ...
IRJET- Hydrodynamic Integrated Modelling of Basic Water Quality and Nutrient ...IRJET- Hydrodynamic Integrated Modelling of Basic Water Quality and Nutrient ...
IRJET- Hydrodynamic Integrated Modelling of Basic Water Quality and Nutrient ...IRJET Journal
 
A novel fuzzy rule based system for assessment of ground water potability: A ...
A novel fuzzy rule based system for assessment of ground water potability: A ...A novel fuzzy rule based system for assessment of ground water potability: A ...
A novel fuzzy rule based system for assessment of ground water potability: A ...IOSR Journals
 
WATER QUALITY PREDICTION
WATER QUALITY PREDICTIONWATER QUALITY PREDICTION
WATER QUALITY PREDICTIONFasil47
 
EVALUATION OF REFERENCE EVAPOTRANSPIRATION ESTIMATION METHODS AND DEVELOPMENT...
EVALUATION OF REFERENCE EVAPOTRANSPIRATION ESTIMATION METHODS AND DEVELOPMENT...EVALUATION OF REFERENCE EVAPOTRANSPIRATION ESTIMATION METHODS AND DEVELOPMENT...
EVALUATION OF REFERENCE EVAPOTRANSPIRATION ESTIMATION METHODS AND DEVELOPMENT...IAEME Publication
 

Similar to Statistical analysis to identify the main parameters to effecting wwqi of sewage treatment plant and predicting bod (20)

Statistical analysis to identify the main parameters to
Statistical analysis to identify the main parameters toStatistical analysis to identify the main parameters to
Statistical analysis to identify the main parameters to
 
Statistical analysis to identify the main parameters to
Statistical analysis to identify the main parameters toStatistical analysis to identify the main parameters to
Statistical analysis to identify the main parameters to
 
IRJET- Modelling BOD and COD using Artificial Neural Network with Factor Anal...
IRJET- Modelling BOD and COD using Artificial Neural Network with Factor Anal...IRJET- Modelling BOD and COD using Artificial Neural Network with Factor Anal...
IRJET- Modelling BOD and COD using Artificial Neural Network with Factor Anal...
 
Use of Fuzzy Set Theory in Environmental Engineering Applications: A Review
Use of Fuzzy Set Theory in Environmental Engineering Applications: A ReviewUse of Fuzzy Set Theory in Environmental Engineering Applications: A Review
Use of Fuzzy Set Theory in Environmental Engineering Applications: A Review
 
Water quality index for groundwater of southern part of bangalore city
Water quality index for groundwater of southern part of bangalore cityWater quality index for groundwater of southern part of bangalore city
Water quality index for groundwater of southern part of bangalore city
 
An Efficient Method for Assessing Water Quality Based on Bayesian Belief Netw...
An Efficient Method for Assessing Water Quality Based on Bayesian Belief Netw...An Efficient Method for Assessing Water Quality Based on Bayesian Belief Netw...
An Efficient Method for Assessing Water Quality Based on Bayesian Belief Netw...
 
An efficient method for assessing water
An efficient method for assessing waterAn efficient method for assessing water
An efficient method for assessing water
 
Review of performance evaluation of canal irrigation system
Review of performance evaluation of canal irrigation systemReview of performance evaluation of canal irrigation system
Review of performance evaluation of canal irrigation system
 
IRJET-­­­­Water Quality Assessment in Terms of Water Quality Index using Remo...
IRJET-­­­­Water Quality Assessment in Terms of Water Quality Index using Remo...IRJET-­­­­Water Quality Assessment in Terms of Water Quality Index using Remo...
IRJET-­­­­Water Quality Assessment in Terms of Water Quality Index using Remo...
 
Factor analysis as a tool for evaluation of spatial and temporal variations i...
Factor analysis as a tool for evaluation of spatial and temporal variations i...Factor analysis as a tool for evaluation of spatial and temporal variations i...
Factor analysis as a tool for evaluation of spatial and temporal variations i...
 
IRJET- Review of Remote Sensing-based Irrigation System Performance Asses...
IRJET-  	  Review of Remote Sensing-based Irrigation System Performance Asses...IRJET-  	  Review of Remote Sensing-based Irrigation System Performance Asses...
IRJET- Review of Remote Sensing-based Irrigation System Performance Asses...
 
Chlorine Dose Determination in Water Distribution System of Jabalpur City usi...
Chlorine Dose Determination in Water Distribution System of Jabalpur City usi...Chlorine Dose Determination in Water Distribution System of Jabalpur City usi...
Chlorine Dose Determination in Water Distribution System of Jabalpur City usi...
 
“A STUDY ON THE SEASONAL VARIATION IN WATER QUALITY OF SHANTIGRAMA LAKE IN HA...
“A STUDY ON THE SEASONAL VARIATION IN WATER QUALITY OF SHANTIGRAMA LAKE IN HA...“A STUDY ON THE SEASONAL VARIATION IN WATER QUALITY OF SHANTIGRAMA LAKE IN HA...
“A STUDY ON THE SEASONAL VARIATION IN WATER QUALITY OF SHANTIGRAMA LAKE IN HA...
 
“A STUDY ON THE SEASONAL VARIATION IN WATER QUALITY OF SHANTIGRAMA LAKE IN HA...
“A STUDY ON THE SEASONAL VARIATION IN WATER QUALITY OF SHANTIGRAMA LAKE IN HA...“A STUDY ON THE SEASONAL VARIATION IN WATER QUALITY OF SHANTIGRAMA LAKE IN HA...
“A STUDY ON THE SEASONAL VARIATION IN WATER QUALITY OF SHANTIGRAMA LAKE IN HA...
 
Analysis of Water Quality Index for Groundwater in Gudur Mandal, SPSR Nellore...
Analysis of Water Quality Index for Groundwater in Gudur Mandal, SPSR Nellore...Analysis of Water Quality Index for Groundwater in Gudur Mandal, SPSR Nellore...
Analysis of Water Quality Index for Groundwater in Gudur Mandal, SPSR Nellore...
 
IRJET- Hydrodynamic Integrated Modelling of Basic Water Quality and Nutrient ...
IRJET- Hydrodynamic Integrated Modelling of Basic Water Quality and Nutrient ...IRJET- Hydrodynamic Integrated Modelling of Basic Water Quality and Nutrient ...
IRJET- Hydrodynamic Integrated Modelling of Basic Water Quality and Nutrient ...
 
A novel fuzzy rule based system for assessment of ground water potability: A ...
A novel fuzzy rule based system for assessment of ground water potability: A ...A novel fuzzy rule based system for assessment of ground water potability: A ...
A novel fuzzy rule based system for assessment of ground water potability: A ...
 
WATER QUALITY PREDICTION
WATER QUALITY PREDICTIONWATER QUALITY PREDICTION
WATER QUALITY PREDICTION
 
Unit cost of water
Unit cost of waterUnit cost of water
Unit cost of water
 
EVALUATION OF REFERENCE EVAPOTRANSPIRATION ESTIMATION METHODS AND DEVELOPMENT...
EVALUATION OF REFERENCE EVAPOTRANSPIRATION ESTIMATION METHODS AND DEVELOPMENT...EVALUATION OF REFERENCE EVAPOTRANSPIRATION ESTIMATION METHODS AND DEVELOPMENT...
EVALUATION OF REFERENCE EVAPOTRANSPIRATION ESTIMATION METHODS AND DEVELOPMENT...
 

More from eSAT Journals

Mechanical properties of hybrid fiber reinforced concrete for pavements
Mechanical properties of hybrid fiber reinforced concrete for pavementsMechanical properties of hybrid fiber reinforced concrete for pavements
Mechanical properties of hybrid fiber reinforced concrete for pavementseSAT Journals
 
Material management in construction – a case study
Material management in construction – a case studyMaterial management in construction – a case study
Material management in construction – a case studyeSAT Journals
 
Managing drought short term strategies in semi arid regions a case study
Managing drought    short term strategies in semi arid regions  a case studyManaging drought    short term strategies in semi arid regions  a case study
Managing drought short term strategies in semi arid regions a case studyeSAT Journals
 
Life cycle cost analysis of overlay for an urban road in bangalore
Life cycle cost analysis of overlay for an urban road in bangaloreLife cycle cost analysis of overlay for an urban road in bangalore
Life cycle cost analysis of overlay for an urban road in bangaloreeSAT Journals
 
Laboratory studies of dense bituminous mixes ii with reclaimed asphalt materials
Laboratory studies of dense bituminous mixes ii with reclaimed asphalt materialsLaboratory studies of dense bituminous mixes ii with reclaimed asphalt materials
Laboratory studies of dense bituminous mixes ii with reclaimed asphalt materialseSAT Journals
 
Laboratory investigation of expansive soil stabilized with natural inorganic ...
Laboratory investigation of expansive soil stabilized with natural inorganic ...Laboratory investigation of expansive soil stabilized with natural inorganic ...
Laboratory investigation of expansive soil stabilized with natural inorganic ...eSAT Journals
 
Influence of reinforcement on the behavior of hollow concrete block masonry p...
Influence of reinforcement on the behavior of hollow concrete block masonry p...Influence of reinforcement on the behavior of hollow concrete block masonry p...
Influence of reinforcement on the behavior of hollow concrete block masonry p...eSAT Journals
 
Influence of compaction energy on soil stabilized with chemical stabilizer
Influence of compaction energy on soil stabilized with chemical stabilizerInfluence of compaction energy on soil stabilized with chemical stabilizer
Influence of compaction energy on soil stabilized with chemical stabilizereSAT Journals
 
Geographical information system (gis) for water resources management
Geographical information system (gis) for water resources managementGeographical information system (gis) for water resources management
Geographical information system (gis) for water resources managementeSAT Journals
 
Forest type mapping of bidar forest division, karnataka using geoinformatics ...
Forest type mapping of bidar forest division, karnataka using geoinformatics ...Forest type mapping of bidar forest division, karnataka using geoinformatics ...
Forest type mapping of bidar forest division, karnataka using geoinformatics ...eSAT Journals
 
Factors influencing compressive strength of geopolymer concrete
Factors influencing compressive strength of geopolymer concreteFactors influencing compressive strength of geopolymer concrete
Factors influencing compressive strength of geopolymer concreteeSAT Journals
 
Experimental investigation on circular hollow steel columns in filled with li...
Experimental investigation on circular hollow steel columns in filled with li...Experimental investigation on circular hollow steel columns in filled with li...
Experimental investigation on circular hollow steel columns in filled with li...eSAT Journals
 
Experimental behavior of circular hsscfrc filled steel tubular columns under ...
Experimental behavior of circular hsscfrc filled steel tubular columns under ...Experimental behavior of circular hsscfrc filled steel tubular columns under ...
Experimental behavior of circular hsscfrc filled steel tubular columns under ...eSAT Journals
 
Evaluation of punching shear in flat slabs
Evaluation of punching shear in flat slabsEvaluation of punching shear in flat slabs
Evaluation of punching shear in flat slabseSAT Journals
 
Evaluation of performance of intake tower dam for recent earthquake in india
Evaluation of performance of intake tower dam for recent earthquake in indiaEvaluation of performance of intake tower dam for recent earthquake in india
Evaluation of performance of intake tower dam for recent earthquake in indiaeSAT Journals
 
Evaluation of operational efficiency of urban road network using travel time ...
Evaluation of operational efficiency of urban road network using travel time ...Evaluation of operational efficiency of urban road network using travel time ...
Evaluation of operational efficiency of urban road network using travel time ...eSAT Journals
 
Estimation of surface runoff in nallur amanikere watershed using scs cn method
Estimation of surface runoff in nallur amanikere watershed using scs cn methodEstimation of surface runoff in nallur amanikere watershed using scs cn method
Estimation of surface runoff in nallur amanikere watershed using scs cn methodeSAT Journals
 
Estimation of morphometric parameters and runoff using rs & gis techniques
Estimation of morphometric parameters and runoff using rs & gis techniquesEstimation of morphometric parameters and runoff using rs & gis techniques
Estimation of morphometric parameters and runoff using rs & gis techniqueseSAT Journals
 
Effect of variation of plastic hinge length on the results of non linear anal...
Effect of variation of plastic hinge length on the results of non linear anal...Effect of variation of plastic hinge length on the results of non linear anal...
Effect of variation of plastic hinge length on the results of non linear anal...eSAT Journals
 
Effect of use of recycled materials on indirect tensile strength of asphalt c...
Effect of use of recycled materials on indirect tensile strength of asphalt c...Effect of use of recycled materials on indirect tensile strength of asphalt c...
Effect of use of recycled materials on indirect tensile strength of asphalt c...eSAT Journals
 

More from eSAT Journals (20)

Mechanical properties of hybrid fiber reinforced concrete for pavements
Mechanical properties of hybrid fiber reinforced concrete for pavementsMechanical properties of hybrid fiber reinforced concrete for pavements
Mechanical properties of hybrid fiber reinforced concrete for pavements
 
Material management in construction – a case study
Material management in construction – a case studyMaterial management in construction – a case study
Material management in construction – a case study
 
Managing drought short term strategies in semi arid regions a case study
Managing drought    short term strategies in semi arid regions  a case studyManaging drought    short term strategies in semi arid regions  a case study
Managing drought short term strategies in semi arid regions a case study
 
Life cycle cost analysis of overlay for an urban road in bangalore
Life cycle cost analysis of overlay for an urban road in bangaloreLife cycle cost analysis of overlay for an urban road in bangalore
Life cycle cost analysis of overlay for an urban road in bangalore
 
Laboratory studies of dense bituminous mixes ii with reclaimed asphalt materials
Laboratory studies of dense bituminous mixes ii with reclaimed asphalt materialsLaboratory studies of dense bituminous mixes ii with reclaimed asphalt materials
Laboratory studies of dense bituminous mixes ii with reclaimed asphalt materials
 
Laboratory investigation of expansive soil stabilized with natural inorganic ...
Laboratory investigation of expansive soil stabilized with natural inorganic ...Laboratory investigation of expansive soil stabilized with natural inorganic ...
Laboratory investigation of expansive soil stabilized with natural inorganic ...
 
Influence of reinforcement on the behavior of hollow concrete block masonry p...
Influence of reinforcement on the behavior of hollow concrete block masonry p...Influence of reinforcement on the behavior of hollow concrete block masonry p...
Influence of reinforcement on the behavior of hollow concrete block masonry p...
 
Influence of compaction energy on soil stabilized with chemical stabilizer
Influence of compaction energy on soil stabilized with chemical stabilizerInfluence of compaction energy on soil stabilized with chemical stabilizer
Influence of compaction energy on soil stabilized with chemical stabilizer
 
Geographical information system (gis) for water resources management
Geographical information system (gis) for water resources managementGeographical information system (gis) for water resources management
Geographical information system (gis) for water resources management
 
Forest type mapping of bidar forest division, karnataka using geoinformatics ...
Forest type mapping of bidar forest division, karnataka using geoinformatics ...Forest type mapping of bidar forest division, karnataka using geoinformatics ...
Forest type mapping of bidar forest division, karnataka using geoinformatics ...
 
Factors influencing compressive strength of geopolymer concrete
Factors influencing compressive strength of geopolymer concreteFactors influencing compressive strength of geopolymer concrete
Factors influencing compressive strength of geopolymer concrete
 
Experimental investigation on circular hollow steel columns in filled with li...
Experimental investigation on circular hollow steel columns in filled with li...Experimental investigation on circular hollow steel columns in filled with li...
Experimental investigation on circular hollow steel columns in filled with li...
 
Experimental behavior of circular hsscfrc filled steel tubular columns under ...
Experimental behavior of circular hsscfrc filled steel tubular columns under ...Experimental behavior of circular hsscfrc filled steel tubular columns under ...
Experimental behavior of circular hsscfrc filled steel tubular columns under ...
 
Evaluation of punching shear in flat slabs
Evaluation of punching shear in flat slabsEvaluation of punching shear in flat slabs
Evaluation of punching shear in flat slabs
 
Evaluation of performance of intake tower dam for recent earthquake in india
Evaluation of performance of intake tower dam for recent earthquake in indiaEvaluation of performance of intake tower dam for recent earthquake in india
Evaluation of performance of intake tower dam for recent earthquake in india
 
Evaluation of operational efficiency of urban road network using travel time ...
Evaluation of operational efficiency of urban road network using travel time ...Evaluation of operational efficiency of urban road network using travel time ...
Evaluation of operational efficiency of urban road network using travel time ...
 
Estimation of surface runoff in nallur amanikere watershed using scs cn method
Estimation of surface runoff in nallur amanikere watershed using scs cn methodEstimation of surface runoff in nallur amanikere watershed using scs cn method
Estimation of surface runoff in nallur amanikere watershed using scs cn method
 
Estimation of morphometric parameters and runoff using rs & gis techniques
Estimation of morphometric parameters and runoff using rs & gis techniquesEstimation of morphometric parameters and runoff using rs & gis techniques
Estimation of morphometric parameters and runoff using rs & gis techniques
 
Effect of variation of plastic hinge length on the results of non linear anal...
Effect of variation of plastic hinge length on the results of non linear anal...Effect of variation of plastic hinge length on the results of non linear anal...
Effect of variation of plastic hinge length on the results of non linear anal...
 
Effect of use of recycled materials on indirect tensile strength of asphalt c...
Effect of use of recycled materials on indirect tensile strength of asphalt c...Effect of use of recycled materials on indirect tensile strength of asphalt c...
Effect of use of recycled materials on indirect tensile strength of asphalt c...
 

Recently uploaded

Sheet Pile Wall Design and Construction: A Practical Guide for Civil Engineer...
Sheet Pile Wall Design and Construction: A Practical Guide for Civil Engineer...Sheet Pile Wall Design and Construction: A Practical Guide for Civil Engineer...
Sheet Pile Wall Design and Construction: A Practical Guide for Civil Engineer...Dr.Costas Sachpazis
 
Extrusion Processes and Their Limitations
Extrusion Processes and Their LimitationsExtrusion Processes and Their Limitations
Extrusion Processes and Their Limitations120cr0395
 
The Most Attractive Pune Call Girls Manchar 8250192130 Will You Miss This Cha...
The Most Attractive Pune Call Girls Manchar 8250192130 Will You Miss This Cha...The Most Attractive Pune Call Girls Manchar 8250192130 Will You Miss This Cha...
The Most Attractive Pune Call Girls Manchar 8250192130 Will You Miss This Cha...ranjana rawat
 
The Most Attractive Pune Call Girls Budhwar Peth 8250192130 Will You Miss Thi...
The Most Attractive Pune Call Girls Budhwar Peth 8250192130 Will You Miss Thi...The Most Attractive Pune Call Girls Budhwar Peth 8250192130 Will You Miss Thi...
The Most Attractive Pune Call Girls Budhwar Peth 8250192130 Will You Miss Thi...ranjana rawat
 
247267395-1-Symmetric-and-distributed-shared-memory-architectures-ppt (1).ppt
247267395-1-Symmetric-and-distributed-shared-memory-architectures-ppt (1).ppt247267395-1-Symmetric-and-distributed-shared-memory-architectures-ppt (1).ppt
247267395-1-Symmetric-and-distributed-shared-memory-architectures-ppt (1).pptssuser5c9d4b1
 
HARDNESS, FRACTURE TOUGHNESS AND STRENGTH OF CERAMICS
HARDNESS, FRACTURE TOUGHNESS AND STRENGTH OF CERAMICSHARDNESS, FRACTURE TOUGHNESS AND STRENGTH OF CERAMICS
HARDNESS, FRACTURE TOUGHNESS AND STRENGTH OF CERAMICSRajkumarAkumalla
 
AKTU Computer Networks notes --- Unit 3.pdf
AKTU Computer Networks notes ---  Unit 3.pdfAKTU Computer Networks notes ---  Unit 3.pdf
AKTU Computer Networks notes --- Unit 3.pdfankushspencer015
 
OSVC_Meta-Data based Simulation Automation to overcome Verification Challenge...
OSVC_Meta-Data based Simulation Automation to overcome Verification Challenge...OSVC_Meta-Data based Simulation Automation to overcome Verification Challenge...
OSVC_Meta-Data based Simulation Automation to overcome Verification Challenge...Soham Mondal
 
Introduction to Multiple Access Protocol.pptx
Introduction to Multiple Access Protocol.pptxIntroduction to Multiple Access Protocol.pptx
Introduction to Multiple Access Protocol.pptxupamatechverse
 
Call Girls Service Nashik Vaishnavi 7001305949 Independent Escort Service Nashik
Call Girls Service Nashik Vaishnavi 7001305949 Independent Escort Service NashikCall Girls Service Nashik Vaishnavi 7001305949 Independent Escort Service Nashik
Call Girls Service Nashik Vaishnavi 7001305949 Independent Escort Service NashikCall Girls in Nagpur High Profile
 
Top Rated Pune Call Girls Budhwar Peth ⟟ 6297143586 ⟟ Call Me For Genuine Se...
Top Rated  Pune Call Girls Budhwar Peth ⟟ 6297143586 ⟟ Call Me For Genuine Se...Top Rated  Pune Call Girls Budhwar Peth ⟟ 6297143586 ⟟ Call Me For Genuine Se...
Top Rated Pune Call Girls Budhwar Peth ⟟ 6297143586 ⟟ Call Me For Genuine Se...Call Girls in Nagpur High Profile
 
Coefficient of Thermal Expansion and their Importance.pptx
Coefficient of Thermal Expansion and their Importance.pptxCoefficient of Thermal Expansion and their Importance.pptx
Coefficient of Thermal Expansion and their Importance.pptxAsutosh Ranjan
 
(RIA) Call Girls Bhosari ( 7001035870 ) HI-Fi Pune Escorts Service
(RIA) Call Girls Bhosari ( 7001035870 ) HI-Fi Pune Escorts Service(RIA) Call Girls Bhosari ( 7001035870 ) HI-Fi Pune Escorts Service
(RIA) Call Girls Bhosari ( 7001035870 ) HI-Fi Pune Escorts Serviceranjana rawat
 
SPICE PARK APR2024 ( 6,793 SPICE Models )
SPICE PARK APR2024 ( 6,793 SPICE Models )SPICE PARK APR2024 ( 6,793 SPICE Models )
SPICE PARK APR2024 ( 6,793 SPICE Models )Tsuyoshi Horigome
 
VIP Call Girls Service Hitech City Hyderabad Call +91-8250192130
VIP Call Girls Service Hitech City Hyderabad Call +91-8250192130VIP Call Girls Service Hitech City Hyderabad Call +91-8250192130
VIP Call Girls Service Hitech City Hyderabad Call +91-8250192130Suhani Kapoor
 
Microscopic Analysis of Ceramic Materials.pptx
Microscopic Analysis of Ceramic Materials.pptxMicroscopic Analysis of Ceramic Materials.pptx
Microscopic Analysis of Ceramic Materials.pptxpurnimasatapathy1234
 
UNIT-II FMM-Flow Through Circular Conduits
UNIT-II FMM-Flow Through Circular ConduitsUNIT-II FMM-Flow Through Circular Conduits
UNIT-II FMM-Flow Through Circular Conduitsrknatarajan
 
Call for Papers - Educational Administration: Theory and Practice, E-ISSN: 21...
Call for Papers - Educational Administration: Theory and Practice, E-ISSN: 21...Call for Papers - Educational Administration: Theory and Practice, E-ISSN: 21...
Call for Papers - Educational Administration: Theory and Practice, E-ISSN: 21...Christo Ananth
 

Recently uploaded (20)

Sheet Pile Wall Design and Construction: A Practical Guide for Civil Engineer...
Sheet Pile Wall Design and Construction: A Practical Guide for Civil Engineer...Sheet Pile Wall Design and Construction: A Practical Guide for Civil Engineer...
Sheet Pile Wall Design and Construction: A Practical Guide for Civil Engineer...
 
Extrusion Processes and Their Limitations
Extrusion Processes and Their LimitationsExtrusion Processes and Their Limitations
Extrusion Processes and Their Limitations
 
The Most Attractive Pune Call Girls Manchar 8250192130 Will You Miss This Cha...
The Most Attractive Pune Call Girls Manchar 8250192130 Will You Miss This Cha...The Most Attractive Pune Call Girls Manchar 8250192130 Will You Miss This Cha...
The Most Attractive Pune Call Girls Manchar 8250192130 Will You Miss This Cha...
 
The Most Attractive Pune Call Girls Budhwar Peth 8250192130 Will You Miss Thi...
The Most Attractive Pune Call Girls Budhwar Peth 8250192130 Will You Miss Thi...The Most Attractive Pune Call Girls Budhwar Peth 8250192130 Will You Miss Thi...
The Most Attractive Pune Call Girls Budhwar Peth 8250192130 Will You Miss Thi...
 
247267395-1-Symmetric-and-distributed-shared-memory-architectures-ppt (1).ppt
247267395-1-Symmetric-and-distributed-shared-memory-architectures-ppt (1).ppt247267395-1-Symmetric-and-distributed-shared-memory-architectures-ppt (1).ppt
247267395-1-Symmetric-and-distributed-shared-memory-architectures-ppt (1).ppt
 
HARDNESS, FRACTURE TOUGHNESS AND STRENGTH OF CERAMICS
HARDNESS, FRACTURE TOUGHNESS AND STRENGTH OF CERAMICSHARDNESS, FRACTURE TOUGHNESS AND STRENGTH OF CERAMICS
HARDNESS, FRACTURE TOUGHNESS AND STRENGTH OF CERAMICS
 
Roadmap to Membership of RICS - Pathways and Routes
Roadmap to Membership of RICS - Pathways and RoutesRoadmap to Membership of RICS - Pathways and Routes
Roadmap to Membership of RICS - Pathways and Routes
 
AKTU Computer Networks notes --- Unit 3.pdf
AKTU Computer Networks notes ---  Unit 3.pdfAKTU Computer Networks notes ---  Unit 3.pdf
AKTU Computer Networks notes --- Unit 3.pdf
 
OSVC_Meta-Data based Simulation Automation to overcome Verification Challenge...
OSVC_Meta-Data based Simulation Automation to overcome Verification Challenge...OSVC_Meta-Data based Simulation Automation to overcome Verification Challenge...
OSVC_Meta-Data based Simulation Automation to overcome Verification Challenge...
 
Introduction to Multiple Access Protocol.pptx
Introduction to Multiple Access Protocol.pptxIntroduction to Multiple Access Protocol.pptx
Introduction to Multiple Access Protocol.pptx
 
Call Girls Service Nashik Vaishnavi 7001305949 Independent Escort Service Nashik
Call Girls Service Nashik Vaishnavi 7001305949 Independent Escort Service NashikCall Girls Service Nashik Vaishnavi 7001305949 Independent Escort Service Nashik
Call Girls Service Nashik Vaishnavi 7001305949 Independent Escort Service Nashik
 
Top Rated Pune Call Girls Budhwar Peth ⟟ 6297143586 ⟟ Call Me For Genuine Se...
Top Rated  Pune Call Girls Budhwar Peth ⟟ 6297143586 ⟟ Call Me For Genuine Se...Top Rated  Pune Call Girls Budhwar Peth ⟟ 6297143586 ⟟ Call Me For Genuine Se...
Top Rated Pune Call Girls Budhwar Peth ⟟ 6297143586 ⟟ Call Me For Genuine Se...
 
Water Industry Process Automation & Control Monthly - April 2024
Water Industry Process Automation & Control Monthly - April 2024Water Industry Process Automation & Control Monthly - April 2024
Water Industry Process Automation & Control Monthly - April 2024
 
Coefficient of Thermal Expansion and their Importance.pptx
Coefficient of Thermal Expansion and their Importance.pptxCoefficient of Thermal Expansion and their Importance.pptx
Coefficient of Thermal Expansion and their Importance.pptx
 
(RIA) Call Girls Bhosari ( 7001035870 ) HI-Fi Pune Escorts Service
(RIA) Call Girls Bhosari ( 7001035870 ) HI-Fi Pune Escorts Service(RIA) Call Girls Bhosari ( 7001035870 ) HI-Fi Pune Escorts Service
(RIA) Call Girls Bhosari ( 7001035870 ) HI-Fi Pune Escorts Service
 
SPICE PARK APR2024 ( 6,793 SPICE Models )
SPICE PARK APR2024 ( 6,793 SPICE Models )SPICE PARK APR2024 ( 6,793 SPICE Models )
SPICE PARK APR2024 ( 6,793 SPICE Models )
 
VIP Call Girls Service Hitech City Hyderabad Call +91-8250192130
VIP Call Girls Service Hitech City Hyderabad Call +91-8250192130VIP Call Girls Service Hitech City Hyderabad Call +91-8250192130
VIP Call Girls Service Hitech City Hyderabad Call +91-8250192130
 
Microscopic Analysis of Ceramic Materials.pptx
Microscopic Analysis of Ceramic Materials.pptxMicroscopic Analysis of Ceramic Materials.pptx
Microscopic Analysis of Ceramic Materials.pptx
 
UNIT-II FMM-Flow Through Circular Conduits
UNIT-II FMM-Flow Through Circular ConduitsUNIT-II FMM-Flow Through Circular Conduits
UNIT-II FMM-Flow Through Circular Conduits
 
Call for Papers - Educational Administration: Theory and Practice, E-ISSN: 21...
Call for Papers - Educational Administration: Theory and Practice, E-ISSN: 21...Call for Papers - Educational Administration: Theory and Practice, E-ISSN: 21...
Call for Papers - Educational Administration: Theory and Practice, E-ISSN: 21...
 

Statistical analysis to identify the main parameters to effecting wwqi of sewage treatment plant and predicting bod

  • 1. IJRET: International Journal of Research in Engineering and Technology eISSN: 2319-1163 | pISSN: 2321-7308 __________________________________________________________________________________________ Volume: 03 Issue: 01 | Jan-2014, Available @ http://www.ijret.org 186 STATISTICAL ANALYSIS TO IDENTIFY THE MAIN PARAMETERS TO EFFECTING WWQI OF SEWAGE TREATMENT PLANT AND PREDICTING BOD A.K.Khambete1 , R.A.Christian1 1, 2 Associate Professor, Faculty of civil Eng. S.V. National Institute of Technology, Surat Abstract The present study was conducted to determine the wastewater quality index and to study statistical interrelationships amongst different parameters. The equation was developed to predict BOD and WWQI. A number of water quality physicochemical parameters were estimated quantitatively in wastewater samples following methods and procedures as per governing authority guidelines. Wastewater Quality Index (WWQI) is regarded as one of the most effective way to communicate wastewater quality in a collective way regarding wastewater quality parameters. The WWQI of wastewater samples was calculated with fuzzy MCDM methodology. The wastewater quality index for treated wastewater was evaluated considering eight parameters subscribed by Gujarat Pollution control Board (GPCB), a governing authority for environmental monitoring in Gujarat State, India. Considerable uncertainties are involved in the process of defining the treated wastewater quality for specific usage, like irrigation, reuse, etc. The paper presents modeling of cognitive uncertainty in the field data, while dealing with these systems recourse to fuzzy logic. Also a statistical study is done to identify the main affecting variables to the WWQI. The Statistical Regression Analysis has been found to be highly useful tool for correlating different parameters. Correlation Analysis of the data suggests that TDS, SS, BOD, COD, O&G and Cl are significantly correlated with WWQI and DO of wastewater. The estimated BOD from independent variance DO for maximum, minimum and average is 25.35 mg/L, 2.65 mg/L and 13.56 mg/L respectively. While estimated WWQI from independent variance DO for maximum, minimum and average is 0.6212, 0.3074 and 0.4581 respectively. Out of eight parameters, TDS-BOD, TDS-COD, TDS- Cl, SS-BOD, SS-COD, and BOD-COD are significantly correlated. Present study shows that WWQI is influenced by BOD, COD, SS and TDS. Keywords: Wastewater quality, Uncertainty, fuzzy set theory, correlation, Regression. ------------------------------------------------------------------***---------------------------------------------------------------- 1. INTRODUCTION As urban and industrial development increases, the quality of waste generated also increases (Mohmmed, 2006). Discharge of untreated waste in to surface waters, such as rivers, lacks and seas, determine the contamination of waters for human purposes (Gabrieli et al., 1997). The treatment objectives were concerned with the removal of suspended floatable material, the treatment of biodegradable organics and elimination of pathogenic organisms ( Jamrah, 1999). So the wastewater or sewage treatment is one such alternative, where in many processes are designed and operated in order to copy the natural treatment process to reduce contaminant load to a level that environment can hold ( Ravi kumar, 2010). The WQI is presenting a cumulatively derived numerical expression defining a certain level of water quality (Bordelo, 2006). Water quality indices aim at giving a single value to the water quality of a source reducing great amount of parameters into a simpler expression and enabling easy interpretation of monitoring data (Bharti, 2011). In other words, WQI summarizes large amounts of water quality data into simple terms (e.g., excellent, good, bad, etc.) for reporting to management and the public in a consistent manner. Various researchers have considered similar approaches which brought changes to the methodology depending on the usage and parameters under consideration. Prati et al. (1971) considered 13 different parameters of equal weight in their system. And water quality index that is able to rapidly assess whether an effluent—properly polished—is adequate for agricultural or recreational purposes could be of great help to managers and decision makers in water resources planning as well as for comparing different wastewater treatment sequences (Verlicchi et al., 2012). Also there is a need to define one common parameter which could determine the overall efficiency of plant in terms of physical, biochemical and microbiological removal efficiencies (Jamwal 2009). A new fuzzy approach initiated by Zadeh 1965, has been adopted. i.e. Wastewater Quality Index (WWQI), which represent the wastewater quality in terms of
  • 2. IJRET: International Journal of Research in Engineering and Technology eISSN: 2319-1163 | pISSN: 2321-7308 __________________________________________________________________________________________ Volume: 03 Issue: 01 | Jan-2014, Available @ http://www.ijret.org 187 numeric i.e. 0 to 1. Developing the WWQI on the line of WQI is expected to be more practical in implementation and can become effective decision making tool for authority. The Multi Criteria Decision Making (MCDM) method is applied to determine the WWQI at Surat WWTP, and maximum, minimum and average values for WWQI were found out, which are 0.6284, 0.2835 and 0.4433 respectively. Once, WWQI was calculated the correlation between WWQI and all the parameters was calculated. Factor Analysis (FA) was adopted to assist the interpretation of elemental data (Akobundu 2007). So, an attempt has been made to find out the solution of this problem by developing WWQI and computing correlation and regression equations to assess the wastewater quality of an treated wastewater on the basis of few parameters. For this SPSS tool was used. From this analysis, parameters significantly affecting WWQI were found out (TDS, COD, and DO etc.). At last, considering significant parameters, a regression equation was developed using SPSS. This equation was used to calculate WWQI once again. Finally, the results obtained from both MCDM method and further the regression equations were compared and the regression equation was developed to estimate WWQI and BOD from measured value of DO. 2. WATER QUALITY INDEX BY MCDM METHOD Due to fluctuations in organic and hydraulic loading in a wastewater treatment plant, the application of fuzzy logic, using linguistic variables gave a better description of performance parameters. The number of criteria in multi- criteria decision making is virtually assumed to be finite (Evangelos,2000 and Klir,1998). Balteiro and Romero (2004) utilized a sustainability aggregating model in search an index to natural systems sustainability. Chen et al. (2011) utilized fuzzy MCDM approach and fuzzy AHP for selecting the best environment-watershed plan in Taiwan. 2.1 Multi Criteria Decision Making (MCDM) approach for Determination of the WWQI The approach for the evaluating WWQI of treated wastewater is based on somewhat analogous to the procedure suggested by Singh and Tong (2005). The chart portrays an overview of the fuzzy decision framework for evaluating the MPAI, which is self-explanatory Figure 1.The first step is identification of environmental experts. Fig 1:Step Involved in a MCDM ModelAssignimportance weightage to the sub criteria of wastewater. Weight for each of the sub criterion is developed by normalized weight method by consulting the environmental experts. In the present study, five fuzzy numbers are selected to describe the level of performance on decision criteria in evaluation of MPAI. Five linguistic variables are used because it is convenient for an expert to distinguish subjectively between them. The approach for developing MPAI was based on strength of different parameters is somewhat analogous to the procedure suggested by Singh and Tong (2005). Linguistic variables assigned for the study were five; Highly Significant (HS), Significant (S), Average Significant (AV), Low Significant (LS), and Not Significant (NS).Each were defined with four fuzzy numbers average of the numbers assigned by experts presented in Table below. Table 1: Fuzzy numbers associated with the corresponding Linguistic Variables. The graphical presentation of fuzzy numbers for the linguistic variables used by seven environmental experts to develop weightage for each criterion is shown in Figure2. Linguistic variables Fuzzy Number Highly Significant (HS) (0.7,0.8,0.9,1.0) Significant (S) (0.5,0.6,0.7,0.8) Average Significant(AS) (0.3,0.40.5,0.6) Low Significant (LS) (0.1,0.2,0.3,0.4) Not Significant (NS) (0.0,0.0,0.1,0.2)
  • 3. IJRET: International Journal of Research in Engineering and Technology eISSN: 2319-1163 | pISSN: 2321-7308 __________________________________________________________________________________________ Volume: 03 Issue: 01 | Jan-2014, Available @ http://www.ijret.org 188 Fig 2: Graphical representation of trapezoidal membership function The weightage factors are computed for eight sub criteria (parameters) of wastewater for raw and treated wastewater. On the basis of the experts’ opinion (linguistic variable) or perception, a fuzzy decision matrix for the sub criteria of wastewater is computed. Weights are evaluated using the equation given below. The average fuzzy numbers for all the environmental experts’ opinion can be expressed as Ak ij = 1 p ai1 k + ai2 k + ai3 k + ⋯ … . . + ap k for j = 1, 2, … … , p (1) Where akij be the fuzzy number (weight) assigned to an alternative Ai by DMj (Decision Maker i) for the decision criteria Ck and p is the number of environment experts involved in the evaluation process. The linguistic variables as assigned by the experts are converted to fuzzy numbers used in the above expressions through Figure. Now, the defuzzified values for the sub-criteria are obtained by the equation below; (Kaufmann; 1991). e =X1 +X2 +X3+X4/4 (2) The normalized weight for each sub criterion of raw and treated wastewater is obtained by dividing the scores of each sub criterion ( ijC ) by the total of all sub-criterion ( ijC ). The next step is to convert the parametric values of raw and treated wastewater to the fuzzy numbers (membership functions) based on the specified statutory norms. Using simple additive weighing method (Hwang and Yoon, 1981), the overall score (OS) in terms of MPAI for raw and treated wastewater criteria can be calculated using following equation.    ..,2,1kforCWX kkOS n  (3) Where,  kCW =weight (importance value) of the sub criterion k and kX = crisp score (defuzzified value) of treated data against the sub criterion k. 2.2Stastical Analysis To evaluate wastewater quality from a large number of ample each having number of parameters is difficult. To analyze the water quality, different approaches like statistical analysis of individual parameter, multi- stressor water quality indices ect. have been considered (Venkatesha, 2010). Statistical analysis are generally used to identify the calculated WWQI is appropriate or not. For this purpose Correlation Analysis and Multiple Linear Regression analysis were performed. Correlation Analysis: Correlation is a measure of degree of linear relationship between two variables. It expresses the extent to which two variables vary together in same directions or opposite directions. Correlation coefficients reveal the magnitude and direction of the relationships. A correlation has value ranging from -1 to 1.Values that are closer to the absolute value 1 indicate that there is a strong positive linear relationship between the variables being correlated, whereas values closer to 0 indicate that there is no liner relationship between two variables under study. Below table 5 shows the correlation between different parameters, which are, applied to evaluate WWQI for treated wastewater. Correlation between different parameters was found out by Florence P. et al(2010) for Water Quality Index and Correlation Study at YercaudTaluk, Salem, Tamil Nadu, India. Also, correlation analysis for lower Maniar Reservoir was carried out by Thirupathaiah M. et. Al.(2012) Multiple Linear Regression Analysis: It is one of the very important statistical tools which are used in almost all fields of sciences. According to Rastogi, 2011, the Statistical Regression Analysis has been found to be highly useful tool for correlating different parameters. This has twofold advantages. First with the help of correlation analysis it is easy to find out interrelationship between different parameters and also the main parameters affecting the WWQI can be easily figured out. Later with the help of the regression equation WWQI was calculated again and the degree of match is checked. With help of this one can easily eliminate tedious laboratory work of determining all parameters and can carry out its work only with the parameters that are significantly correlated in the regression equation. In regression analysis there are two types of variables. The variable whose value is influenced is called dependent variable and the variables which influence the dependent variable are called explanatory (regressors) variables. And the model equation is: Y= β0 + β1X1 + β2 X2 + β3X3 + β4 X4 + β5X5 + β6 X6 + β7X7+ β8X8 + e (4) This model should be free from (as assumptions of applying this criteria), Multicolinearity (regressors are correlated),
  • 4. IJRET: International Journal of Research in Engineering and Technology eISSN: 2319-1163 | pISSN: 2321-7308 __________________________________________________________________________________________ Volume: 03 Issue: 01 | Jan-2014, Available @ http://www.ijret.org 189 Heteroscedasticity (error variance is nonconstant), and Auto- correlation (error terms are correlated). In this study WWQI is considered as dependent variable and parameters are considered as explanatory variables. Chenini et al(2009) have successfully applied multiple linear regression for Evaluation of ground water quality. Rene et. al.(2008) has also applied regression equation for prediction of water quality indices. 3. MATERIALS & METHODOLOGY 3.1 Site Selection As the study is concerned with the development of WWQI for the treated wastewaters. All the samples were collected from Anjana Treatment Plant located in Surat city itself. All the samples were collected at fix time i.e. at 1 PM to 1.30 PM for a time period of 1 year. 3.2 Sampling Procedure For sampling, the procedure described in Standard Methods and IS 3025 was adopted. DO fixation was performed at the location itself by adding Manganese Sulfate and Alkaline KI solution. For other physico – chemical parameters, samples were collected in 1 liter plastic bottles. Samples were collected in container rinsed with detergents, nitric acid and finally with distilled water. These plastic bottles were placed in ice box to maintain the temperature during travelling periods of sampling. 3.3 Sample Analysis The collected water samples are analyzed for eight different parameters including Temperature, Total dissolved solids (TDS), Suspended solids (SS), Biochemical demand (BOD), Chemical oxygen demand (COD), Oil and grease (O&G),pH and Chlorides (Cl). All the analyses are carried out as per the guidelines provided in Standard Methods and IS: 3025 (1964).Temperature, DO and pH were measured at the timeof sample collation. 4 RESULTS AND DISCUSSION Constant monitoring of all the parameters described by CPCB was carried out weekly throughout the year 2011.maximum, minimum and average values of the analyzed data is summarized in Table 2. As the treated wastewater was chlorinated before discharge the FC and FS are omitted as the wastewater was chlorinated before final discharge in to river Tapi. Out of measured nine parameters total eight parameters, except DO were considered to develop WWQI (Table3). Table 2Minimum, maximum and average Data at Anjana STP Note: Except Temperature and pH all parameters are in mg/L Table 3 Minimum, maximum and average values for WWQI by MCDM method and regression equation Data WWQI by MCDM WWQI by regression equation (With 6 paramters) WWQI by regression equation (With 5 parameters) Max 0.6284 0.5711 0.6172 Min 0.2835 0.2992 0.3059 Average 0.4433 0.4241 0.4465 Then with the help of Pearson Correlation (Table 4) statistically significantly correlated variables were identified. Parameters Temp. TDS SS BOD COD O & G Cl pH DO Treated Wastewater Discharge Limits 40 2100 100 30 100 10 600 6.5-8.5 - Max 33.80 792.00 40.00 23.00 128.00 0.80 360.00 8.05 0.74 Min 24.50 634.00 6.00 5.00 32.00 0.10 280.00 7.49 5.34 Average 28.90 732.07 22.14 12.28 67.81 0.41 317.93 7.70 3.13 Weights 0.108 0.117 0.141 0.166 0.154 0.08 0.141 0.092 - Membership Grade Xk Max 0.8450 0.3771 0.4000 0.7667 1.0000 0.0800 0.6000 0.6999 Min 0.6125 0.3019 0.0600 0.1667 0.3200 0.0100 0.4667 0.3266 Average 0.7225 0.3486 0.2214 0.4093 0.6781 0.0410 0.5299 0.4666
  • 5. IJRET: International Journal of Research in Engineering and Technology eISSN: 2319-1163 | pISSN: 2321-7308 __________________________________________________________________________________________ Volume: 03 Issue: 01 | Jan-2014, Available @ http://www.ijret.org 190 Table 4 Pearson Correlation Coefficients showing relation between all the parameters Temp TDS SS BOD COD O&G Cl pH DO WWQI Temp 1 TDS .989** 1 SS -.522** -.513** 1 BOD -.945** -.953** .584** 1 COD .862** .887** -.245** -.806** 1 OG -.985** -.996** .524** .955** -.887** 1 Cl .991** .997** -.509** -.947** .885** -.991** 1 pH -.887** -.897** .517** .970** -.797** .895** -.893** 1 DO -.985** -.996** .522** .958** -.888** 1.000** -.991** .899** 1 WWQI .056 .287** .720** .920** .893** .089 .321** .194 -.984** 1 Out of eight parameters, Out of eight parameters, TDS-SS, TDS-BOD, TDS-COD, TDS-OG, TDS-pH, TDS-DO, SS- BOD, SS-COD, SS-OG, SS-Cl, SS-pH, SS-DO, BOD-COD, BOD-OG, BOD-Cl, BOD-pH, BOD-DO, COD-OG, COD-Cl, COD-pH, COD-DO, OG-Cl, OG-pH, OG-DO, Cl-pH, Cl-DO, pH-DO are found to be significantly correlated with each other (Table 4). Also it was found that WWQI is significantly correlated with TDS, SS, BOD, COD, Cl and DO which means that out of these nine parameters, only Six parameters are responsible for the deviation or change in the values of WWQI. Now as our main motive is to check the WWQI is correctly drawn or not, we go for regression. From Table 5, unstandardized coefficients for the equation constant, TDS, SS, BOD, COD, Chloride and DO as 0.456, 0.0000103, 0.000451, 0.002448, 0.000530, 0.000128, and -0.0412 respectively. These coefficients were replaced with the coefficients of equation 4 and Y predicted is presented in equation 2. Table 6 shows that the model fit with 98.5% of accuracy. Y Estimated = 0.456 + 0.0000103 X1+ 0.000451 X2 + 0.002448 X3 + 0.000530 X4 + 0.000128 X5 - 0.0412 X6 ………………….(5) Where Y= WWQI, X1= TDS, X2= SS, X3= BOD, X4 = COD, X5 =Cl, and X6 = DO Table 5: Coefficients for regression analysis (Model 1) Coefficients Standard Error t Stat Significance Constant 0.456091134 0.029309116 15.56140879 6.45896E-26 TDS 1.03817E-05 3.97293E-05 0.261309917 0.794525072 SS 0.000451482 0.000158837 2.842434083 0.005679048 BOD 0.002448483 0.000387202 6.323524967 1.36726E-08 COD 0.000530319 7.9732E-05 6.651263435 3.29148E-09 Cl 0.000128486 6.10444E-05 2.104788562 0.038448341 DO -0.041153394 0.003067748 -13.41485266 3.58124E-22 Table 6: Model Summary (Model 1) Model R R Square Adjusted R Square Std. Error of the Estimate Durbin-Watson 1 .993 .986 .985 .00642 1.937
  • 6. IJRET: International Journal of Research in Engineering and Technology eISSN: 2319-1163 | pISSN: 2321-7308 __________________________________________________________________________________________ Volume: 03 Issue: 01 | Jan-2014, Available @ http://www.ijret.org 191 Table 7: ANOVA (Model 1) Model Sum of Squares df Mean Square F Sig. 1 Regression .240 6 .040 972.248 .000 Residual .003 80 .000 Total .244 86 This model is fitted significantly as F= 972.248 (Sig F: 0.000) (Table 7), also root mean square error (RMSE) is 0.000. This model is not having problem of auto correlation as Durbin- Watson test statistic is 1.937 which is nearer to 2 (Table 6). As TDS was found to be correlated significantly with most of the other parameters, TDS was neglected and again the regression analysis was executed in order to develop a new equation. So TDS is dropped and re calculated the WWQI and again fitted the regression model, and got the regression equation as follows with 98.2% of accuracy (Table 9). Y Estimated = 0.4595 + 0.000457 X1+ 0.002464 X2 + 0.000527 X3 + 0.000141X4 -0.0412X5 (Table 8) (6) Where Y= WWQI after dropping TDS, X1=SS, X2=BOD, X3=COD, X4 = Cl, and X5 =DO Table 8: Coefficients for Regression Analysis (b) Coefficients Standard Error t Stat P-value Constant 0.459523038 0.026050707 17.63956079 1.79428E-29 SS 0.000456715 0.00015666 2.915317416 0.004593801 BOD 0.002464727 0.000379976 6.486540962 6.48043E-09 COD 0.000527356 7.84664E-05 6.720784388 2.32032E-09 Cl 0.000140821 3.84823E-05 3.659358498 0.000448766 DO -0.041114604 0.003046481 -13.49576953 1.99668E-22 Table 9: Model Summary (b) Model R R Square Adjusted R Square Std. Error of the Estimate Durbin-Watson 1 .993 .986 .986 .00638 1.954 Table 10: ANOVA (b) Model Sum of Squares df Mean Square F Sig. 2 Regression .240 5 .048 1180.260 .000b Residual .003 81 .000 Total .244 86 This model is fitted significantly as F= 1180.260 (p-value: 0.000) (Table 10), also root mean square error (RMSE) is 0.000. Each parameter has significant effect on WWQI (Table 8). This model is not having problem of auto correlation as Durbin-Watson test statistic is 1.954 which is nearer to 2 (Table 9). Now DO depends on the strength of wastewater i.e. WWQI. As the value of WWQI is close to 1, poor is the quality of treated wastewater and measured DO will be less in quantity and for the WWQI nearer to zero , quality of wastewater is very good for reuse and the DO will be more. In order to predict BOD, regression equation can be fitted with BOD as explanatory variable and DO as dependent variable. Following equation was developed to calculate BOD. Y Estimated = 29.182 + 0.951 X1+e (Table 11) ……..……. (7) Where Y=BOD, X1= DO and e is error term.This model is fitted significantly as F= 356.781 (p-value: 0.000) (Table 13), also root mean square error (RMSE) is 0.000 with 96.9% of accuracy (Table 12).
  • 7. IJRET: International Journal of Research in Engineering and Technology eISSN: 2319-1163 | pISSN: 2321-7308 __________________________________________________________________________________________ Volume: 03 Issue: 01 | Jan-2014, Available @ http://www.ijret.org 192 Table 11: Coefficients for Regression Analysis (c) Table 12: Model Summary (c) Table 13: ANOVA (c) Model Sum of Squares df Mean Square F Sig. 1 Regression 1237.090 1 1237.090 356.781 .000a Residual 294.726 85 3.467 Total 1531.816 86 a. Predictors: (Constant), DO b. Dependent Variable: BOD Similarly the WWQI can be estimated from regression equation fitted with WWQI as explanatory variable and DO as dependent variable. Following equation was developed to calculate WWQI. Y Estimated = 0.672 - 0.068 X1+e (Table 14) Where Y=WWQI, X1= DO and e is error term. This model is fitted significantly as F= 2800.788 (p-value: 0.000) (Table 16), also root mean square error (RMSE) is 0.000 with 97.1 % of accuracy (Table 15). Table 14: Coefficients for Regression Analysis (d) Table 15: Model Summary (d) Model R R Square Adjusted R Square Std. Error of the Estimate R Square Change Durbin-Watson 1 .985a .971 .970 .0091875 .971 1.608 Model Unstandardized Coefficients Standardized Coefficients t Sig. B Std. Error Beta 1 (Constant) 29.182 .951 30.698 .000 DO -4.966- .273 -.892- -18.203- .000 Model R R Square Adjusted R Square Std. Error of the Estimate 3 .985(a) .969 .969 4.18460 Model Unstandardized Coefficients Standardized Coefficients t Sig. B Std. Error Beta 1 (Constant) .672 .004 150.041 .000 DO -.068 .001 -.985- -52.922- .000 a. Dependent Variable: WWQI
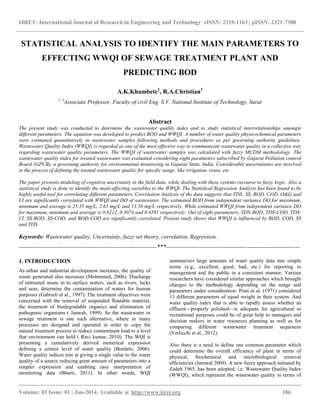
  • 8. IJRET: International Journal of Research in Engineering and Technology eISSN: 2319-1163 | pISSN: 2321-7308 __________________________________________________________________________________________ Volume: 03 Issue: 01 | Jan-2014, Available @ http://www.ijret.org 193 Table 16: ANOVA (c) Model Sum of Squares df Mean Square F Sig. 1 Regression .236 1 .236 2800.788 .000a Residual .007 85 .000 Total .244 86 a. Predictors: (Constant), DO b. Dependent Variable: WWQI The graphical comparison for WWQI developed by MCDM Method and both regression equations is shown in Figure 3. The Figure 3shows that the result slightly deviates with TDS and it almost matches without TDS. Fig 3 Comparison in WWQI calculated by MCDM method and two regression equations Figure 4 shows the comparison between BOD and BOD Estimated from regression equation and Figure 5 shows the Comparisonbetween WWQIand WWQI Estimated. Figure 4 shows the comparison between BOD and BOD Estimated 0.2000 0.2500 0.3000 0.3500 0.4000 0.4500 0.5000 0.5500 0.6000 0.6500 1 4 7 10 13 16 19 22 25 28 31 34 37 40 43 46 49 52 55 58 61 64 67 70 73 76 79 82 85 WWQI Number of samples No. of Samples V/S WWQI WWQI by MCDM WWQI by Regression Equation (With TDS) 0 5 10 15 20 25 3.21 3.27 1.89 3.76 4.85 3.55 4.47 4.29 3.06 2.34 2.27 3.83 2.83 3.82 3.64 4.59 4.21 1.53 3.23 2.65 3.62 3.04 BOD&EstimatedBOD DO mg/L DO v/s BOD BOD BOD Estimated
  • 9. IJRET: International Journal of Research in Engineering and Technology eISSN: 2319-1163 | pISSN: 2321-7308 __________________________________________________________________________________________ Volume: 03 Issue: 01 | Jan-2014, Available @ http://www.ijret.org 194 Fig 5 shows the comparison between WWQI and WWQI Estimated. CONCLUSIONS First WWQI was found and later the correlation for the interrelation between different parameters and their correlation with WWQI was determined with help of SPSS. From this analysis WWQI is significantly correlated with TDS, SS, BOD, COD, Cl and DO which means that out of these nine parameters, only Six parameters are responsible for the deviation or change in the values of WWQI. Also it was found that TDS, SS, BOD, COD, Cl and DO were significantly correlated with WWQI at 0.01 Level. When 6 parameters were considered and regression equation was developed, it was found nearly 98.2 % accurate. Y Estimated = 0.456 + 0.0000103 X1+ 0.000451 X2 + 0.002448 X3 + 0.000530 X4 + 0.000128 X5 - 0.0412 X6 . It has the standard error of 0.00642. Now, as it has R Square > .75, the equation is acceptable and can be applied to determine WWQI instead of performing whole tedious procedure of MCDM Method. Further omitting TDS and considering five parameters and developed regression equation it was found 98.6 % fitting with the original WWQI. The equation was like: Y Estimated = 0.4595 + 0.000457 X1+ 0.002464 X2 + 0.000527 X3 + 0.000141 X4 - 0.0412X5. It has the standard error of 0.969. Now, as it has R Square > .75, this equation is also acceptable and can be applied to determine WWQI instead of performing whole tedious procedure of MCDM Method. But, as accuracy increases only about 0.04%, we can neglect determination of TDS also which may result in considerable time saving and reduce complications in determination of WWQI. The estimated BOD from independent variance DO for maximum, minimum and average is 25.35 mg/L, 2.65 mg/L and 13.56 mg/L respectively. While estimated WWQI from independent variance DO for maximum, minimum and average is 0.6212, 0.3074 and 0.4581 respectively. Hence, instead of analyzing all 9 parameters (neglecting FC and FS) only 6 or 5 parameters can provide results with sufficient accuracy around 98-99 %. This eliminates tedious procedure of determining and testing each and every parameter which ultimately results in considerable amount of time, chemicals and money savings. Also higher accuracy eliminates any chances of deviation form original WWQI expect shock loadings. REFERENCES [1] Akobundu A. N., Quality assessment of Aba River using heavy metal pollution index, Am. J. Environ. Engin., 2012, 2(1), 45-49. [2] American public health association, (APHA). Standard methods for the examination of water and wastewaters, 2003. (21th edn). Washington, DC, USA. [3] Balteiro, L., and Romero, C., In search of a natural systems sustainability index, 2004, Ecological Economics, 49 (3), 401-405. [4] Bharti N. and Katyal D., Water quality indices used for surface water vulnerability assessment, International Journal of Environmental Science, 2011, 2(1), 154-173. 0.2000 0.2500 0.3000 0.3500 0.4000 0.4500 0.5000 0.5500 0.6000 3.21 3.27 1.89 3.76 4.85 3.55 4.47 4.29 3.06 2.34 2.27 3.83 2.83 3.82 3.64 4.59 4.21 1.53 3.23 2.65 3.62 3.04 WWQI DO DO v/s WWQI WWQI WWQI Estimated
  • 10. IJRET: International Journal of Research in Engineering and TechnologyeISSN: 2319-1163 | pISSN: 2321-7308 __________________________________________________________________________________________ Volume: 03 Issue: 01 | Jan-2014, Available @ http://www.ijret.org 195 [5] Bordalo A. A., Teixeira R. and Wiebe W. J., A water quality index applied to an international shared river basin : The case of the Douro River, Environ. Manag., 38(1), 2006, 910–920. [6] Chen,Y., C., Lien, H., P., Tzeng, G., H., and Yang, L., S., Fuzzy MCDM approach for selecting the best environment-watershed plan, Applied Soft Computing Journal, 2011,11(1), 265-275. [7] Chenini I. and Khemiri S., Evaluation of ground water quality using multiple linear regression and structural equation modelling, Int.J. Environ. Sci. Tech., 2009, 6 (3), 509-519. [8] Evangelos., P mastering visual basic 6, BPP Publications, New Delhi, (2000). [9] Florence P. L., Paulraj A.,Ramachandramoorthy T., Water Quality Index and correlation study for the assessment of water quality and its parameters of YercaudAluk, Salem District, Tamil Nadu, India, Chem. Sci.Trans., 2010,1(1), 139-14. [10] Gabrieli, R.; Divizia, M.; Donia, D.; Ruscio, V.; Bonadonna, L.; Diotallevi, C.; Villa, L.; Manzone, G.; Panà, A., Evaluation of the wastewater treatment plant of Rome airport. Water Science and Technology, 1997, vol. 35, issue 11-12. p. 193-196 [11] Hwang, C., and Yoon, K. Multiple attribute decision making – methods and applications, A state of the art survey, Springer-Verlag, Berlin. ,1981. [12] Jamrah, A., I., Assessment of characteristics and biological treatment technologies of Jordanian wastewater, 1999, Bioprocess Engineering, 21: 331- 340. [13] Jamwal, P., Mittal, A., K. and Mouchel,J., M. Efficiency evaluation of sewage treatment plants with different technologies in Delhi, (India). 2009, Environmental Monitoring assessment,153, 293-305. [14] Kaufman, A., and Gupta, M., M. , Fuzzy mathematical modelling in engineering and management sciences, Fuzzy Set and Systems, 1991, 43, 17–32. [15] Klir, G., J., and Yuan, B. , Operation of fuzzy sets in: Ruspini, E. H., Bonissone, P. P. and Pedryez W., Handbook of Fuzzy Computation, Institute of Physics Publishing, Dirac House, temple Bath, Bristol , 1998. [16] Mohammed,B , Design and Performance Evaluation of a Wastewater Treatment Unit.” Australian Journal of Technology. , 2006, 9(3): 193-198 . [17] Prati L., Pavanello R. and PesarinF.,Assessment of surface water quality by a single index of pollution, J. Wat. Res.,1971, 5(1), 74. [18] Rastogi. G.K. and Sinha D. K., A novel approach to water quality management through correlation study, Journal of Environmental Research and Development , 2011, 5 ,(4), 1029-1035. [19] Ravikumar, P., Liza, B., Pinto. andSomashekar, R., K., Assessment of the Efficiency of Sewage Treatment plants: A Comparative Study between NagasandraandMailasandra Sewage Treatment Plants. 2010, Kathmandu University, Journal of Science Engineering and Technology, 6(2), 115-125. [20] Rene E. and Saidutta M. B., Prediction of Water Quality indices by regression analysis and artificial neural networks, Int. Environ. Res., 2008,2(2), 183- 188. [21] Singh, D. and Robert L. K.Tiong, A fuzzy decision framework for contractor selection, 2005, Journal of Construction Engineering and Management (ASCE), 131(1), 62-70. [22] Thirupathaiah M., Samatha C. andSammaiah C., Analysis of water quality using physico-chemical parameters in lower manair reservoir of Karimnagardistrict,Andhra Pradesh, Int. J. Environ. Sci., 2012,3(1), 172-180. [23] Venkatesharaju K., Somashekar R. K and Prakash K. L., Study of seasonal and spatial variation in surface water quality of Cauvery River Stretch in Karnataka, J. Ecol. Nat. Environ., 2010, 2(1), 1-9. [24] Verlicchi P, Masotti L, Galletti A. Wastewater polishing index: a tool for a rapid quality assessment of reclaimed wastewater. Environtal Monitoring and Assessment; 2011, 173(1-4):267-77. doi: 10.1007/s10661-010-1386-7. Epub 2010 Mar 9. BIOGRAPHIES Mrs. Anjali Khambete has received her bachelor’s and master’s from S V National Institute of Technology, Surat. Currently working as Associate Professor in the department of Civil engineering. At SVNIT, Surat. Her research interests are in the field of water and wastewater engineering. Fuzzy logic, Dr. Robin Christian has received his master’s and PhD from S V National Institute of Technology, Surat. Currently working as Associate Professor in the department of Civil engineering. At SVN IT, Surat. His research interests are noise pollution, application of fuzzy logic in environmental field. Published many papers in international journals related to environmental engineering.