SlideShare a Scribd company logo
1 of 9
Download to read offline
IJRET: International Journal of Research in Engineering and Technology eISSN: 2319-1163 | pISSN: 2321-7308
__________________________________________________________________________________________
Volume: 02 Issue: 10 | Oct-2013, Available @ http://www.ijret.org 185
DEVELOPMENT OF MATHEMATICAL MODEL ON GAS TUNGSTEN
ARC WELDING PROCESS PARAMETERS
K. Ashok Kumar1
, G.Satish2
, V. Lakshmi Narayana3
, N. Srinivasa Rao4
1, 2, 3, 4
Assistant Professor, Mechanical Engineering Department, Shri Vishnu Engineering College For Women, Andhra
Pradesh, India,
ashokkumark@svecw.edu.in, satishg@svecw.edu.in, lakshminarayanav@svecw.edu.in, srinivasraon@svecw.edu.in
Abstract
GAS TUNGSTEN ARC WELDING (GTAW) is the quality weld process. It is preferred welding process for stainless steel, low alloy
steel, nickel, cobalt, titanium, aluminum, copper, and magnesium. The present work aims to evaluate the effect of Gas Tungsten Arc
Welding process parameters on the quality of the weld bead. The process parameters Welding Current, Wire Diameter, Wire Feed
Speed, Ratio of wire feed rate to travel speed and Plate thickness are taken as a input variables for this present work. The quality of
the weld bead can be assessed by the bead characteristics such as Penetration, Reinforcement & Width. Experiments were conducted
to study the effects of the welding process parameters. Statistically designed experiments with 5 process parameters (each at 3 levels)
are conducted to study the effect of these parameters on bead geometry. It is found from the analysis of variance (ANOVA) that the
wire feed rate, travel speed and wire diameter are the main parameters that influence bead geometry in GTAW. Mathematical models
are developed for depth of penetration, reinforcement height and bead width for GTAW using the multiple regression analysis.
Index Terms: GTAW, DataFit version 9.0.59, I, D, WFR, TS, PT.
--------------------------------------------------------------------***----------------------------------------------------------------------
1. INTRODUCTION
Gas tungsten arc welding (GTAW), also known as tungsten inert
gas (TIG) welding, is an arc welding process that uses a non-
consumable tungsten electrode to produce the weld. The weld area
is protected from atmospheric contamination by a shielding gas
(usually an inert gas such as argon), and a filler metal is normally
used, though some welds, known as autogenous welds, do not
require it. A constant-current welding power supply produces
energy which is conducted across the arc through a column of
highly ionized gas and metal vapors known as plasma.
GTAW process is a candidate welding process, as it produces high
quality and consistent welds and provides excellent control of heat
input. The GTAW process uses a non-consumable electrode
protected by an inert gas. As this process uses a non-consumable
electrode, extra material, if required, is added through a filler wire
either manually or using a wire feeder.
GTAW is most commonly used to weld thin sections of stainless
steel and non-ferrous metals such as aluminum, magnesium, and
copper alloys. The process grants the operator greater control over
the weld than competing procedures such as shielded metal arc
welding and gas metal arc welding, allowing for stronger, higher
quality welds. However, it is comparatively more complex and
difficult to master, and furthermore, it is significantly slower than
most other welding techniques. A related process, plasma arc
welding, uses a slightly different welding torch to create a more
focused welding arc and as a result is often automated. . TIG
welding has become a popular choice of welding processes when
high quality, precision welding is required.
GTAW is frequently referred to as TIG welding. TIG welding is a
commonly used high quality welding process. TIG welding has
become a popular choice of welding processes when high quality,
precision welding is required.
In TIG welding an arc is formed between a non-consumable
tungsten electrode and the metal being welded. Gas is fed through
the torch to shield the electrode and molten weld pool. If filler
wire is used, it is added to the weld pool separately.
Fig -1: Automatic GTAW System setup.
IJRET: International Journal of Research in Engineering and Technology eISSN: 2319-1163 | pISSN: 2321-7308
__________________________________________________________________________________________
Volume: 02 Issue: 10 | Oct-2013, Available @ http://www.ijret.org 186
The weld-bead formed by the GTAW process plays an important
role in determining the mechanical properties of the weld and its
quality. The weld-bead geometry also directly affects the
complexity of weld schedules. The weld-bead shape parameters
such as the bead width, reinforcement height and depth of
penetration, shown in Fig 2, are determined by the GTAW process
parameters such as current, voltage, welding speed and wire feed
rate.
Fig – 2: Weld bead geometry.
1.1 Statistical Design of Experiments
A designed experiment is the simultaneous evaluation of two or
more factors (parameters) for their ability to affect the resultant
average or variability of particular product or process
characteristics. To accomplish this in an effective and statistically
proper fashion, the levels of the factors are varied in a strategic
manner, the results of the particular test combinations are
observed, and the complete set of results is analyzed to determine
the important factors and preferred levels, and to find whether
increase or decrease of those levels will potentially lead to further
improvement. The initial experiments, often referred to as
screening experiments, are used to find the few important,
significant factors out of many possible factors involved with a
product or process design. This experiment is typically a small
experiment with many factors at two levels. Later rounds of
experiments typically involve few factors at more than two levels
to determine conditions of further improvement.
1.2 The Phases in Design of Experiments.
The design of experiments (DOE) process is divided into three
main phases as (1) the planning phase (2) the conducting phase (3)
the analyses phase.
The planning phase is by far the most important phase for the
experiment to provide the expected information. An experimenter
will learn the information from any experiment, sometimes in a
positive sense and sometimes in a negative sense. Positive
information is an indication of which factors and which levels lead
to improved product or process performance. Negative
information is an indication of which factors don‟t lead to
improvement, but no indication of which factors do. If the
experiment includes the real, yet unknown, influential factors, the
experiment will yield negative information. In the planning phase
factors and levels are selected and, therefore, it is the most
important stage of experimentation. Also, the correct selection of
factors and levels is nonstatistical in nature and is more dependent
upon product and process expertise.
The second most important phase is the conducting phase, where
test results are actually collected. If experiments are well planned
and conducted, the analysis is much easier and more likely to yield
positive information about factors and levels.
In the analysis phase is the positive or negative information
concerning the selected factors and levels is generated based on
the previous two phases. This phase is most statistical in nature of
the three phases of the DOE.
1.3 Taguchi Method.
Although fractional factorial design allows a fraction of the total
number of runs required in the factorial design, there are no
general guidelines for its application or the analysis of the results
obtained by performing the experiments. Taguchi‟s approach
complements these two important areas. First, he clearly defines a
set of general designs for factorial experiments that cover many
applications. The special set of designs consists of orthogonal
arrays (OA). The use of these arrays helps to determine the least
number of experiments needed for a given set of factors. A
comparison of number of experiments in factorial design and
Taguchi design is presented in Table 1. Second, he devised a
standard method for analysis of the results. The combination of
standard experimental design techniques and analysis methods in
the Taguchi approach produces consistency and reproducibility
rarely found in any other statistical method.
Table -1: Comparison of Factorial design and Taguchi design
Factors Level
Factorial design
Total no. of
experiments
Taguchi
Design
2 2 4(22) 4
3 2 8(23) 4
4 2 16(24) 8
7 2 128(27) 8
15 2 32768(215) 16
4 3 81(34) 9
5 3 243(35) 18
Taguchi has established orthogonal arrays (OA) to describe a large
number of experimental situations. The symbolic designation for
these arrays carries the key information on the size of the
experiment. For example, designated array L18 requires 18 trail
runs; L9 requires 9 experiments and so on. The vertical columns of
the arrays acquire a special combinatorial property i.e., in any pair
of columns in an OA, all combinations of the treatment (of the two
factors assigned to this pair) occur and they do so an equal number
of times. This property is called the balancing property of OAs.
This balancing property permits the use of simple arithmetic to
IJRET: International Journal of Research in Engineering and Technology eISSN: 2319-1163 | pISSN: 2321-7308
__________________________________________________________________________________________
Volume: 02 Issue: 10 | Oct-2013, Available @ http://www.ijret.org 187
find the effect of the experimental factors on the response under
study. Taguchi has tabulated 18 basic orthogonal arrays that we
call standard orthogonal arrays. The standard orthogonal arrays
along with the number of columns at different levels for these
arrays are listed in Table 2.
Table -2: Standard Orthogonal Arrays.
Orthogonal
Array
Number
of
Rows
Maximum
No of
factors
Maximum no of
columns At these levels
2 3 4 5
L4
L8
L9
L12
4
8
9
12
3
7
4
11
3
7
-
11
-
-
4
-
-
-
-
-
-
-
-
-
L16
L‟16
L18
L25
16
16
18
25
15
5
8
6
15
-
1
-
-
-
7
-
-
5
-
-
-
-
-
6
L27
L32
L‟32
L36
L‟36
27
32
32
36
36
13
31
10
23
16
-
31
1
11
3
13
-
-
12
13
-
-
9
-
-
-
-
-
-
-
L50
L54
L64
L‟64
L81
50
54
64
64
81
12
26
63
21
40
1
1
63
-
-
-
25
-
-
40
-
-
-
21
-
11
-
-
-
-
1.4 ANOVA Terms and Notations.
The analysis of variance computes quantities known as degrees of
freedom, sum of squares, mean squares, etc. and organizes them in
a standard tabular format. These quantities and their
interrelationships are defined as given below using the following
notation.
V = mean squares (variance)
P = percent contribution
S = sum of squares
T = total (or results)
S = pure sum of squares
N = number of experiments
f = degrees of freedom
C.F = correction factor
e = error (experimental)
n = total degrees of freedom
1.4.1 Variance
The variance of each factor is determined by the sum of the square
of each trial sum result involving the factor, divided by the degrees
of freedom of the factor. Thus
VA = SA/fA (for factor A)
VB = SB/fB (for factor B)
VC = SC/fC (for factor C)
Ve = e/fe (for error terms)
1.4.2 Variance Ratio.
The variance ratio is the variance of the factor divided by the error
variance
FA = VA/Ve
FB = VB/Ve
FC = VC/Ve
Fe = Ve/Ve
1.4.3 Pure Sum of Squares.
The pure sum of squares is the sum minus the degrees of freedom
times the error variance
S”A = SA - fA × Ve
S”B = SB - fB × Ve
S”C = SC - fC × Ve
S”e = Se - (fA +fB + fC) Ve
1.4.4 Percent Contribution.
The percent contribution of each factor is the ratio of the factor
sum to the total, expressed in percent
PA = SA × 100/STPB
= SB × 100/ST
PC = SC × 100/ST
Pe = Se × 100/ST
1.5 Selection of Orthogonal Array for the Present
Work.
In the experiments with gas tungsten arc welding, the number of
factors chosen for study is 5, each at 3 levels. Each factor has
degrees of freedom (DOF) of 2 (DOF = number of levels-1).
Therefore the experiment under consideration has 10 DOF and 1
DOF for overall mean. No interaction is considered between the
factors. Hence the total DOF is 11. It is required to conduct at least
11 experiments to estimate the desired effect of factors. The
corresponding OA must have at least 11 rows and five 3-level
columns. It can be seen from Table 3.2 that the L18 standard array
meets requirements. The L18 standard orthogonal array is given in
Table 3.1. It has eight columns and eighteen rows. The degree of
freedom of L18 array is 18. In present work five 3-level factors are
chosen. The structure of orthogonal array requires that all the 18
experiments indicated by the L18 array must be run. If one runs
fewer than 18 experiments, it would not be possible to complete
the analysis necessary to evaluate the desired effects.
IJRET: International Journal of Research in Engineering and Technology eISSN: 2319-1163 | pISSN: 2321-7308
__________________________________________________________________________________________
Volume: 02 Issue: 10 | Oct-2013, Available @ http://www.ijret.org 188
Table -3: L18 (21 × 37) Orthogonal Array & its Linear Graph.
Expt.
No
Column
1 2 3 4 5 6 7 8
1
2
3
4
5
6
1
1
1
1
1
1
1
1
1
2
2
2
1
2
3
1
2
3
1
2
3
1
2
3
1
2
3
2
3
1
1
2
3
2
3
1
1
2
3
3
1
2
1
2
3
3
1
2
7
8
9
10
11
12
1
1
1
2
2
2
3
3
3
1
1
1
1
2
3
1
2
3
2
3
1
3
1
2
1
2
3
3
1
2
3
1
2
2
3
1
2
3
1
2
3
1
3
1
2
1
2
3
13
14
15
16
17
18
2
2
2
2
2
2
2
2
2
3
3
3
1
2
3
1
2
3
2
3
1
3
1
2
3
1
2
2
3
1
1
2
3
3
1
2
3
1
2
1
2
3
2
3
1
2
3
1
2. DESIGN OF EXPERIMENTS.
The process parameters selected for the present study are Welding
current, wire diameter, wire feed rate, ratio of wire feed rate to
travel speed, and plate thickness. The ratio of wire feed rate to
travel speed (WFR/TS) is chosen as a factor instead of travel speed
to avoid the erratic combinations such as high travel speed for low
feed rate etc. Three levels are chosen for all the process parameters
(also called factors). These selected factors and their levels are
given in Table 4.
Table -4: Factors and their levels used in GTAW experiments
Parameters Notation
Factor Levels
1 2 3
Current(A) I 140 160 180
Wire
diameter(mm)
D 1.2 1.4 1.6
Wire feed
rate(mm/min)
WFR 1500 2000 2500
Ratio of wire
feed rate to
travel speed
(mm)
WFR/TS 6 8 10
Pipe thickness PT 8 12 16
Heat input J = (1)
Volume V1 = (2)
Wire deposition volume V2 = (3)
Efficiency η = (4)
% of dilution = (5)
The experimenters log after translating factors and their level
values using L18 array is given in Table 5
Table -5: Experimenters log sheet for GTAW
Experi
m-
ental
Numb
er
Curre
nt (A)
Wire
Diamet
er
(mm)
Wire
Feed
Rate
(mm/
min)
Ratio
of wire
feed
rate to
travel
speed
Plate
Thickne
ss (mm)
E01 140 1.2 1000 6 8
E02 140 1.4 2000 8 12
E03 140 1.6 3000 10 16
E04 160 1.2 1000 8 12
E05 160 1.4 2000 10 16
E06 160 1.6 3000 6 8
E07 180 1.2 2000 6 16
E08 180 1.4 3000 8 8
E09 180 1.6 1000 10 12
E10 140 1.2 3000 10 12
E11 140 1.4 1000 6 16
E12 140 1.6 2000 8 8
E13 160 1.2 2000 10 8
E14 160 1.4 3000 6 12
E15 160 1.6 1000 8 16
E16 180 1.2 3000 8 16
E17 180 1.4 1000 10 8
E18 180 1.6 2000 6 12
The absolute value of TS at different WFR/TS ratios is given
below.
Table -6: Absolute value of TS at different WFR/TS ratio
Ratio 6 8 10
WFR/TS Travel Speed (mm/min)
1000 166.67 125 100
2000 333.33 250 200
3000 500 375 300
IJRET: International Journal of Research in Engineering and Technology eISSN: 2319-1163 | pISSN: 2321-7308
__________________________________________________________________________________________
Volume: 02 Issue: 10 | Oct-2013, Available @ http://www.ijret.org 189
3. RESULTS
From the microscopic examination we find penetration,
reinforcement & width and further calculations like percentage of
dilution, heat input (J), weld bead volume (V1), wire deposition
volume (V2) and wire deposition efficiency were done by using
the formulas.
Table -7: Experimental results for bead geometry & % Dilution
using L18 orthogonal array
Experimental
Number
Penetration
(P) mm
Reinforcement
(R) mm
Width
(W)
mm
% of
Dilution
E01 0.75 1.95 5.25 27.78
E02 0.91 2.26 7.45 28.13
E03 1.96 4.95 4.83 28.57
E04 0.82 1.96 3.22 28.57
E05 1.31 3.21 3.78 28.89
E06 2.25 5.14 10.45 30.67
E07 1.76 2.75 6.34 39.13
E08 1.91 3.12 7.22 38.78
E09 1.18 2.1 3.28 37.50
E10 0.75 1.95 7.13 27.78
E11 0.91 2.28 6.34 28.13
E12 0.98 2.58 8.28 27.93
E13 0.76 2.34 4.12 25.81
E14 2.41 4.05 9.24 37.50
E15 2.18 2.98 3.04 39.22
E16 1.78 2.53 5.98 40.00
E17 1.14 1.65 3.02 34.48
E18 2.1 2.93 9.6 39.62
Table -8: Calculations for J, V1, V2 & η using L18 orthogonal
array
Experimental
Number
Heat
input
(J)
kJ/mm
Weld
Bead
Volume
(V1)
mm3
Wire
deposition
(V2)
mm3
Wire
deposition
efficiency
E01 0.84 1114 1131 98.44%
E02 0.50 3000 3080 97.40%
E03 0.36 5880 6034 97.44%
E04 0.58 1120 1131 98.99%
E05 0.41 2993 3080 97.16%
E06 0.96 5906 6034 97.88%
E07 1.08 2208 2263 97.58%
E08 0.65 4533 4620 98.11%
E09 0.46 2005 2011 99.67%
E10 0.36 3308 3394 97.44%
E11 0.84 1512 1540 98.18%
E12 0.50 3938 4023 97.89%
E13 0.41 2224 2263 98.29%
E14 0.96 4512 4620 97.66%
E15 0.58 1976 2011 98.25%
E16 0.65 3375 3394 99.43%
E17 0.46 1523 1540 98.86%
E18 1.08 3975 4023 98.81%
Fig -3: Weld bead on 12mm thickness plates.
4. ANALYSIS OF VARIANCE (ANOVA)
4.1 Analysis of Results for Depth of Penetration
From the experimental results of the 18 experiments in Table 4, it
is observed that the penetration ranges from 0.75 mm to 2.41 mm.
A summary of factor effects is tabulated in Table 7. The
penetration value 1.043 is the average of penetrations obtained in
the selectively chosen experiments out of the 18 experiments for
plate thickness values of 6 mm which is level 1 for factor A. The
other mean penetrations are also obtained in the same way. Delta
is the variation of the mean values of penetration within that factor.
The effect of factors is ranked as per the magnitude of delta values.
The highest ranked factor „C‟ has the maximum effect followed by
D, A, B and E in order. The factor effects are displayed
graphically in Chart - 1, which makes it easy to visualize the
relative effects of the various factors on depth of penetration.
Table -9: Mean analysis for depth of penetration.
Level A B C D E
1 1.043 1.103 1.163 1.697 1.298
2 1.622 1.432 1.303 1.430 1.362
3 1.645 1.775 1.843 1.183 1.650
Delta 0.602 0.672 0.680 0.513 0.352
Rank 3 2 1 4 5
IJRET: International Journal of Research in Engineering and Technology eISSN: 2319-1163 | pISSN: 2321-7308
__________________________________________________________________________________________
Volume: 02 Issue: 10 | Oct-2013, Available @ http://www.ijret.org 190
180160140
1.8
1.6
1.4
1.2
1.0
1.61.41.2 300020001000
1086
1.8
1.6
1.4
1.2
1.0
16128
A
MeanofMeans
B C
D E
Main Effects Plot for Means
Data Means
Chart -1: Effect of factor levels on depth of penetration in
GTAW.
The following observations are made from the Chart -1 and Table
9
i. Wire feed rate (factor C) has the largest effect on depth
of penetration. By increasing the feed rate from 1000
mm/min to 3000 mm/min, the depth of penetration can
be increased by 0.68 mm.
ii. The wire diameter (factor B) has the next largest effect
on depth of penetration. The mean penetration is low at
diameter level 1 and high at diameter level 3. The range
of change in penetration depth is about 0.672 mm.
iii. Current (factor A) has the next effect on the depth of
penetration among the factors considered in the present
study. The depth of penetration is increasing from level 1
to level 3 is 0.602 mm.
iv. The wire feed rate to travel speed ratio (factor D) has the
next largest effect on depth of penetration. Increasing the
WFR/TS ratio from 6 to 10 i.e., reducing the travel
speed, can improve depth penetration by 0.513 mm.
v. Plate thickness (factor E) little effect on the depth of
penetration. The mean depth of penetration is low on 8
mm plate. Depth of penetration is more on 6 mm thick
plate. The change in penetration depth is about 0.6 mm.
In the present analysis, since the depth of penetration is the
response variable, the higher value of quality characteristic is
better. Therefore, from the Fig 4, the optimum conditions chosen
are A3 B3 C3 D1 E3
4.2 Analysis of Results for Reinforcement Height.
It is observed from the results tabulated in Table 7, it is observed
that the reinforcement ranges from 1.65 mm to 4.95 mm. A
summary of factor effects is tabulated in Table 10 and the factor
effects are displayed graphically in Chart-2, which makes it easy
to visualize the relative effects of the various factors on Convexity
Index.
Table -10: Mean analysis for reinforcement height.
Level A B C D E
1 2.662 2.247 2.153 3.183 2.797
2 3.280 2.762 2.678 2.572 2.542
3 2.513 3.447 3.623 2.700 3.117
Delta 0.767 1.200 1.470 0.612 0.575
Rank 3 2 1 4 5
180160140
3.6
3.2
2.8
2.4
2.0
1.61.41.2 300020001000
1086
3.6
3.2
2.8
2.4
2.0
16128
A
MeanofMeans
B C
D E
Main Effects Plot for Means
Data Means
Chart -2: Effect of factor levels on reinforcement height in
GTAW.
The following observations are made from the Chart -2 and Table
10
i. Wire feed rate (factor C) has the largest effect on
reinforcement. By increasing the feed rate from 1000
mm/min to 3000 mm/min, the reinforcement can be
increased by 1.47 mm.
ii. The wire diameter (factor B) has the next largest effect
on depth of reinforcement. By the increasing the wire
diameter from 1.2 mm to 1.6 mm, the reinforcement can
be increased by 1.2 mm.
iii. Current (factor A) has the next effect on the
reinforcement among the factors considered in the
present study. The mean reinforcement is low at current
level 3 and high at current level 1. The range of change
in penetration depth is about 0.767 mm.
iv. The wire feed rate to travel speed ratio (factor D) has the
next largest effect on reinforcement. Increasing the
WFR/TS ratio from 6 to 10 i.e., reducing the travel
speed, can decrease reinforcement by 0.612 mm.
v. Plate thickness (factor E) little effect on the depth of
penetration. The mean reinforcement is low on 8 mm
plate. Reinforcement is more on 12 mm thick plate. The
change in reinforcement is about 0.5 mm.
In the present analysis, since the depth of penetration is the
response variable, the higher value of quality characteristic is
better. Therefore, from the Fig 5, the optimum conditions chosen
are A2 B3 C3 D1 E3.
IJRET: International Journal of Research in Engineering and Technology eISSN: 2319-1163 | pISSN: 2321-7308
__________________________________________________________________________________________
Volume: 02 Issue: 10 | Oct-2013, Available @ http://www.ijret.org 191
4.3 Analysis of Results for Bead Width.
From the experimental results of the 18 experiments in Table 7, it
is observed that the bead width ranges from 3.02 mm to 10.4 mm.
A summary of factor effects is tabulated in Table 11. The bead
width value 6.574 is the average of bead width obtained in the
selectively chosen experiments out of the 18 experiments for
current value of 140A which is level 1 for factor A. The other
mean bead widths are also obtained in the same way. Delta is the
variation of the mean values of bead width within that factor. The
effect of factors is ranked as per the magnitude of delta values. The
highest ranked factor „D‟ has the maximum effect followed by C,
E, B and A in order. The factor effects are displayed graphically in
Chart -3, which makes it easy to visualize the relative effects of the
various factors on bead width.
Table -11: Mean analysis for bead width
Level A B C D E
1 6.547 5.340 4.025 7.870 6.390
2 5.642 6.175 6.595 5.865 6.653
3 0.905 1.240 3.450 3.510 1.602
Rank 5 4 2 1 3
180160140
8
7
6
5
4
1.61.41.2 300020001000
1086
8
7
6
5
4
16128
A
MeanofMeans
B C
D E
Main Effects Plot for Means
Data Means
Chart -3: Effect of factor levels on bead width in GTAW.
The following observations are made from the Chart -3 and Table
11
i. The wire feed rate to travel speed ratio (factor D) has the
largest effect on bead width. Increasing the WFR/TS
ratio from 6 to 10 i.e., reducing the travel speed, can
decrease the bead width by 3.51 mm.
ii. Wire feed rate (factor C) has the next largest effect on
bead width. By increasing the feed rate from 1000
mm/min to 3000 mm/min, the bead width can be
increased by 3.45 mm.
iii. The wire diameter (factor B) has the next largest effect
on bead width. The bead width is increasing from level 1
to level 3 is 0.602 mm.
iv. Current (factor A) has the next effect on the bead width
among the factors considered in the present study. The
mean width is high at diameter level 1 and low at
diameter level 2. The range of change in bead width is
about 1.24 mm.
v. Plate thickness (factor E) little effect on the bead width.
The mean width is high on 12 mm plate. Bead width is
more on 16 mm thick plate. The change in width is about
1.6 mm.
In the present analysis, since the bead width is the response
variable, the higher value of quality characteristic is better.
Therefore, from the Fig 6, the optimum conditions chosen are A1
B3 C3 D1 E2.
4.4 Development of Mathematical Models.
The experimental results that are given in previous section are
used to obtain the mathematical relationship between process
parameters and bead geometry. The coefficients of mathematical
models are computed by using method of multiple regressions. A
commercial software Datafit has been used for the regression
analysis. This software is used to test several models viz., linear,
exponential, power series (user defined). Out of all models tested
the model that has high coefficient of multiple determination (R2)
value and better t-ratio is chosen. The adequacy of the models and
the significance of coefficients are tested by applying analysis of
variance and student (T) test.
The relationship between penetration (or reinforcement or width )
as response variable(s) and to give process parameters viz.,
current, wire diameter, wire feed rate, WFR/TS ratio & plate
thickness as independent parameters can be expressed as
Y = 10a
X1
b
X2
c
X3
d
X4
e
X5
f
Where Y is the penetration in mm, or convexity index
X1 - current, A (factor A)
X2 – wire diameter, mm (factor B)
X3 - wire feed rate, m/min (factor C)
X4 – wire feed rate/travel speed ratio (factor D)
X5 – plate thickness, mm (factor E)
a, b, c, d, e and f - regression variables
The multiple regression analysis resulted the following equations
Penetration
P =
-- (5.1)
Reinforcement
R =
-- (5.2)
IJRET: International Journal of Research in Engineering and Technology eISSN: 2319-1163 | pISSN: 2321-7308
__________________________________________________________________________________________
Volume: 02 Issue: 10 | Oct-2013, Available @ http://www.ijret.org 192
Width
W =
-- (5.3)
Regression analysis results are presented in Table 11 for depth of
penetration. The adequacy of the each model is tested by the
analysis of variance (ANOVA). Table 12 shows the ANOVA for
penetration.
Model Definition: Penetration
Y = 10^a*x1^b*x2^c*x3^d*x4^e*x5^f
Number of observations = 18
Number of missing observations = 0
Solver type: Nonlinear
Nonlinear iteration limit = 250
Diverging nonlinear iteration limit =10
Number of nonlinear iterations performed = 27
Residual tolerance = 0.0000000001
Sum of Residuals = -4.37332326231613E-02
Average Residual = -2.42962403462007E-03
Residual Sum of Squares (Absolute) = 1.22954527201257
Residual Sum of Squares (Relative) = 1.22954527201257
Standard Error of the Estimate = 0.320097025917216
Coefficient of Multiple Determination (R^2) = 0.7963047493
Proportion of Variance Explained = 79.63047493%
Adjusted coefficient of multiple determination (Ra^2) =
0.7114317282
Durbin-Watson statistic = 1.59153398914335
99% Confidence Intervals
Variable Value
a -4.94017608223145
b 1.48698475532579
c 1.75338382648395
d 0.468398480585137
e -0.533858513200747
f 0.465522943706036
Y = --- (5.1)
Table -12: Analysis of Variance for depth of penetration model
Source
Regressio
n
Error
Total
DF
5
12
17
Sum of
Square
s
4.8066
1.2295
6.0362
Mean
Square
0.96133
0.10246
F
Rati
o
9.38
23
Prob(F)
0.00079
Chart -4 shows the relationship between experimental value and
predicted value of depth of penetration in Gas Tungsten Arc
Welding. It is observed from the Chart -4 that the values predicted
by penetration model (Eqn. 5.1) are in good agreement with
experimental values. The experimental and predicted values of
penetration and percentage error are given in Table 13. It can be
observed from the table that the percentage error is less than 29%
in all the cases except one. Hence it is concluded that the model
can predict the depth of penetration in GTAW with good accuracy.
Chart-4: Results based on experimental and predicted values of
penetration.
Table -13: Comparison between predicted value and experimental
value of penetration in GTAW
Exp.
No.
Penetratio
n (P) mm
Calculate
d (P)
Residual
%
Error
E01 0.75 0.63 -0.12 -15.85
E02 0.91 1.19 0.28 30.23
E03 1.96 1.84 -0.12 -6.22
E04 0.82 0.80 -0.02 -2.77
E05 1.31 1.47 0.16 11.98
E06 2.25 2.13 -0.12 -5.22
E07 1.76 1.75 -0.01 -0.45
E08 1.91 1.72 -0.19 -9.73
E09 1.18 1.40 0.22 18.34
E10 0.75 0.97 0.22 29.44
E11 0.91 1.14 0.23 25.48
E12 0.98 1.24 0.26 26.54
E13 0.76 0.81 0.05 6.68
E14 2.41 2.04 -0.37 -15.44
E15 2.18 1.51 -0.67 -30.76
E16 1.78 1.82 0.04 2.07
E17 1.14 0.91 -0.23 -19.75
E18 2.1 2.54 0.44 20.84
IJRET: International Journal of Research in Engineering and Technology eISSN: 2319-1163 | pISSN: 2321-7308
__________________________________________________________________________________________
Volume: 02 Issue: 10 | Oct-2013, Available @ http://www.ijret.org 193
So the values of current and wire diameter are taken as 180 A and
1.6 mm respectively for plotting predicted the depth of penetration
at different wire feed rates, WFR/TS ratio and on different plate
thickness. It is observed from the plots that the depth of
penetration increases with increase in wire feed rate or increase in
welding speed (i.e., increase in WFR/TS ratio) for a given plate
thickness. This is because at high wire feed rate the heat input is
more and hence more depth of penetration. are useful to predict
the depth of penetration at different wire feed rates and at different
WFR/TS ratio.
CONCLUSIONS
1. From the present work the mathematical models were
developed for penetration, reinforcement and width.
2. Compression had made between the experimental values and
predicted values (by using generated formulas) are showing
reasonable agreement.
REFERENCES
[1] I.S. Kim, J.S. Son, H.J. Kim and B.A. Chin, “A study
on variation of shielding gas in GTA welding using
finite element method”, AMME Volume 17, issue 1-2,
pp. 249-252, July – august 2006.
[2] Y. S. Tarng and W. H. Yang Yang “Optimization of the
Weld Bead Geometry in Gas Tungsten Arc Welding by
the Taguchi Method”. The International| Journal of
advanced Manufacturing Technology, pp. 549 – 554,
1998.
[3] Dr Sun Zheng, Dr Kuo Min and Pan Dayou, “Twin
Wire Gas Tungsten Arc Cladding”, Joining Technology
Group, Process Technology Division, 1999.
[4] Bernard Mannion and Jack Heinzman “
Determining
parameters for GTAW”, July/August 1999 issue of
Practical Welding Today.
[5] S. X. Lv*, Z. W. Xu, H. T. Wang and S. Q. Yang
“Investigation on TIG cladding of copper alloy on steel
plate”, Science and Technology of Welding and
Joining, Volume 13, pp. 10-16, 2008.
[6] T.Jayananda Kumar, “Effect of input current on
dilution in claddings produced by gtaw process”,
[7] AWS Welding Handbook, 8th
Edition.
[8] The Welding Institute Journal, 175/1982, Study of
Welding Process Prameters.
[9] The Welding Institute Journal, 283/1985, Dilution.
[10] “Modern Arc Welding Technology” By S.V. Nadkarni.
[11] “Metals Handbook, 8th
Edition, Vol-1” Properties and
selection of metals of American society for metals.
[12] “Materials Handbook” By AWS.
[13] “The Procedure Handbook of Arc Welding” 12th
Edition, By Lincoln.
[14] “Mechanical Metallurgy” By Linnert.
BIOGRAPHIES
Mr. K. Ashok Kumar working as an Assistant
Professor in the Department of Mechanical
Engineering at Shri Vishnu Engineering College
for Women, Bhimavaram. Mr. K.Ashok Kumar
obtained his B.E first class at TJIT, Channai,
M.Tech first class with distinction from GIET, Rajahmundry
and have 1year industrial and 2years teaching experience.
Mr. G. Satish working as an Assistant Professor
in the Department of Mechanical Engineering at
Shri Vishnu Engineering College for Women,
Bhimavaram and obtained his B.Tech and
M.Tech(Machine Design) degrees both with
first class at JNTUK. He has experience of 2years as CAD
engineer and 2years teaching and published 1 international
journal.
Mr. V. Lakshmi Narayana working as an
Assistant Professor in the Department of
Mechanical Engineering at Shri Vishnu
Engineering College for Women, Bhimavaram.
He has completed his B.Tech in the discipline of
Mechanical and M.Tech in CAD/CAM. He did both degrees
in first class with distinction. He has work experience of 1
year as CAD Engineer and 4 years as an Assistant Professor.
Mr. N. Srinivasa Rao working as an Assistant
Professor in the Department of Mechanical
Engineering at Shri Vishnu Engineering College
for Women, Bhimavaram. He has completed his
B.Tech in the discipline of Mechanical and
M.Tech in Automobile Engineering in NIT Warangal. He did
both degrees in first class. He has 3 years as an Assistant
Professor in teaching.

More Related Content

What's hot

Finite element analysis on temperature distribution in turning process using ...
Finite element analysis on temperature distribution in turning process using ...Finite element analysis on temperature distribution in turning process using ...
Finite element analysis on temperature distribution in turning process using ...eSAT Publishing House
 
ISEN 613_Team3_Final Project Report
ISEN 613_Team3_Final Project ReportISEN 613_Team3_Final Project Report
ISEN 613_Team3_Final Project ReportNaman Kapoor
 
Process Parameter Optimization of Bead geometry for AISI 446 in GMAW Process ...
Process Parameter Optimization of Bead geometry for AISI 446 in GMAW Process ...Process Parameter Optimization of Bead geometry for AISI 446 in GMAW Process ...
Process Parameter Optimization of Bead geometry for AISI 446 in GMAW Process ...iosrjce
 
Building a model for expected cost function to obtain double
Building a model for expected cost function to obtain doubleBuilding a model for expected cost function to obtain double
Building a model for expected cost function to obtain doubleIAEME Publication
 
Optimization of process parameter for maximizing Material removal rate in tur...
Optimization of process parameter for maximizing Material removal rate in tur...Optimization of process parameter for maximizing Material removal rate in tur...
Optimization of process parameter for maximizing Material removal rate in tur...IRJET Journal
 
Applying quality management in healthcare
Applying quality management in healthcareApplying quality management in healthcare
Applying quality management in healthcareselinasimpson1601
 
Iso 9001 13485
Iso 9001 13485Iso 9001 13485
Iso 9001 13485jomjenguta
 

What's hot (16)

Team 16_Report
Team 16_ReportTeam 16_Report
Team 16_Report
 
Finite element analysis on temperature distribution in turning process using ...
Finite element analysis on temperature distribution in turning process using ...Finite element analysis on temperature distribution in turning process using ...
Finite element analysis on temperature distribution in turning process using ...
 
Juran quality management
Juran quality managementJuran quality management
Juran quality management
 
ISEN 613_Team3_Final Project Report
ISEN 613_Team3_Final Project ReportISEN 613_Team3_Final Project Report
ISEN 613_Team3_Final Project Report
 
om
omom
om
 
9. design of experiment
9. design of experiment9. design of experiment
9. design of experiment
 
30120140506006
3012014050600630120140506006
30120140506006
 
Process Parameter Optimization of Bead geometry for AISI 446 in GMAW Process ...
Process Parameter Optimization of Bead geometry for AISI 446 in GMAW Process ...Process Parameter Optimization of Bead geometry for AISI 446 in GMAW Process ...
Process Parameter Optimization of Bead geometry for AISI 446 in GMAW Process ...
 
Building a model for expected cost function to obtain double
Building a model for expected cost function to obtain doubleBuilding a model for expected cost function to obtain double
Building a model for expected cost function to obtain double
 
1
11
1
 
Optimization of process parameter for maximizing Material removal rate in tur...
Optimization of process parameter for maximizing Material removal rate in tur...Optimization of process parameter for maximizing Material removal rate in tur...
Optimization of process parameter for maximizing Material removal rate in tur...
 
Modelling and Analysis Laboratory Manual
Modelling and Analysis Laboratory ManualModelling and Analysis Laboratory Manual
Modelling and Analysis Laboratory Manual
 
G04402043051
G04402043051G04402043051
G04402043051
 
Applying quality management in healthcare
Applying quality management in healthcareApplying quality management in healthcare
Applying quality management in healthcare
 
Iso 9001 13485
Iso 9001 13485Iso 9001 13485
Iso 9001 13485
 
Measurement Uncertainty
Measurement UncertaintyMeasurement Uncertainty
Measurement Uncertainty
 

Viewers also liked

Properties and applications of P/M of Copper alloys
Properties and applications of P/M of Copper alloysProperties and applications of P/M of Copper alloys
Properties and applications of P/M of Copper alloys reza rashidi
 
A Review: Parametric effect on mechanical properties and weld bead geometry o...
A Review: Parametric effect on mechanical properties and weld bead geometry o...A Review: Parametric effect on mechanical properties and weld bead geometry o...
A Review: Parametric effect on mechanical properties and weld bead geometry o...IOSR Journals
 
A Study of microstructure and mechanical properties of 5083 Al-alloy welded w...
A Study of microstructure and mechanical properties of 5083 Al-alloy welded w...A Study of microstructure and mechanical properties of 5083 Al-alloy welded w...
A Study of microstructure and mechanical properties of 5083 Al-alloy welded w...IJRES Journal
 
Fabrication and Study of the Mechanical Properties of AA2024 Alloy Reinforced...
Fabrication and Study of the Mechanical Properties of AA2024 Alloy Reinforced...Fabrication and Study of the Mechanical Properties of AA2024 Alloy Reinforced...
Fabrication and Study of the Mechanical Properties of AA2024 Alloy Reinforced...IOSR Journals
 
Evaluation of Mechanical Properties of Al 7075 Alloy, Flyash, SiC and Redmud ...
Evaluation of Mechanical Properties of Al 7075 Alloy, Flyash, SiC and Redmud ...Evaluation of Mechanical Properties of Al 7075 Alloy, Flyash, SiC and Redmud ...
Evaluation of Mechanical Properties of Al 7075 Alloy, Flyash, SiC and Redmud ...ijsrd.com
 
Fly ash, Sic, Red mud, Al7075 alloy composite, mechanical properties, and sti...
Fly ash, Sic, Red mud, Al7075 alloy composite, mechanical properties, and sti...Fly ash, Sic, Red mud, Al7075 alloy composite, mechanical properties, and sti...
Fly ash, Sic, Red mud, Al7075 alloy composite, mechanical properties, and sti...ijsrd.com
 
A step by step procedure in project management
A step by step procedure in project managementA step by step procedure in project management
A step by step procedure in project managementTobby Hedges
 
EFFECT OF THERMAL EXPOSURE ON THE MECHANICAL AND WEAR PROPERTIES OF AEROSPACE...
EFFECT OF THERMAL EXPOSURE ON THE MECHANICAL AND WEAR PROPERTIES OF AEROSPACE...EFFECT OF THERMAL EXPOSURE ON THE MECHANICAL AND WEAR PROPERTIES OF AEROSPACE...
EFFECT OF THERMAL EXPOSURE ON THE MECHANICAL AND WEAR PROPERTIES OF AEROSPACE...Journal For Research
 
A Study on Mechanical Properties of Aluminium Alloy (LM6) Reinforced with SiC...
A Study on Mechanical Properties of Aluminium Alloy (LM6) Reinforced with SiC...A Study on Mechanical Properties of Aluminium Alloy (LM6) Reinforced with SiC...
A Study on Mechanical Properties of Aluminium Alloy (LM6) Reinforced with SiC...IOSR Journals
 
General Guidelines - First Review for B.Tech Mechanical VIII Sem
General Guidelines - First Review for B.Tech Mechanical VIII SemGeneral Guidelines - First Review for B.Tech Mechanical VIII Sem
General Guidelines - First Review for B.Tech Mechanical VIII SemVIT University
 
Wagon project report mechanical vocational training presentation haxxo24 i~i
Wagon project report mechanical vocational training presentation haxxo24 i~iWagon project report mechanical vocational training presentation haxxo24 i~i
Wagon project report mechanical vocational training presentation haxxo24 i~ihaxxo24
 
Mechanical Engineering project
Mechanical Engineering projectMechanical Engineering project
Mechanical Engineering projectManpreet Singh
 
Gas tungsten arc welding
Gas tungsten arc weldingGas tungsten arc welding
Gas tungsten arc weldingIsaac Ayuba M.
 
Tungsten Inert Gas Welding
Tungsten Inert Gas WeldingTungsten Inert Gas Welding
Tungsten Inert Gas WeldingAVINASH JURIANI
 

Viewers also liked (15)

Properties and applications of P/M of Copper alloys
Properties and applications of P/M of Copper alloysProperties and applications of P/M of Copper alloys
Properties and applications of P/M of Copper alloys
 
A Review: Parametric effect on mechanical properties and weld bead geometry o...
A Review: Parametric effect on mechanical properties and weld bead geometry o...A Review: Parametric effect on mechanical properties and weld bead geometry o...
A Review: Parametric effect on mechanical properties and weld bead geometry o...
 
A Study of microstructure and mechanical properties of 5083 Al-alloy welded w...
A Study of microstructure and mechanical properties of 5083 Al-alloy welded w...A Study of microstructure and mechanical properties of 5083 Al-alloy welded w...
A Study of microstructure and mechanical properties of 5083 Al-alloy welded w...
 
Fabrication and Study of the Mechanical Properties of AA2024 Alloy Reinforced...
Fabrication and Study of the Mechanical Properties of AA2024 Alloy Reinforced...Fabrication and Study of the Mechanical Properties of AA2024 Alloy Reinforced...
Fabrication and Study of the Mechanical Properties of AA2024 Alloy Reinforced...
 
Evaluation of Mechanical Properties of Al 7075 Alloy, Flyash, SiC and Redmud ...
Evaluation of Mechanical Properties of Al 7075 Alloy, Flyash, SiC and Redmud ...Evaluation of Mechanical Properties of Al 7075 Alloy, Flyash, SiC and Redmud ...
Evaluation of Mechanical Properties of Al 7075 Alloy, Flyash, SiC and Redmud ...
 
Fly ash, Sic, Red mud, Al7075 alloy composite, mechanical properties, and sti...
Fly ash, Sic, Red mud, Al7075 alloy composite, mechanical properties, and sti...Fly ash, Sic, Red mud, Al7075 alloy composite, mechanical properties, and sti...
Fly ash, Sic, Red mud, Al7075 alloy composite, mechanical properties, and sti...
 
A step by step procedure in project management
A step by step procedure in project managementA step by step procedure in project management
A step by step procedure in project management
 
EFFECT OF THERMAL EXPOSURE ON THE MECHANICAL AND WEAR PROPERTIES OF AEROSPACE...
EFFECT OF THERMAL EXPOSURE ON THE MECHANICAL AND WEAR PROPERTIES OF AEROSPACE...EFFECT OF THERMAL EXPOSURE ON THE MECHANICAL AND WEAR PROPERTIES OF AEROSPACE...
EFFECT OF THERMAL EXPOSURE ON THE MECHANICAL AND WEAR PROPERTIES OF AEROSPACE...
 
A Study on Mechanical Properties of Aluminium Alloy (LM6) Reinforced with SiC...
A Study on Mechanical Properties of Aluminium Alloy (LM6) Reinforced with SiC...A Study on Mechanical Properties of Aluminium Alloy (LM6) Reinforced with SiC...
A Study on Mechanical Properties of Aluminium Alloy (LM6) Reinforced with SiC...
 
General Guidelines - First Review for B.Tech Mechanical VIII Sem
General Guidelines - First Review for B.Tech Mechanical VIII SemGeneral Guidelines - First Review for B.Tech Mechanical VIII Sem
General Guidelines - First Review for B.Tech Mechanical VIII Sem
 
Wagon project report mechanical vocational training presentation haxxo24 i~i
Wagon project report mechanical vocational training presentation haxxo24 i~iWagon project report mechanical vocational training presentation haxxo24 i~i
Wagon project report mechanical vocational training presentation haxxo24 i~i
 
Tig welding
Tig weldingTig welding
Tig welding
 
Mechanical Engineering project
Mechanical Engineering projectMechanical Engineering project
Mechanical Engineering project
 
Gas tungsten arc welding
Gas tungsten arc weldingGas tungsten arc welding
Gas tungsten arc welding
 
Tungsten Inert Gas Welding
Tungsten Inert Gas WeldingTungsten Inert Gas Welding
Tungsten Inert Gas Welding
 

Similar to Development of mathematical model on gas tungsten arc welding process parameters

IRJET-Parametric Optimisation of Gas Metal Arc Welding Process with the Help ...
IRJET-Parametric Optimisation of Gas Metal Arc Welding Process with the Help ...IRJET-Parametric Optimisation of Gas Metal Arc Welding Process with the Help ...
IRJET-Parametric Optimisation of Gas Metal Arc Welding Process with the Help ...IRJET Journal
 
Effect and optimization of machining parameters on
Effect and optimization of machining parameters onEffect and optimization of machining parameters on
Effect and optimization of machining parameters oneSAT Publishing House
 
Effect and optimization of machining parameters on cutting force and surface ...
Effect and optimization of machining parameters on cutting force and surface ...Effect and optimization of machining parameters on cutting force and surface ...
Effect and optimization of machining parameters on cutting force and surface ...eSAT Journals
 
IRJET- Experimental Study of Taguchi Vs GRA Parameters During CNC Boring in S...
IRJET- Experimental Study of Taguchi Vs GRA Parameters During CNC Boring in S...IRJET- Experimental Study of Taguchi Vs GRA Parameters During CNC Boring in S...
IRJET- Experimental Study of Taguchi Vs GRA Parameters During CNC Boring in S...IRJET Journal
 
An experimental study on factors affecting Cold Extrusion of steels
An experimental study on factors affecting Cold Extrusion of steelsAn experimental study on factors affecting Cold Extrusion of steels
An experimental study on factors affecting Cold Extrusion of steelsIRJET Journal
 
Design and Implementation of Test Vector Generation using Random Forest Techn...
Design and Implementation of Test Vector Generation using Random Forest Techn...Design and Implementation of Test Vector Generation using Random Forest Techn...
Design and Implementation of Test Vector Generation using Random Forest Techn...IRJET Journal
 
OPTIMIZATION OF PROCESS PARAMETERS IN DIRECT METAL DEPOSITION TECHNIQUE USING...
OPTIMIZATION OF PROCESS PARAMETERS IN DIRECT METAL DEPOSITION TECHNIQUE USING...OPTIMIZATION OF PROCESS PARAMETERS IN DIRECT METAL DEPOSITION TECHNIQUE USING...
OPTIMIZATION OF PROCESS PARAMETERS IN DIRECT METAL DEPOSITION TECHNIQUE USING...IAEME Publication
 
Application of Taguchi Method for Optimization of Process Parameters in Drill...
Application of Taguchi Method for Optimization of Process Parameters in Drill...Application of Taguchi Method for Optimization of Process Parameters in Drill...
Application of Taguchi Method for Optimization of Process Parameters in Drill...ijtsrd
 
Risk assessment for blast furnace using fmea
Risk assessment for blast furnace using fmeaRisk assessment for blast furnace using fmea
Risk assessment for blast furnace using fmeaeSAT Publishing House
 
Analysis of Foundry defects and Quality improvement of Sand casting
Analysis of Foundry defects and Quality improvement of Sand castingAnalysis of Foundry defects and Quality improvement of Sand casting
Analysis of Foundry defects and Quality improvement of Sand castingIRJET Journal
 
IRJET- Optimization of Plastic Injection Molding
IRJET- Optimization of Plastic Injection MoldingIRJET- Optimization of Plastic Injection Molding
IRJET- Optimization of Plastic Injection MoldingIRJET Journal
 
Experimental investigation and stastical analysis of
Experimental investigation and stastical analysis ofExperimental investigation and stastical analysis of
Experimental investigation and stastical analysis ofeSAT Publishing House
 
Experimental investigation and stastical analysis of the friction welding par...
Experimental investigation and stastical analysis of the friction welding par...Experimental investigation and stastical analysis of the friction welding par...
Experimental investigation and stastical analysis of the friction welding par...eSAT Journals
 
Experimental Analysis on TIG welding process parameters of SS304 By Using Tag...
Experimental Analysis on TIG welding process parameters of SS304 By Using Tag...Experimental Analysis on TIG welding process parameters of SS304 By Using Tag...
Experimental Analysis on TIG welding process parameters of SS304 By Using Tag...IRJET Journal
 
Modal Analysis of Automotive Components
Modal Analysis of Automotive ComponentsModal Analysis of Automotive Components
Modal Analysis of Automotive ComponentsIRJET Journal
 
Dynamic Analysis And Optimization Of Fatigue Crack Propagation Using Full Fac...
Dynamic Analysis And Optimization Of Fatigue Crack Propagation Using Full Fac...Dynamic Analysis And Optimization Of Fatigue Crack Propagation Using Full Fac...
Dynamic Analysis And Optimization Of Fatigue Crack Propagation Using Full Fac...IJERA Editor
 
IRJET- Optimization of Cutting Parameters During Turning of AISI 1018 usi...
IRJET-  	  Optimization of Cutting Parameters During Turning of AISI 1018 usi...IRJET-  	  Optimization of Cutting Parameters During Turning of AISI 1018 usi...
IRJET- Optimization of Cutting Parameters During Turning of AISI 1018 usi...IRJET Journal
 
IRJET - Optimization of Machining Parameters in a Turning Operation of Flyash...
IRJET - Optimization of Machining Parameters in a Turning Operation of Flyash...IRJET - Optimization of Machining Parameters in a Turning Operation of Flyash...
IRJET - Optimization of Machining Parameters in a Turning Operation of Flyash...IRJET Journal
 

Similar to Development of mathematical model on gas tungsten arc welding process parameters (20)

IRJET-Parametric Optimisation of Gas Metal Arc Welding Process with the Help ...
IRJET-Parametric Optimisation of Gas Metal Arc Welding Process with the Help ...IRJET-Parametric Optimisation of Gas Metal Arc Welding Process with the Help ...
IRJET-Parametric Optimisation of Gas Metal Arc Welding Process with the Help ...
 
INVESTIGATION OF THE EFFECT OF CURRENT ON TENSILE STRENGTH AND NUGGET DIAMETE...
INVESTIGATION OF THE EFFECT OF CURRENT ON TENSILE STRENGTH AND NUGGET DIAMETE...INVESTIGATION OF THE EFFECT OF CURRENT ON TENSILE STRENGTH AND NUGGET DIAMETE...
INVESTIGATION OF THE EFFECT OF CURRENT ON TENSILE STRENGTH AND NUGGET DIAMETE...
 
Effect and optimization of machining parameters on
Effect and optimization of machining parameters onEffect and optimization of machining parameters on
Effect and optimization of machining parameters on
 
Effect and optimization of machining parameters on cutting force and surface ...
Effect and optimization of machining parameters on cutting force and surface ...Effect and optimization of machining parameters on cutting force and surface ...
Effect and optimization of machining parameters on cutting force and surface ...
 
IRJET- Experimental Study of Taguchi Vs GRA Parameters During CNC Boring in S...
IRJET- Experimental Study of Taguchi Vs GRA Parameters During CNC Boring in S...IRJET- Experimental Study of Taguchi Vs GRA Parameters During CNC Boring in S...
IRJET- Experimental Study of Taguchi Vs GRA Parameters During CNC Boring in S...
 
Em33832837
Em33832837Em33832837
Em33832837
 
An experimental study on factors affecting Cold Extrusion of steels
An experimental study on factors affecting Cold Extrusion of steelsAn experimental study on factors affecting Cold Extrusion of steels
An experimental study on factors affecting Cold Extrusion of steels
 
Design and Implementation of Test Vector Generation using Random Forest Techn...
Design and Implementation of Test Vector Generation using Random Forest Techn...Design and Implementation of Test Vector Generation using Random Forest Techn...
Design and Implementation of Test Vector Generation using Random Forest Techn...
 
OPTIMIZATION OF PROCESS PARAMETERS IN DIRECT METAL DEPOSITION TECHNIQUE USING...
OPTIMIZATION OF PROCESS PARAMETERS IN DIRECT METAL DEPOSITION TECHNIQUE USING...OPTIMIZATION OF PROCESS PARAMETERS IN DIRECT METAL DEPOSITION TECHNIQUE USING...
OPTIMIZATION OF PROCESS PARAMETERS IN DIRECT METAL DEPOSITION TECHNIQUE USING...
 
Application of Taguchi Method for Optimization of Process Parameters in Drill...
Application of Taguchi Method for Optimization of Process Parameters in Drill...Application of Taguchi Method for Optimization of Process Parameters in Drill...
Application of Taguchi Method for Optimization of Process Parameters in Drill...
 
Risk assessment for blast furnace using fmea
Risk assessment for blast furnace using fmeaRisk assessment for blast furnace using fmea
Risk assessment for blast furnace using fmea
 
Analysis of Foundry defects and Quality improvement of Sand casting
Analysis of Foundry defects and Quality improvement of Sand castingAnalysis of Foundry defects and Quality improvement of Sand casting
Analysis of Foundry defects and Quality improvement of Sand casting
 
IRJET- Optimization of Plastic Injection Molding
IRJET- Optimization of Plastic Injection MoldingIRJET- Optimization of Plastic Injection Molding
IRJET- Optimization of Plastic Injection Molding
 
Experimental investigation and stastical analysis of
Experimental investigation and stastical analysis ofExperimental investigation and stastical analysis of
Experimental investigation and stastical analysis of
 
Experimental investigation and stastical analysis of the friction welding par...
Experimental investigation and stastical analysis of the friction welding par...Experimental investigation and stastical analysis of the friction welding par...
Experimental investigation and stastical analysis of the friction welding par...
 
Experimental Analysis on TIG welding process parameters of SS304 By Using Tag...
Experimental Analysis on TIG welding process parameters of SS304 By Using Tag...Experimental Analysis on TIG welding process parameters of SS304 By Using Tag...
Experimental Analysis on TIG welding process parameters of SS304 By Using Tag...
 
Modal Analysis of Automotive Components
Modal Analysis of Automotive ComponentsModal Analysis of Automotive Components
Modal Analysis of Automotive Components
 
Dynamic Analysis And Optimization Of Fatigue Crack Propagation Using Full Fac...
Dynamic Analysis And Optimization Of Fatigue Crack Propagation Using Full Fac...Dynamic Analysis And Optimization Of Fatigue Crack Propagation Using Full Fac...
Dynamic Analysis And Optimization Of Fatigue Crack Propagation Using Full Fac...
 
IRJET- Optimization of Cutting Parameters During Turning of AISI 1018 usi...
IRJET-  	  Optimization of Cutting Parameters During Turning of AISI 1018 usi...IRJET-  	  Optimization of Cutting Parameters During Turning of AISI 1018 usi...
IRJET- Optimization of Cutting Parameters During Turning of AISI 1018 usi...
 
IRJET - Optimization of Machining Parameters in a Turning Operation of Flyash...
IRJET - Optimization of Machining Parameters in a Turning Operation of Flyash...IRJET - Optimization of Machining Parameters in a Turning Operation of Flyash...
IRJET - Optimization of Machining Parameters in a Turning Operation of Flyash...
 

More from eSAT Journals

Mechanical properties of hybrid fiber reinforced concrete for pavements
Mechanical properties of hybrid fiber reinforced concrete for pavementsMechanical properties of hybrid fiber reinforced concrete for pavements
Mechanical properties of hybrid fiber reinforced concrete for pavementseSAT Journals
 
Material management in construction – a case study
Material management in construction – a case studyMaterial management in construction – a case study
Material management in construction – a case studyeSAT Journals
 
Managing drought short term strategies in semi arid regions a case study
Managing drought    short term strategies in semi arid regions  a case studyManaging drought    short term strategies in semi arid regions  a case study
Managing drought short term strategies in semi arid regions a case studyeSAT Journals
 
Life cycle cost analysis of overlay for an urban road in bangalore
Life cycle cost analysis of overlay for an urban road in bangaloreLife cycle cost analysis of overlay for an urban road in bangalore
Life cycle cost analysis of overlay for an urban road in bangaloreeSAT Journals
 
Laboratory studies of dense bituminous mixes ii with reclaimed asphalt materials
Laboratory studies of dense bituminous mixes ii with reclaimed asphalt materialsLaboratory studies of dense bituminous mixes ii with reclaimed asphalt materials
Laboratory studies of dense bituminous mixes ii with reclaimed asphalt materialseSAT Journals
 
Laboratory investigation of expansive soil stabilized with natural inorganic ...
Laboratory investigation of expansive soil stabilized with natural inorganic ...Laboratory investigation of expansive soil stabilized with natural inorganic ...
Laboratory investigation of expansive soil stabilized with natural inorganic ...eSAT Journals
 
Influence of reinforcement on the behavior of hollow concrete block masonry p...
Influence of reinforcement on the behavior of hollow concrete block masonry p...Influence of reinforcement on the behavior of hollow concrete block masonry p...
Influence of reinforcement on the behavior of hollow concrete block masonry p...eSAT Journals
 
Influence of compaction energy on soil stabilized with chemical stabilizer
Influence of compaction energy on soil stabilized with chemical stabilizerInfluence of compaction energy on soil stabilized with chemical stabilizer
Influence of compaction energy on soil stabilized with chemical stabilizereSAT Journals
 
Geographical information system (gis) for water resources management
Geographical information system (gis) for water resources managementGeographical information system (gis) for water resources management
Geographical information system (gis) for water resources managementeSAT Journals
 
Forest type mapping of bidar forest division, karnataka using geoinformatics ...
Forest type mapping of bidar forest division, karnataka using geoinformatics ...Forest type mapping of bidar forest division, karnataka using geoinformatics ...
Forest type mapping of bidar forest division, karnataka using geoinformatics ...eSAT Journals
 
Factors influencing compressive strength of geopolymer concrete
Factors influencing compressive strength of geopolymer concreteFactors influencing compressive strength of geopolymer concrete
Factors influencing compressive strength of geopolymer concreteeSAT Journals
 
Experimental investigation on circular hollow steel columns in filled with li...
Experimental investigation on circular hollow steel columns in filled with li...Experimental investigation on circular hollow steel columns in filled with li...
Experimental investigation on circular hollow steel columns in filled with li...eSAT Journals
 
Experimental behavior of circular hsscfrc filled steel tubular columns under ...
Experimental behavior of circular hsscfrc filled steel tubular columns under ...Experimental behavior of circular hsscfrc filled steel tubular columns under ...
Experimental behavior of circular hsscfrc filled steel tubular columns under ...eSAT Journals
 
Evaluation of punching shear in flat slabs
Evaluation of punching shear in flat slabsEvaluation of punching shear in flat slabs
Evaluation of punching shear in flat slabseSAT Journals
 
Evaluation of performance of intake tower dam for recent earthquake in india
Evaluation of performance of intake tower dam for recent earthquake in indiaEvaluation of performance of intake tower dam for recent earthquake in india
Evaluation of performance of intake tower dam for recent earthquake in indiaeSAT Journals
 
Evaluation of operational efficiency of urban road network using travel time ...
Evaluation of operational efficiency of urban road network using travel time ...Evaluation of operational efficiency of urban road network using travel time ...
Evaluation of operational efficiency of urban road network using travel time ...eSAT Journals
 
Estimation of surface runoff in nallur amanikere watershed using scs cn method
Estimation of surface runoff in nallur amanikere watershed using scs cn methodEstimation of surface runoff in nallur amanikere watershed using scs cn method
Estimation of surface runoff in nallur amanikere watershed using scs cn methodeSAT Journals
 
Estimation of morphometric parameters and runoff using rs & gis techniques
Estimation of morphometric parameters and runoff using rs & gis techniquesEstimation of morphometric parameters and runoff using rs & gis techniques
Estimation of morphometric parameters and runoff using rs & gis techniqueseSAT Journals
 
Effect of variation of plastic hinge length on the results of non linear anal...
Effect of variation of plastic hinge length on the results of non linear anal...Effect of variation of plastic hinge length on the results of non linear anal...
Effect of variation of plastic hinge length on the results of non linear anal...eSAT Journals
 
Effect of use of recycled materials on indirect tensile strength of asphalt c...
Effect of use of recycled materials on indirect tensile strength of asphalt c...Effect of use of recycled materials on indirect tensile strength of asphalt c...
Effect of use of recycled materials on indirect tensile strength of asphalt c...eSAT Journals
 

More from eSAT Journals (20)

Mechanical properties of hybrid fiber reinforced concrete for pavements
Mechanical properties of hybrid fiber reinforced concrete for pavementsMechanical properties of hybrid fiber reinforced concrete for pavements
Mechanical properties of hybrid fiber reinforced concrete for pavements
 
Material management in construction – a case study
Material management in construction – a case studyMaterial management in construction – a case study
Material management in construction – a case study
 
Managing drought short term strategies in semi arid regions a case study
Managing drought    short term strategies in semi arid regions  a case studyManaging drought    short term strategies in semi arid regions  a case study
Managing drought short term strategies in semi arid regions a case study
 
Life cycle cost analysis of overlay for an urban road in bangalore
Life cycle cost analysis of overlay for an urban road in bangaloreLife cycle cost analysis of overlay for an urban road in bangalore
Life cycle cost analysis of overlay for an urban road in bangalore
 
Laboratory studies of dense bituminous mixes ii with reclaimed asphalt materials
Laboratory studies of dense bituminous mixes ii with reclaimed asphalt materialsLaboratory studies of dense bituminous mixes ii with reclaimed asphalt materials
Laboratory studies of dense bituminous mixes ii with reclaimed asphalt materials
 
Laboratory investigation of expansive soil stabilized with natural inorganic ...
Laboratory investigation of expansive soil stabilized with natural inorganic ...Laboratory investigation of expansive soil stabilized with natural inorganic ...
Laboratory investigation of expansive soil stabilized with natural inorganic ...
 
Influence of reinforcement on the behavior of hollow concrete block masonry p...
Influence of reinforcement on the behavior of hollow concrete block masonry p...Influence of reinforcement on the behavior of hollow concrete block masonry p...
Influence of reinforcement on the behavior of hollow concrete block masonry p...
 
Influence of compaction energy on soil stabilized with chemical stabilizer
Influence of compaction energy on soil stabilized with chemical stabilizerInfluence of compaction energy on soil stabilized with chemical stabilizer
Influence of compaction energy on soil stabilized with chemical stabilizer
 
Geographical information system (gis) for water resources management
Geographical information system (gis) for water resources managementGeographical information system (gis) for water resources management
Geographical information system (gis) for water resources management
 
Forest type mapping of bidar forest division, karnataka using geoinformatics ...
Forest type mapping of bidar forest division, karnataka using geoinformatics ...Forest type mapping of bidar forest division, karnataka using geoinformatics ...
Forest type mapping of bidar forest division, karnataka using geoinformatics ...
 
Factors influencing compressive strength of geopolymer concrete
Factors influencing compressive strength of geopolymer concreteFactors influencing compressive strength of geopolymer concrete
Factors influencing compressive strength of geopolymer concrete
 
Experimental investigation on circular hollow steel columns in filled with li...
Experimental investigation on circular hollow steel columns in filled with li...Experimental investigation on circular hollow steel columns in filled with li...
Experimental investigation on circular hollow steel columns in filled with li...
 
Experimental behavior of circular hsscfrc filled steel tubular columns under ...
Experimental behavior of circular hsscfrc filled steel tubular columns under ...Experimental behavior of circular hsscfrc filled steel tubular columns under ...
Experimental behavior of circular hsscfrc filled steel tubular columns under ...
 
Evaluation of punching shear in flat slabs
Evaluation of punching shear in flat slabsEvaluation of punching shear in flat slabs
Evaluation of punching shear in flat slabs
 
Evaluation of performance of intake tower dam for recent earthquake in india
Evaluation of performance of intake tower dam for recent earthquake in indiaEvaluation of performance of intake tower dam for recent earthquake in india
Evaluation of performance of intake tower dam for recent earthquake in india
 
Evaluation of operational efficiency of urban road network using travel time ...
Evaluation of operational efficiency of urban road network using travel time ...Evaluation of operational efficiency of urban road network using travel time ...
Evaluation of operational efficiency of urban road network using travel time ...
 
Estimation of surface runoff in nallur amanikere watershed using scs cn method
Estimation of surface runoff in nallur amanikere watershed using scs cn methodEstimation of surface runoff in nallur amanikere watershed using scs cn method
Estimation of surface runoff in nallur amanikere watershed using scs cn method
 
Estimation of morphometric parameters and runoff using rs & gis techniques
Estimation of morphometric parameters and runoff using rs & gis techniquesEstimation of morphometric parameters and runoff using rs & gis techniques
Estimation of morphometric parameters and runoff using rs & gis techniques
 
Effect of variation of plastic hinge length on the results of non linear anal...
Effect of variation of plastic hinge length on the results of non linear anal...Effect of variation of plastic hinge length on the results of non linear anal...
Effect of variation of plastic hinge length on the results of non linear anal...
 
Effect of use of recycled materials on indirect tensile strength of asphalt c...
Effect of use of recycled materials on indirect tensile strength of asphalt c...Effect of use of recycled materials on indirect tensile strength of asphalt c...
Effect of use of recycled materials on indirect tensile strength of asphalt c...
 

Recently uploaded

Sheet Pile Wall Design and Construction: A Practical Guide for Civil Engineer...
Sheet Pile Wall Design and Construction: A Practical Guide for Civil Engineer...Sheet Pile Wall Design and Construction: A Practical Guide for Civil Engineer...
Sheet Pile Wall Design and Construction: A Practical Guide for Civil Engineer...Dr.Costas Sachpazis
 
Call Girls Delhi {Jodhpur} 9711199012 high profile service
Call Girls Delhi {Jodhpur} 9711199012 high profile serviceCall Girls Delhi {Jodhpur} 9711199012 high profile service
Call Girls Delhi {Jodhpur} 9711199012 high profile servicerehmti665
 
VIP Call Girls Service Hitech City Hyderabad Call +91-8250192130
VIP Call Girls Service Hitech City Hyderabad Call +91-8250192130VIP Call Girls Service Hitech City Hyderabad Call +91-8250192130
VIP Call Girls Service Hitech City Hyderabad Call +91-8250192130Suhani Kapoor
 
HARMONY IN THE HUMAN BEING - Unit-II UHV-2
HARMONY IN THE HUMAN BEING - Unit-II UHV-2HARMONY IN THE HUMAN BEING - Unit-II UHV-2
HARMONY IN THE HUMAN BEING - Unit-II UHV-2RajaP95
 
VIP Call Girls Service Kondapur Hyderabad Call +91-8250192130
VIP Call Girls Service Kondapur Hyderabad Call +91-8250192130VIP Call Girls Service Kondapur Hyderabad Call +91-8250192130
VIP Call Girls Service Kondapur Hyderabad Call +91-8250192130Suhani Kapoor
 
What are the advantages and disadvantages of membrane structures.pptx
What are the advantages and disadvantages of membrane structures.pptxWhat are the advantages and disadvantages of membrane structures.pptx
What are the advantages and disadvantages of membrane structures.pptxwendy cai
 
CCS355 Neural Network & Deep Learning UNIT III notes and Question bank .pdf
CCS355 Neural Network & Deep Learning UNIT III notes and Question bank .pdfCCS355 Neural Network & Deep Learning UNIT III notes and Question bank .pdf
CCS355 Neural Network & Deep Learning UNIT III notes and Question bank .pdfAsst.prof M.Gokilavani
 
IVE Industry Focused Event - Defence Sector 2024
IVE Industry Focused Event - Defence Sector 2024IVE Industry Focused Event - Defence Sector 2024
IVE Industry Focused Event - Defence Sector 2024Mark Billinghurst
 
(MEERA) Dapodi Call Girls Just Call 7001035870 [ Cash on Delivery ] Pune Escorts
(MEERA) Dapodi Call Girls Just Call 7001035870 [ Cash on Delivery ] Pune Escorts(MEERA) Dapodi Call Girls Just Call 7001035870 [ Cash on Delivery ] Pune Escorts
(MEERA) Dapodi Call Girls Just Call 7001035870 [ Cash on Delivery ] Pune Escortsranjana rawat
 
Biology for Computer Engineers Course Handout.pptx
Biology for Computer Engineers Course Handout.pptxBiology for Computer Engineers Course Handout.pptx
Biology for Computer Engineers Course Handout.pptxDeepakSakkari2
 
Internship report on mechanical engineering
Internship report on mechanical engineeringInternship report on mechanical engineering
Internship report on mechanical engineeringmalavadedarshan25
 
CCS355 Neural Network & Deep Learning Unit II Notes with Question bank .pdf
CCS355 Neural Network & Deep Learning Unit II Notes with Question bank .pdfCCS355 Neural Network & Deep Learning Unit II Notes with Question bank .pdf
CCS355 Neural Network & Deep Learning Unit II Notes with Question bank .pdfAsst.prof M.Gokilavani
 
Sachpazis Costas: Geotechnical Engineering: A student's Perspective Introduction
Sachpazis Costas: Geotechnical Engineering: A student's Perspective IntroductionSachpazis Costas: Geotechnical Engineering: A student's Perspective Introduction
Sachpazis Costas: Geotechnical Engineering: A student's Perspective IntroductionDr.Costas Sachpazis
 
(ANVI) Koregaon Park Call Girls Just Call 7001035870 [ Cash on Delivery ] Pun...
(ANVI) Koregaon Park Call Girls Just Call 7001035870 [ Cash on Delivery ] Pun...(ANVI) Koregaon Park Call Girls Just Call 7001035870 [ Cash on Delivery ] Pun...
(ANVI) Koregaon Park Call Girls Just Call 7001035870 [ Cash on Delivery ] Pun...ranjana rawat
 
Call Girls Narol 7397865700 Independent Call Girls
Call Girls Narol 7397865700 Independent Call GirlsCall Girls Narol 7397865700 Independent Call Girls
Call Girls Narol 7397865700 Independent Call Girlsssuser7cb4ff
 
Introduction to Microprocesso programming and interfacing.pptx
Introduction to Microprocesso programming and interfacing.pptxIntroduction to Microprocesso programming and interfacing.pptx
Introduction to Microprocesso programming and interfacing.pptxvipinkmenon1
 
GDSC ASEB Gen AI study jams presentation
GDSC ASEB Gen AI study jams presentationGDSC ASEB Gen AI study jams presentation
GDSC ASEB Gen AI study jams presentationGDSCAESB
 

Recently uploaded (20)

★ CALL US 9953330565 ( HOT Young Call Girls In Badarpur delhi NCR
★ CALL US 9953330565 ( HOT Young Call Girls In Badarpur delhi NCR★ CALL US 9953330565 ( HOT Young Call Girls In Badarpur delhi NCR
★ CALL US 9953330565 ( HOT Young Call Girls In Badarpur delhi NCR
 
Sheet Pile Wall Design and Construction: A Practical Guide for Civil Engineer...
Sheet Pile Wall Design and Construction: A Practical Guide for Civil Engineer...Sheet Pile Wall Design and Construction: A Practical Guide for Civil Engineer...
Sheet Pile Wall Design and Construction: A Practical Guide for Civil Engineer...
 
Call Girls Delhi {Jodhpur} 9711199012 high profile service
Call Girls Delhi {Jodhpur} 9711199012 high profile serviceCall Girls Delhi {Jodhpur} 9711199012 high profile service
Call Girls Delhi {Jodhpur} 9711199012 high profile service
 
young call girls in Rajiv Chowk🔝 9953056974 🔝 Delhi escort Service
young call girls in Rajiv Chowk🔝 9953056974 🔝 Delhi escort Serviceyoung call girls in Rajiv Chowk🔝 9953056974 🔝 Delhi escort Service
young call girls in Rajiv Chowk🔝 9953056974 🔝 Delhi escort Service
 
VIP Call Girls Service Hitech City Hyderabad Call +91-8250192130
VIP Call Girls Service Hitech City Hyderabad Call +91-8250192130VIP Call Girls Service Hitech City Hyderabad Call +91-8250192130
VIP Call Girls Service Hitech City Hyderabad Call +91-8250192130
 
HARMONY IN THE HUMAN BEING - Unit-II UHV-2
HARMONY IN THE HUMAN BEING - Unit-II UHV-2HARMONY IN THE HUMAN BEING - Unit-II UHV-2
HARMONY IN THE HUMAN BEING - Unit-II UHV-2
 
VIP Call Girls Service Kondapur Hyderabad Call +91-8250192130
VIP Call Girls Service Kondapur Hyderabad Call +91-8250192130VIP Call Girls Service Kondapur Hyderabad Call +91-8250192130
VIP Call Girls Service Kondapur Hyderabad Call +91-8250192130
 
9953056974 Call Girls In South Ex, Escorts (Delhi) NCR.pdf
9953056974 Call Girls In South Ex, Escorts (Delhi) NCR.pdf9953056974 Call Girls In South Ex, Escorts (Delhi) NCR.pdf
9953056974 Call Girls In South Ex, Escorts (Delhi) NCR.pdf
 
What are the advantages and disadvantages of membrane structures.pptx
What are the advantages and disadvantages of membrane structures.pptxWhat are the advantages and disadvantages of membrane structures.pptx
What are the advantages and disadvantages of membrane structures.pptx
 
CCS355 Neural Network & Deep Learning UNIT III notes and Question bank .pdf
CCS355 Neural Network & Deep Learning UNIT III notes and Question bank .pdfCCS355 Neural Network & Deep Learning UNIT III notes and Question bank .pdf
CCS355 Neural Network & Deep Learning UNIT III notes and Question bank .pdf
 
IVE Industry Focused Event - Defence Sector 2024
IVE Industry Focused Event - Defence Sector 2024IVE Industry Focused Event - Defence Sector 2024
IVE Industry Focused Event - Defence Sector 2024
 
(MEERA) Dapodi Call Girls Just Call 7001035870 [ Cash on Delivery ] Pune Escorts
(MEERA) Dapodi Call Girls Just Call 7001035870 [ Cash on Delivery ] Pune Escorts(MEERA) Dapodi Call Girls Just Call 7001035870 [ Cash on Delivery ] Pune Escorts
(MEERA) Dapodi Call Girls Just Call 7001035870 [ Cash on Delivery ] Pune Escorts
 
Biology for Computer Engineers Course Handout.pptx
Biology for Computer Engineers Course Handout.pptxBiology for Computer Engineers Course Handout.pptx
Biology for Computer Engineers Course Handout.pptx
 
Internship report on mechanical engineering
Internship report on mechanical engineeringInternship report on mechanical engineering
Internship report on mechanical engineering
 
CCS355 Neural Network & Deep Learning Unit II Notes with Question bank .pdf
CCS355 Neural Network & Deep Learning Unit II Notes with Question bank .pdfCCS355 Neural Network & Deep Learning Unit II Notes with Question bank .pdf
CCS355 Neural Network & Deep Learning Unit II Notes with Question bank .pdf
 
Sachpazis Costas: Geotechnical Engineering: A student's Perspective Introduction
Sachpazis Costas: Geotechnical Engineering: A student's Perspective IntroductionSachpazis Costas: Geotechnical Engineering: A student's Perspective Introduction
Sachpazis Costas: Geotechnical Engineering: A student's Perspective Introduction
 
(ANVI) Koregaon Park Call Girls Just Call 7001035870 [ Cash on Delivery ] Pun...
(ANVI) Koregaon Park Call Girls Just Call 7001035870 [ Cash on Delivery ] Pun...(ANVI) Koregaon Park Call Girls Just Call 7001035870 [ Cash on Delivery ] Pun...
(ANVI) Koregaon Park Call Girls Just Call 7001035870 [ Cash on Delivery ] Pun...
 
Call Girls Narol 7397865700 Independent Call Girls
Call Girls Narol 7397865700 Independent Call GirlsCall Girls Narol 7397865700 Independent Call Girls
Call Girls Narol 7397865700 Independent Call Girls
 
Introduction to Microprocesso programming and interfacing.pptx
Introduction to Microprocesso programming and interfacing.pptxIntroduction to Microprocesso programming and interfacing.pptx
Introduction to Microprocesso programming and interfacing.pptx
 
GDSC ASEB Gen AI study jams presentation
GDSC ASEB Gen AI study jams presentationGDSC ASEB Gen AI study jams presentation
GDSC ASEB Gen AI study jams presentation
 

Development of mathematical model on gas tungsten arc welding process parameters

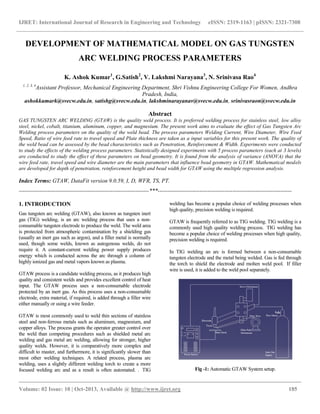
  • 1. IJRET: International Journal of Research in Engineering and Technology eISSN: 2319-1163 | pISSN: 2321-7308 __________________________________________________________________________________________ Volume: 02 Issue: 10 | Oct-2013, Available @ http://www.ijret.org 185 DEVELOPMENT OF MATHEMATICAL MODEL ON GAS TUNGSTEN ARC WELDING PROCESS PARAMETERS K. Ashok Kumar1 , G.Satish2 , V. Lakshmi Narayana3 , N. Srinivasa Rao4 1, 2, 3, 4 Assistant Professor, Mechanical Engineering Department, Shri Vishnu Engineering College For Women, Andhra Pradesh, India, ashokkumark@svecw.edu.in, satishg@svecw.edu.in, lakshminarayanav@svecw.edu.in, srinivasraon@svecw.edu.in Abstract GAS TUNGSTEN ARC WELDING (GTAW) is the quality weld process. It is preferred welding process for stainless steel, low alloy steel, nickel, cobalt, titanium, aluminum, copper, and magnesium. The present work aims to evaluate the effect of Gas Tungsten Arc Welding process parameters on the quality of the weld bead. The process parameters Welding Current, Wire Diameter, Wire Feed Speed, Ratio of wire feed rate to travel speed and Plate thickness are taken as a input variables for this present work. The quality of the weld bead can be assessed by the bead characteristics such as Penetration, Reinforcement & Width. Experiments were conducted to study the effects of the welding process parameters. Statistically designed experiments with 5 process parameters (each at 3 levels) are conducted to study the effect of these parameters on bead geometry. It is found from the analysis of variance (ANOVA) that the wire feed rate, travel speed and wire diameter are the main parameters that influence bead geometry in GTAW. Mathematical models are developed for depth of penetration, reinforcement height and bead width for GTAW using the multiple regression analysis. Index Terms: GTAW, DataFit version 9.0.59, I, D, WFR, TS, PT. --------------------------------------------------------------------***---------------------------------------------------------------------- 1. INTRODUCTION Gas tungsten arc welding (GTAW), also known as tungsten inert gas (TIG) welding, is an arc welding process that uses a non- consumable tungsten electrode to produce the weld. The weld area is protected from atmospheric contamination by a shielding gas (usually an inert gas such as argon), and a filler metal is normally used, though some welds, known as autogenous welds, do not require it. A constant-current welding power supply produces energy which is conducted across the arc through a column of highly ionized gas and metal vapors known as plasma. GTAW process is a candidate welding process, as it produces high quality and consistent welds and provides excellent control of heat input. The GTAW process uses a non-consumable electrode protected by an inert gas. As this process uses a non-consumable electrode, extra material, if required, is added through a filler wire either manually or using a wire feeder. GTAW is most commonly used to weld thin sections of stainless steel and non-ferrous metals such as aluminum, magnesium, and copper alloys. The process grants the operator greater control over the weld than competing procedures such as shielded metal arc welding and gas metal arc welding, allowing for stronger, higher quality welds. However, it is comparatively more complex and difficult to master, and furthermore, it is significantly slower than most other welding techniques. A related process, plasma arc welding, uses a slightly different welding torch to create a more focused welding arc and as a result is often automated. . TIG welding has become a popular choice of welding processes when high quality, precision welding is required. GTAW is frequently referred to as TIG welding. TIG welding is a commonly used high quality welding process. TIG welding has become a popular choice of welding processes when high quality, precision welding is required. In TIG welding an arc is formed between a non-consumable tungsten electrode and the metal being welded. Gas is fed through the torch to shield the electrode and molten weld pool. If filler wire is used, it is added to the weld pool separately. Fig -1: Automatic GTAW System setup.
  • 2. IJRET: International Journal of Research in Engineering and Technology eISSN: 2319-1163 | pISSN: 2321-7308 __________________________________________________________________________________________ Volume: 02 Issue: 10 | Oct-2013, Available @ http://www.ijret.org 186 The weld-bead formed by the GTAW process plays an important role in determining the mechanical properties of the weld and its quality. The weld-bead geometry also directly affects the complexity of weld schedules. The weld-bead shape parameters such as the bead width, reinforcement height and depth of penetration, shown in Fig 2, are determined by the GTAW process parameters such as current, voltage, welding speed and wire feed rate. Fig – 2: Weld bead geometry. 1.1 Statistical Design of Experiments A designed experiment is the simultaneous evaluation of two or more factors (parameters) for their ability to affect the resultant average or variability of particular product or process characteristics. To accomplish this in an effective and statistically proper fashion, the levels of the factors are varied in a strategic manner, the results of the particular test combinations are observed, and the complete set of results is analyzed to determine the important factors and preferred levels, and to find whether increase or decrease of those levels will potentially lead to further improvement. The initial experiments, often referred to as screening experiments, are used to find the few important, significant factors out of many possible factors involved with a product or process design. This experiment is typically a small experiment with many factors at two levels. Later rounds of experiments typically involve few factors at more than two levels to determine conditions of further improvement. 1.2 The Phases in Design of Experiments. The design of experiments (DOE) process is divided into three main phases as (1) the planning phase (2) the conducting phase (3) the analyses phase. The planning phase is by far the most important phase for the experiment to provide the expected information. An experimenter will learn the information from any experiment, sometimes in a positive sense and sometimes in a negative sense. Positive information is an indication of which factors and which levels lead to improved product or process performance. Negative information is an indication of which factors don‟t lead to improvement, but no indication of which factors do. If the experiment includes the real, yet unknown, influential factors, the experiment will yield negative information. In the planning phase factors and levels are selected and, therefore, it is the most important stage of experimentation. Also, the correct selection of factors and levels is nonstatistical in nature and is more dependent upon product and process expertise. The second most important phase is the conducting phase, where test results are actually collected. If experiments are well planned and conducted, the analysis is much easier and more likely to yield positive information about factors and levels. In the analysis phase is the positive or negative information concerning the selected factors and levels is generated based on the previous two phases. This phase is most statistical in nature of the three phases of the DOE. 1.3 Taguchi Method. Although fractional factorial design allows a fraction of the total number of runs required in the factorial design, there are no general guidelines for its application or the analysis of the results obtained by performing the experiments. Taguchi‟s approach complements these two important areas. First, he clearly defines a set of general designs for factorial experiments that cover many applications. The special set of designs consists of orthogonal arrays (OA). The use of these arrays helps to determine the least number of experiments needed for a given set of factors. A comparison of number of experiments in factorial design and Taguchi design is presented in Table 1. Second, he devised a standard method for analysis of the results. The combination of standard experimental design techniques and analysis methods in the Taguchi approach produces consistency and reproducibility rarely found in any other statistical method. Table -1: Comparison of Factorial design and Taguchi design Factors Level Factorial design Total no. of experiments Taguchi Design 2 2 4(22) 4 3 2 8(23) 4 4 2 16(24) 8 7 2 128(27) 8 15 2 32768(215) 16 4 3 81(34) 9 5 3 243(35) 18 Taguchi has established orthogonal arrays (OA) to describe a large number of experimental situations. The symbolic designation for these arrays carries the key information on the size of the experiment. For example, designated array L18 requires 18 trail runs; L9 requires 9 experiments and so on. The vertical columns of the arrays acquire a special combinatorial property i.e., in any pair of columns in an OA, all combinations of the treatment (of the two factors assigned to this pair) occur and they do so an equal number of times. This property is called the balancing property of OAs. This balancing property permits the use of simple arithmetic to
  • 3. IJRET: International Journal of Research in Engineering and Technology eISSN: 2319-1163 | pISSN: 2321-7308 __________________________________________________________________________________________ Volume: 02 Issue: 10 | Oct-2013, Available @ http://www.ijret.org 187 find the effect of the experimental factors on the response under study. Taguchi has tabulated 18 basic orthogonal arrays that we call standard orthogonal arrays. The standard orthogonal arrays along with the number of columns at different levels for these arrays are listed in Table 2. Table -2: Standard Orthogonal Arrays. Orthogonal Array Number of Rows Maximum No of factors Maximum no of columns At these levels 2 3 4 5 L4 L8 L9 L12 4 8 9 12 3 7 4 11 3 7 - 11 - - 4 - - - - - - - - - L16 L‟16 L18 L25 16 16 18 25 15 5 8 6 15 - 1 - - - 7 - - 5 - - - - - 6 L27 L32 L‟32 L36 L‟36 27 32 32 36 36 13 31 10 23 16 - 31 1 11 3 13 - - 12 13 - - 9 - - - - - - - L50 L54 L64 L‟64 L81 50 54 64 64 81 12 26 63 21 40 1 1 63 - - - 25 - - 40 - - - 21 - 11 - - - - 1.4 ANOVA Terms and Notations. The analysis of variance computes quantities known as degrees of freedom, sum of squares, mean squares, etc. and organizes them in a standard tabular format. These quantities and their interrelationships are defined as given below using the following notation. V = mean squares (variance) P = percent contribution S = sum of squares T = total (or results) S = pure sum of squares N = number of experiments f = degrees of freedom C.F = correction factor e = error (experimental) n = total degrees of freedom 1.4.1 Variance The variance of each factor is determined by the sum of the square of each trial sum result involving the factor, divided by the degrees of freedom of the factor. Thus VA = SA/fA (for factor A) VB = SB/fB (for factor B) VC = SC/fC (for factor C) Ve = e/fe (for error terms) 1.4.2 Variance Ratio. The variance ratio is the variance of the factor divided by the error variance FA = VA/Ve FB = VB/Ve FC = VC/Ve Fe = Ve/Ve 1.4.3 Pure Sum of Squares. The pure sum of squares is the sum minus the degrees of freedom times the error variance S”A = SA - fA × Ve S”B = SB - fB × Ve S”C = SC - fC × Ve S”e = Se - (fA +fB + fC) Ve 1.4.4 Percent Contribution. The percent contribution of each factor is the ratio of the factor sum to the total, expressed in percent PA = SA × 100/STPB = SB × 100/ST PC = SC × 100/ST Pe = Se × 100/ST 1.5 Selection of Orthogonal Array for the Present Work. In the experiments with gas tungsten arc welding, the number of factors chosen for study is 5, each at 3 levels. Each factor has degrees of freedom (DOF) of 2 (DOF = number of levels-1). Therefore the experiment under consideration has 10 DOF and 1 DOF for overall mean. No interaction is considered between the factors. Hence the total DOF is 11. It is required to conduct at least 11 experiments to estimate the desired effect of factors. The corresponding OA must have at least 11 rows and five 3-level columns. It can be seen from Table 3.2 that the L18 standard array meets requirements. The L18 standard orthogonal array is given in Table 3.1. It has eight columns and eighteen rows. The degree of freedom of L18 array is 18. In present work five 3-level factors are chosen. The structure of orthogonal array requires that all the 18 experiments indicated by the L18 array must be run. If one runs fewer than 18 experiments, it would not be possible to complete the analysis necessary to evaluate the desired effects.
  • 4. IJRET: International Journal of Research in Engineering and Technology eISSN: 2319-1163 | pISSN: 2321-7308 __________________________________________________________________________________________ Volume: 02 Issue: 10 | Oct-2013, Available @ http://www.ijret.org 188 Table -3: L18 (21 × 37) Orthogonal Array & its Linear Graph. Expt. No Column 1 2 3 4 5 6 7 8 1 2 3 4 5 6 1 1 1 1 1 1 1 1 1 2 2 2 1 2 3 1 2 3 1 2 3 1 2 3 1 2 3 2 3 1 1 2 3 2 3 1 1 2 3 3 1 2 1 2 3 3 1 2 7 8 9 10 11 12 1 1 1 2 2 2 3 3 3 1 1 1 1 2 3 1 2 3 2 3 1 3 1 2 1 2 3 3 1 2 3 1 2 2 3 1 2 3 1 2 3 1 3 1 2 1 2 3 13 14 15 16 17 18 2 2 2 2 2 2 2 2 2 3 3 3 1 2 3 1 2 3 2 3 1 3 1 2 3 1 2 2 3 1 1 2 3 3 1 2 3 1 2 1 2 3 2 3 1 2 3 1 2. DESIGN OF EXPERIMENTS. The process parameters selected for the present study are Welding current, wire diameter, wire feed rate, ratio of wire feed rate to travel speed, and plate thickness. The ratio of wire feed rate to travel speed (WFR/TS) is chosen as a factor instead of travel speed to avoid the erratic combinations such as high travel speed for low feed rate etc. Three levels are chosen for all the process parameters (also called factors). These selected factors and their levels are given in Table 4. Table -4: Factors and their levels used in GTAW experiments Parameters Notation Factor Levels 1 2 3 Current(A) I 140 160 180 Wire diameter(mm) D 1.2 1.4 1.6 Wire feed rate(mm/min) WFR 1500 2000 2500 Ratio of wire feed rate to travel speed (mm) WFR/TS 6 8 10 Pipe thickness PT 8 12 16 Heat input J = (1) Volume V1 = (2) Wire deposition volume V2 = (3) Efficiency η = (4) % of dilution = (5) The experimenters log after translating factors and their level values using L18 array is given in Table 5 Table -5: Experimenters log sheet for GTAW Experi m- ental Numb er Curre nt (A) Wire Diamet er (mm) Wire Feed Rate (mm/ min) Ratio of wire feed rate to travel speed Plate Thickne ss (mm) E01 140 1.2 1000 6 8 E02 140 1.4 2000 8 12 E03 140 1.6 3000 10 16 E04 160 1.2 1000 8 12 E05 160 1.4 2000 10 16 E06 160 1.6 3000 6 8 E07 180 1.2 2000 6 16 E08 180 1.4 3000 8 8 E09 180 1.6 1000 10 12 E10 140 1.2 3000 10 12 E11 140 1.4 1000 6 16 E12 140 1.6 2000 8 8 E13 160 1.2 2000 10 8 E14 160 1.4 3000 6 12 E15 160 1.6 1000 8 16 E16 180 1.2 3000 8 16 E17 180 1.4 1000 10 8 E18 180 1.6 2000 6 12 The absolute value of TS at different WFR/TS ratios is given below. Table -6: Absolute value of TS at different WFR/TS ratio Ratio 6 8 10 WFR/TS Travel Speed (mm/min) 1000 166.67 125 100 2000 333.33 250 200 3000 500 375 300
  • 5. IJRET: International Journal of Research in Engineering and Technology eISSN: 2319-1163 | pISSN: 2321-7308 __________________________________________________________________________________________ Volume: 02 Issue: 10 | Oct-2013, Available @ http://www.ijret.org 189 3. RESULTS From the microscopic examination we find penetration, reinforcement & width and further calculations like percentage of dilution, heat input (J), weld bead volume (V1), wire deposition volume (V2) and wire deposition efficiency were done by using the formulas. Table -7: Experimental results for bead geometry & % Dilution using L18 orthogonal array Experimental Number Penetration (P) mm Reinforcement (R) mm Width (W) mm % of Dilution E01 0.75 1.95 5.25 27.78 E02 0.91 2.26 7.45 28.13 E03 1.96 4.95 4.83 28.57 E04 0.82 1.96 3.22 28.57 E05 1.31 3.21 3.78 28.89 E06 2.25 5.14 10.45 30.67 E07 1.76 2.75 6.34 39.13 E08 1.91 3.12 7.22 38.78 E09 1.18 2.1 3.28 37.50 E10 0.75 1.95 7.13 27.78 E11 0.91 2.28 6.34 28.13 E12 0.98 2.58 8.28 27.93 E13 0.76 2.34 4.12 25.81 E14 2.41 4.05 9.24 37.50 E15 2.18 2.98 3.04 39.22 E16 1.78 2.53 5.98 40.00 E17 1.14 1.65 3.02 34.48 E18 2.1 2.93 9.6 39.62 Table -8: Calculations for J, V1, V2 & η using L18 orthogonal array Experimental Number Heat input (J) kJ/mm Weld Bead Volume (V1) mm3 Wire deposition (V2) mm3 Wire deposition efficiency E01 0.84 1114 1131 98.44% E02 0.50 3000 3080 97.40% E03 0.36 5880 6034 97.44% E04 0.58 1120 1131 98.99% E05 0.41 2993 3080 97.16% E06 0.96 5906 6034 97.88% E07 1.08 2208 2263 97.58% E08 0.65 4533 4620 98.11% E09 0.46 2005 2011 99.67% E10 0.36 3308 3394 97.44% E11 0.84 1512 1540 98.18% E12 0.50 3938 4023 97.89% E13 0.41 2224 2263 98.29% E14 0.96 4512 4620 97.66% E15 0.58 1976 2011 98.25% E16 0.65 3375 3394 99.43% E17 0.46 1523 1540 98.86% E18 1.08 3975 4023 98.81% Fig -3: Weld bead on 12mm thickness plates. 4. ANALYSIS OF VARIANCE (ANOVA) 4.1 Analysis of Results for Depth of Penetration From the experimental results of the 18 experiments in Table 4, it is observed that the penetration ranges from 0.75 mm to 2.41 mm. A summary of factor effects is tabulated in Table 7. The penetration value 1.043 is the average of penetrations obtained in the selectively chosen experiments out of the 18 experiments for plate thickness values of 6 mm which is level 1 for factor A. The other mean penetrations are also obtained in the same way. Delta is the variation of the mean values of penetration within that factor. The effect of factors is ranked as per the magnitude of delta values. The highest ranked factor „C‟ has the maximum effect followed by D, A, B and E in order. The factor effects are displayed graphically in Chart - 1, which makes it easy to visualize the relative effects of the various factors on depth of penetration. Table -9: Mean analysis for depth of penetration. Level A B C D E 1 1.043 1.103 1.163 1.697 1.298 2 1.622 1.432 1.303 1.430 1.362 3 1.645 1.775 1.843 1.183 1.650 Delta 0.602 0.672 0.680 0.513 0.352 Rank 3 2 1 4 5
  • 6. IJRET: International Journal of Research in Engineering and Technology eISSN: 2319-1163 | pISSN: 2321-7308 __________________________________________________________________________________________ Volume: 02 Issue: 10 | Oct-2013, Available @ http://www.ijret.org 190 180160140 1.8 1.6 1.4 1.2 1.0 1.61.41.2 300020001000 1086 1.8 1.6 1.4 1.2 1.0 16128 A MeanofMeans B C D E Main Effects Plot for Means Data Means Chart -1: Effect of factor levels on depth of penetration in GTAW. The following observations are made from the Chart -1 and Table 9 i. Wire feed rate (factor C) has the largest effect on depth of penetration. By increasing the feed rate from 1000 mm/min to 3000 mm/min, the depth of penetration can be increased by 0.68 mm. ii. The wire diameter (factor B) has the next largest effect on depth of penetration. The mean penetration is low at diameter level 1 and high at diameter level 3. The range of change in penetration depth is about 0.672 mm. iii. Current (factor A) has the next effect on the depth of penetration among the factors considered in the present study. The depth of penetration is increasing from level 1 to level 3 is 0.602 mm. iv. The wire feed rate to travel speed ratio (factor D) has the next largest effect on depth of penetration. Increasing the WFR/TS ratio from 6 to 10 i.e., reducing the travel speed, can improve depth penetration by 0.513 mm. v. Plate thickness (factor E) little effect on the depth of penetration. The mean depth of penetration is low on 8 mm plate. Depth of penetration is more on 6 mm thick plate. The change in penetration depth is about 0.6 mm. In the present analysis, since the depth of penetration is the response variable, the higher value of quality characteristic is better. Therefore, from the Fig 4, the optimum conditions chosen are A3 B3 C3 D1 E3 4.2 Analysis of Results for Reinforcement Height. It is observed from the results tabulated in Table 7, it is observed that the reinforcement ranges from 1.65 mm to 4.95 mm. A summary of factor effects is tabulated in Table 10 and the factor effects are displayed graphically in Chart-2, which makes it easy to visualize the relative effects of the various factors on Convexity Index. Table -10: Mean analysis for reinforcement height. Level A B C D E 1 2.662 2.247 2.153 3.183 2.797 2 3.280 2.762 2.678 2.572 2.542 3 2.513 3.447 3.623 2.700 3.117 Delta 0.767 1.200 1.470 0.612 0.575 Rank 3 2 1 4 5 180160140 3.6 3.2 2.8 2.4 2.0 1.61.41.2 300020001000 1086 3.6 3.2 2.8 2.4 2.0 16128 A MeanofMeans B C D E Main Effects Plot for Means Data Means Chart -2: Effect of factor levels on reinforcement height in GTAW. The following observations are made from the Chart -2 and Table 10 i. Wire feed rate (factor C) has the largest effect on reinforcement. By increasing the feed rate from 1000 mm/min to 3000 mm/min, the reinforcement can be increased by 1.47 mm. ii. The wire diameter (factor B) has the next largest effect on depth of reinforcement. By the increasing the wire diameter from 1.2 mm to 1.6 mm, the reinforcement can be increased by 1.2 mm. iii. Current (factor A) has the next effect on the reinforcement among the factors considered in the present study. The mean reinforcement is low at current level 3 and high at current level 1. The range of change in penetration depth is about 0.767 mm. iv. The wire feed rate to travel speed ratio (factor D) has the next largest effect on reinforcement. Increasing the WFR/TS ratio from 6 to 10 i.e., reducing the travel speed, can decrease reinforcement by 0.612 mm. v. Plate thickness (factor E) little effect on the depth of penetration. The mean reinforcement is low on 8 mm plate. Reinforcement is more on 12 mm thick plate. The change in reinforcement is about 0.5 mm. In the present analysis, since the depth of penetration is the response variable, the higher value of quality characteristic is better. Therefore, from the Fig 5, the optimum conditions chosen are A2 B3 C3 D1 E3.
  • 7. IJRET: International Journal of Research in Engineering and Technology eISSN: 2319-1163 | pISSN: 2321-7308 __________________________________________________________________________________________ Volume: 02 Issue: 10 | Oct-2013, Available @ http://www.ijret.org 191 4.3 Analysis of Results for Bead Width. From the experimental results of the 18 experiments in Table 7, it is observed that the bead width ranges from 3.02 mm to 10.4 mm. A summary of factor effects is tabulated in Table 11. The bead width value 6.574 is the average of bead width obtained in the selectively chosen experiments out of the 18 experiments for current value of 140A which is level 1 for factor A. The other mean bead widths are also obtained in the same way. Delta is the variation of the mean values of bead width within that factor. The effect of factors is ranked as per the magnitude of delta values. The highest ranked factor „D‟ has the maximum effect followed by C, E, B and A in order. The factor effects are displayed graphically in Chart -3, which makes it easy to visualize the relative effects of the various factors on bead width. Table -11: Mean analysis for bead width Level A B C D E 1 6.547 5.340 4.025 7.870 6.390 2 5.642 6.175 6.595 5.865 6.653 3 0.905 1.240 3.450 3.510 1.602 Rank 5 4 2 1 3 180160140 8 7 6 5 4 1.61.41.2 300020001000 1086 8 7 6 5 4 16128 A MeanofMeans B C D E Main Effects Plot for Means Data Means Chart -3: Effect of factor levels on bead width in GTAW. The following observations are made from the Chart -3 and Table 11 i. The wire feed rate to travel speed ratio (factor D) has the largest effect on bead width. Increasing the WFR/TS ratio from 6 to 10 i.e., reducing the travel speed, can decrease the bead width by 3.51 mm. ii. Wire feed rate (factor C) has the next largest effect on bead width. By increasing the feed rate from 1000 mm/min to 3000 mm/min, the bead width can be increased by 3.45 mm. iii. The wire diameter (factor B) has the next largest effect on bead width. The bead width is increasing from level 1 to level 3 is 0.602 mm. iv. Current (factor A) has the next effect on the bead width among the factors considered in the present study. The mean width is high at diameter level 1 and low at diameter level 2. The range of change in bead width is about 1.24 mm. v. Plate thickness (factor E) little effect on the bead width. The mean width is high on 12 mm plate. Bead width is more on 16 mm thick plate. The change in width is about 1.6 mm. In the present analysis, since the bead width is the response variable, the higher value of quality characteristic is better. Therefore, from the Fig 6, the optimum conditions chosen are A1 B3 C3 D1 E2. 4.4 Development of Mathematical Models. The experimental results that are given in previous section are used to obtain the mathematical relationship between process parameters and bead geometry. The coefficients of mathematical models are computed by using method of multiple regressions. A commercial software Datafit has been used for the regression analysis. This software is used to test several models viz., linear, exponential, power series (user defined). Out of all models tested the model that has high coefficient of multiple determination (R2) value and better t-ratio is chosen. The adequacy of the models and the significance of coefficients are tested by applying analysis of variance and student (T) test. The relationship between penetration (or reinforcement or width ) as response variable(s) and to give process parameters viz., current, wire diameter, wire feed rate, WFR/TS ratio & plate thickness as independent parameters can be expressed as Y = 10a X1 b X2 c X3 d X4 e X5 f Where Y is the penetration in mm, or convexity index X1 - current, A (factor A) X2 – wire diameter, mm (factor B) X3 - wire feed rate, m/min (factor C) X4 – wire feed rate/travel speed ratio (factor D) X5 – plate thickness, mm (factor E) a, b, c, d, e and f - regression variables The multiple regression analysis resulted the following equations Penetration P = -- (5.1) Reinforcement R = -- (5.2)
  • 8. IJRET: International Journal of Research in Engineering and Technology eISSN: 2319-1163 | pISSN: 2321-7308 __________________________________________________________________________________________ Volume: 02 Issue: 10 | Oct-2013, Available @ http://www.ijret.org 192 Width W = -- (5.3) Regression analysis results are presented in Table 11 for depth of penetration. The adequacy of the each model is tested by the analysis of variance (ANOVA). Table 12 shows the ANOVA for penetration. Model Definition: Penetration Y = 10^a*x1^b*x2^c*x3^d*x4^e*x5^f Number of observations = 18 Number of missing observations = 0 Solver type: Nonlinear Nonlinear iteration limit = 250 Diverging nonlinear iteration limit =10 Number of nonlinear iterations performed = 27 Residual tolerance = 0.0000000001 Sum of Residuals = -4.37332326231613E-02 Average Residual = -2.42962403462007E-03 Residual Sum of Squares (Absolute) = 1.22954527201257 Residual Sum of Squares (Relative) = 1.22954527201257 Standard Error of the Estimate = 0.320097025917216 Coefficient of Multiple Determination (R^2) = 0.7963047493 Proportion of Variance Explained = 79.63047493% Adjusted coefficient of multiple determination (Ra^2) = 0.7114317282 Durbin-Watson statistic = 1.59153398914335 99% Confidence Intervals Variable Value a -4.94017608223145 b 1.48698475532579 c 1.75338382648395 d 0.468398480585137 e -0.533858513200747 f 0.465522943706036 Y = --- (5.1) Table -12: Analysis of Variance for depth of penetration model Source Regressio n Error Total DF 5 12 17 Sum of Square s 4.8066 1.2295 6.0362 Mean Square 0.96133 0.10246 F Rati o 9.38 23 Prob(F) 0.00079 Chart -4 shows the relationship between experimental value and predicted value of depth of penetration in Gas Tungsten Arc Welding. It is observed from the Chart -4 that the values predicted by penetration model (Eqn. 5.1) are in good agreement with experimental values. The experimental and predicted values of penetration and percentage error are given in Table 13. It can be observed from the table that the percentage error is less than 29% in all the cases except one. Hence it is concluded that the model can predict the depth of penetration in GTAW with good accuracy. Chart-4: Results based on experimental and predicted values of penetration. Table -13: Comparison between predicted value and experimental value of penetration in GTAW Exp. No. Penetratio n (P) mm Calculate d (P) Residual % Error E01 0.75 0.63 -0.12 -15.85 E02 0.91 1.19 0.28 30.23 E03 1.96 1.84 -0.12 -6.22 E04 0.82 0.80 -0.02 -2.77 E05 1.31 1.47 0.16 11.98 E06 2.25 2.13 -0.12 -5.22 E07 1.76 1.75 -0.01 -0.45 E08 1.91 1.72 -0.19 -9.73 E09 1.18 1.40 0.22 18.34 E10 0.75 0.97 0.22 29.44 E11 0.91 1.14 0.23 25.48 E12 0.98 1.24 0.26 26.54 E13 0.76 0.81 0.05 6.68 E14 2.41 2.04 -0.37 -15.44 E15 2.18 1.51 -0.67 -30.76 E16 1.78 1.82 0.04 2.07 E17 1.14 0.91 -0.23 -19.75 E18 2.1 2.54 0.44 20.84
  • 9. IJRET: International Journal of Research in Engineering and Technology eISSN: 2319-1163 | pISSN: 2321-7308 __________________________________________________________________________________________ Volume: 02 Issue: 10 | Oct-2013, Available @ http://www.ijret.org 193 So the values of current and wire diameter are taken as 180 A and 1.6 mm respectively for plotting predicted the depth of penetration at different wire feed rates, WFR/TS ratio and on different plate thickness. It is observed from the plots that the depth of penetration increases with increase in wire feed rate or increase in welding speed (i.e., increase in WFR/TS ratio) for a given plate thickness. This is because at high wire feed rate the heat input is more and hence more depth of penetration. are useful to predict the depth of penetration at different wire feed rates and at different WFR/TS ratio. CONCLUSIONS 1. From the present work the mathematical models were developed for penetration, reinforcement and width. 2. Compression had made between the experimental values and predicted values (by using generated formulas) are showing reasonable agreement. REFERENCES [1] I.S. Kim, J.S. Son, H.J. Kim and B.A. Chin, “A study on variation of shielding gas in GTA welding using finite element method”, AMME Volume 17, issue 1-2, pp. 249-252, July – august 2006. [2] Y. S. Tarng and W. H. Yang Yang “Optimization of the Weld Bead Geometry in Gas Tungsten Arc Welding by the Taguchi Method”. The International| Journal of advanced Manufacturing Technology, pp. 549 – 554, 1998. [3] Dr Sun Zheng, Dr Kuo Min and Pan Dayou, “Twin Wire Gas Tungsten Arc Cladding”, Joining Technology Group, Process Technology Division, 1999. [4] Bernard Mannion and Jack Heinzman “ Determining parameters for GTAW”, July/August 1999 issue of Practical Welding Today. [5] S. X. Lv*, Z. W. Xu, H. T. Wang and S. Q. Yang “Investigation on TIG cladding of copper alloy on steel plate”, Science and Technology of Welding and Joining, Volume 13, pp. 10-16, 2008. [6] T.Jayananda Kumar, “Effect of input current on dilution in claddings produced by gtaw process”, [7] AWS Welding Handbook, 8th Edition. [8] The Welding Institute Journal, 175/1982, Study of Welding Process Prameters. [9] The Welding Institute Journal, 283/1985, Dilution. [10] “Modern Arc Welding Technology” By S.V. Nadkarni. [11] “Metals Handbook, 8th Edition, Vol-1” Properties and selection of metals of American society for metals. [12] “Materials Handbook” By AWS. [13] “The Procedure Handbook of Arc Welding” 12th Edition, By Lincoln. [14] “Mechanical Metallurgy” By Linnert. BIOGRAPHIES Mr. K. Ashok Kumar working as an Assistant Professor in the Department of Mechanical Engineering at Shri Vishnu Engineering College for Women, Bhimavaram. Mr. K.Ashok Kumar obtained his B.E first class at TJIT, Channai, M.Tech first class with distinction from GIET, Rajahmundry and have 1year industrial and 2years teaching experience. Mr. G. Satish working as an Assistant Professor in the Department of Mechanical Engineering at Shri Vishnu Engineering College for Women, Bhimavaram and obtained his B.Tech and M.Tech(Machine Design) degrees both with first class at JNTUK. He has experience of 2years as CAD engineer and 2years teaching and published 1 international journal. Mr. V. Lakshmi Narayana working as an Assistant Professor in the Department of Mechanical Engineering at Shri Vishnu Engineering College for Women, Bhimavaram. He has completed his B.Tech in the discipline of Mechanical and M.Tech in CAD/CAM. He did both degrees in first class with distinction. He has work experience of 1 year as CAD Engineer and 4 years as an Assistant Professor. Mr. N. Srinivasa Rao working as an Assistant Professor in the Department of Mechanical Engineering at Shri Vishnu Engineering College for Women, Bhimavaram. He has completed his B.Tech in the discipline of Mechanical and M.Tech in Automobile Engineering in NIT Warangal. He did both degrees in first class. He has 3 years as an Assistant Professor in teaching.