6. 64,7884.56%2,213,889$6730.00%174Guinea-
Bissau$1,346,841,8975.92%1,828,145$7370.00%175Solomon
Islands$1,303,453,6223.24%636,039$2,0490.00%176Grenada$1
,126,882,2965.06%110,874$10,1640.00%177Comoros$1,068,12
4,3302.71%813,892$1,3120.00%178Saint Kitts &
Nevis$992,007,4031.17%52,045$19,0610.00%179Vanuatu$862,
879,7894.50%285,510$3,0220.00%180Samoa$840,927,9972.70
%195,352$4,3050.00%181St. Vincent &
Grenadines$785,222,5090.86%109,827$7,1500.00%182America
n Samoa$634,000,000-
5.38%55,620$11,3990.00%183Dominica$496,727,000-
9.53%71,458$6,9510.00%184Tonga$427,659,7952.70%101,998
$4,1930.00%185Sao Tome &
Principe$392,570,2933.87%207,089$1,8960.00%186Micronesia
$336,427,5003.20%532,899$6310.00%187Palau$289,823,500-
3.57%17,808$16,2750.00%188Marshall
Islands$204,173,4303.60%58,058$3,5170.00%189Kiribati$185,
572,5020.33%114,158$1,6260.00%190Tuvalu$39,731,3173.24%
11,370$3,4940.00%191Saint
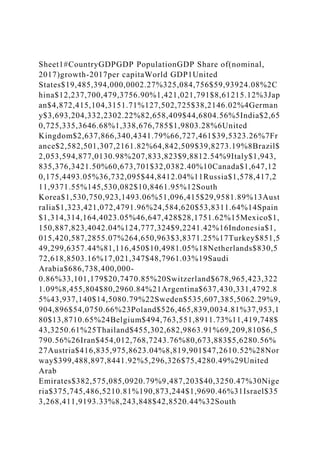
Martin$00.00%36,560$00.00%Questions:1Select top 30
countries from this list according to their GDP (201&)and
Calculate their average Per-capita GDPWhat is the standard
deviation in GDP per capita for this group?2Test the Hypothesis
that US's GDP per capita is same as that of the average of these
group3Select bottom 30 countries from this list according to
their GDP (2019)What is the average GDP growth rate for these
group of countries?4Test the hypothesis that the average gdp
growth rate of the bottom 30 countries is greater than the
average gdp growth rate of the top 30 countries.5Test the
hypothesis that Share of World GDP does not depend on the gdp
growth rateShow workhttps://www.worldometers.info/gdp/us-
gdp/https://www.worldometers.info/gdp/canada-
gdp/https://www.worldometers.info/gdp/estonia-
gdp/https://www.worldometers.info/gdp/uganda-
gdp/https://www.worldometers.info/gdp/zambia-
gdp/https://www.worldometers.info/gdp/nepal-