SlideShare a Scribd company logo
1 of 1
Download to read offline
SBA Communications, Inc. (SBAC)
Balance Sheet as of 30-Sep-15 FYE Dec 31, 2012 2013 2014 2015E 2016P 2017P 2018P 2019P 2020P 2021P 2022P
Shares Outstanding 126.1 Towers 17,491 20,079 24,292 25,424 26,133 27,133 28,133 29,133 30,133 31,133 32,133
Options (a) 0.9 Growth 14.8% 21.0% 4.7% 2.8% 3.8% 3.7% 3.6% 3.4% 3.3% 3.2%
Total Diluted Shares 127.0
Revenue 954$ 1,305$ 1,527$ 1,635$ 1,658$ 1,782$ 1,935$ 2,113$ 2,309$ 2,558$ 2,827$
Market Price 107.00$ Growth 36.8% 17.0% 7.0% 1.4% 7.5% 8.6% 9.2% 9.2% 10.8% 10.5%
Equity Market Capitalization 13,585$ NOI (TCF+Service Cash Flow) 675 897 1,099 1,191 1,213 1,328 1,469 1,629 1,805 2,035 2,281
Margin 70.7% 68.7% 71.9% 72.9% 73.2% 74.5% 75.9% 77.1% 78.2% 79.5% 80.7%
Debt 8,487$
Less: Liquid Assets / Securities 121$ Adjusted EBITDA 588 797 999 1,092 1,126 1,239 1,379 1,538 1,711 1,938 2,181
Margin 61.6% 61.1% 65.4% 66.8% 67.9% 69.5% 71.3% 72.8% 74.1% 75.7% 77.2%
Net Debt 8,366$
EBIT 147 230 337 328 394 508 646 804 978 1,219 1,475
Total Enterprise Value 21,951$
Interest Expense 278 312 337 340 361 369 390 420 451 490 532
52 Week High $128.47
52 Week Low $101.12 Net Income (181) (56) (24) (197) 33 140 256 384 527 728 943
Leverage Statistics FCF 228 329 473 490 607 638 753 880 1,019 1,204 1,403
Pro Forma Net Debt/EBITDA 7.7
EBITDA/Interest Expense 3.2 FCF/Share 1.88$ 2.53$ 3.58$ 3.83$ 5.06$ 5.51$ 6.88$ 8.64$ 10.71$ 13.58$ 17.11$
Net Debt/Total Enterprise 38.1%
AFFO / Share 3.09$ 4.09$ 5.21$ 5.69$ 6.20$ 7.32$ 8.82$ 10.76$ 13.02$ 16.11$ 19.89$
Federal NOL Position 1,300$
EBITDA Multiple 37.3 27.5 22.0 20.1 19.5 17.7 15.9 14.3 12.8 11.3 10.1
Based on current PT income estimates, burndown FCF Multiple 56.8 42.3 29.9 27.9 21.1 19.4 15.5 12.4 10.0 7.9 6.3
would occur in 2020. Does that drive REIT conv? AFFO Multiple 34.6 26.2 20.5 18.8 17.3 14.6 12.1 9.9 8.2 6.6 5.4
Can they improve tax position?
Net Debt / EBITDA 8.7x 7.2x 7.8x 8.2x 7.9x 7.6x 7.5x 7.3x 7.4x 7.2x 7.0x
SBA is a higher quality asset than other REITS, Interest Coverage 2.1x 2.6x 3.0x 3.2x 3.1x 3.4x 3.5x 3.7x 3.8x 4.0x 4.1x
faster growth, lower capital intensity w/ better
interest rate coverage. 2-4x premium vs group
seems reasonable 2012 2013 2014 2015E 2016P 2017P 2018P 2019P 2020P 2021P 2022P
TCF 675$ 897$ 1,099$ 1,191$ 1,213$ 1,328$ 1,469$ 1,629$ 1,805$ 2,035$ 2,281$
Valuation Multiple 22.0 22.0 22.0 22.0 22.0 22.0 22.0 22.0 22.0 22.0 22.0
14,841$ 19,726$ 24,167$ 26,212$ 26,697$ 29,205$ 32,310$ 35,848$ 39,721$ 44,765$ 50,193$
Total Intrinsic Value 14,841$ 19,726$ 24,167$ 26,212$ 26,697$ 29,205$ 32,310$ 35,848$ 39,721$ 44,765$ 50,193$
Less: Net Debt 5,090 5,702 7,763 8,954 8,915 9,401 10,273 11,268 12,624 14,045 15,267
Equity Value 9,751$ 14,024$ 16,404$ 17,258$ 17,782$ 19,804$ 22,037$ 24,581$ 27,097$ 30,720$ 34,926$
FD Shares Outstanding 149.0 141.0 130.4 122.4 118.3 113.0 105.3 97.8 91.9 84.8 78.9
Intrinsic Value Per share 65$ 99$ 126$ 141$ 150$ 175$ 209$ 251$ 295$ 362$ 443$
Current Market - Discount to Intrinsic Value 28.8% 39.0% 48.9% 57.4% 63.7% 70.5% 75.8%
Implied average buyback price 124.54$ 139.63$ 163.62$ 199.55$ 254.53$ 316.01$ 379.28$
New Build CAPEX 113 168 211 226 147 222 225 228 231 234 236
Acquisitions 2,259 687 1,591 614 68 375 375 375 375 375 375
Share Buybacks - - - (900) (500) (750) (1,250) (1,500) (1,500) (2,250) (2,250)

More Related Content

Similar to SBAC Top Sheet

Page 1 Front PagePage 2 Stocks & BondsPage 3 Financial Sum.docx
Page 1 Front PagePage 2 Stocks & BondsPage 3 Financial Sum.docxPage 1 Front PagePage 2 Stocks & BondsPage 3 Financial Sum.docx
Page 1 Front PagePage 2 Stocks & BondsPage 3 Financial Sum.docx
alfred4lewis58146
 
Google - Investment Analysis & Mgmt 120213 10pm v4 final
Google - Investment Analysis & Mgmt  120213 10pm v4 finalGoogle - Investment Analysis & Mgmt  120213 10pm v4 final
Google - Investment Analysis & Mgmt 120213 10pm v4 final
Richard Chan, MBA
 
Lifetime Fitness 2010 Shareholder Presentation
Lifetime Fitness 2010 Shareholder PresentationLifetime Fitness 2010 Shareholder Presentation
Lifetime Fitness 2010 Shareholder Presentation
Fitmarc
 
Abc brasil investor_presentation2q13_eng
Abc brasil investor_presentation2q13_engAbc brasil investor_presentation2q13_eng
Abc brasil investor_presentation2q13_eng
BancoABCRI
 

Similar to SBAC Top Sheet (20)
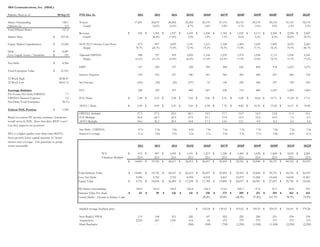
ACG Cup - Valuation
ACG Cup - ValuationACG Cup - Valuation
ACG Cup - Valuation
 
September 2017 digital realty company overview
September 2017 digital realty company overviewSeptember 2017 digital realty company overview
September 2017 digital realty company overview
 
Value Line Investment Research
Value Line Investment ResearchValue Line Investment Research
Value Line Investment Research
 
Synex Oppday Q3/55
Synex Oppday Q3/55 Synex Oppday Q3/55
Synex Oppday Q3/55
 
September 2017 digital realty company overview
September 2017 digital realty company overviewSeptember 2017 digital realty company overview
September 2017 digital realty company overview
 
TMUS ICM November 2020 update 11.9.20
TMUS ICM November 2020 update 11.9.20TMUS ICM November 2020 update 11.9.20
TMUS ICM November 2020 update 11.9.20
 
VinaGame - Ratio.pdf
VinaGame - Ratio.pdfVinaGame - Ratio.pdf
VinaGame - Ratio.pdf
 
As of June 30, 2017
As of June 30, 2017As of June 30, 2017
As of June 30, 2017
 
BGSA Supply Chain Index: August 2019
BGSA Supply Chain Index: August 2019BGSA Supply Chain Index: August 2019
BGSA Supply Chain Index: August 2019
 
Sonata IC
Sonata ICSonata IC
Sonata IC
 
Bank of baroda_q4_fy10
Bank of baroda_q4_fy10Bank of baroda_q4_fy10
Bank of baroda_q4_fy10
 
Cfa research presentation university at buffalo
Cfa research presentation university at buffalo Cfa research presentation university at buffalo
Cfa research presentation university at buffalo
 
Mastek 1QFY18
Mastek 1QFY18Mastek 1QFY18
Mastek 1QFY18
 
Page 1 Front PagePage 2 Stocks & BondsPage 3 Financial Sum.docx
Page 1 Front PagePage 2 Stocks & BondsPage 3 Financial Sum.docxPage 1 Front PagePage 2 Stocks & BondsPage 3 Financial Sum.docx
Page 1 Front PagePage 2 Stocks & BondsPage 3 Financial Sum.docx
 
Google - Investment Analysis & Mgmt 120213 10pm v4 final
Google - Investment Analysis & Mgmt  120213 10pm v4 finalGoogle - Investment Analysis & Mgmt  120213 10pm v4 final
Google - Investment Analysis & Mgmt 120213 10pm v4 final
 
Lifetime fitness 2010 shareholder presentation
Lifetime fitness 2010 shareholder presentationLifetime fitness 2010 shareholder presentation
Lifetime fitness 2010 shareholder presentation
 
Lifetime Fitness 2010 Shareholder Presentation
Lifetime Fitness 2010 Shareholder PresentationLifetime Fitness 2010 Shareholder Presentation
Lifetime Fitness 2010 Shareholder Presentation
 
Credit Corp - turnaround in performance
Credit Corp - turnaround in performance Credit Corp - turnaround in performance
Credit Corp - turnaround in performance
 
Sample LBO Model Template
Sample LBO Model TemplateSample LBO Model Template
Sample LBO Model Template
 
Abc brasil investor_presentation2q13_eng
Abc brasil investor_presentation2q13_engAbc brasil investor_presentation2q13_eng
Abc brasil investor_presentation2q13_eng
 

SBAC Top Sheet

  • 1. SBA Communications, Inc. (SBAC) Balance Sheet as of 30-Sep-15 FYE Dec 31, 2012 2013 2014 2015E 2016P 2017P 2018P 2019P 2020P 2021P 2022P Shares Outstanding 126.1 Towers 17,491 20,079 24,292 25,424 26,133 27,133 28,133 29,133 30,133 31,133 32,133 Options (a) 0.9 Growth 14.8% 21.0% 4.7% 2.8% 3.8% 3.7% 3.6% 3.4% 3.3% 3.2% Total Diluted Shares 127.0 Revenue 954$ 1,305$ 1,527$ 1,635$ 1,658$ 1,782$ 1,935$ 2,113$ 2,309$ 2,558$ 2,827$ Market Price 107.00$ Growth 36.8% 17.0% 7.0% 1.4% 7.5% 8.6% 9.2% 9.2% 10.8% 10.5% Equity Market Capitalization 13,585$ NOI (TCF+Service Cash Flow) 675 897 1,099 1,191 1,213 1,328 1,469 1,629 1,805 2,035 2,281 Margin 70.7% 68.7% 71.9% 72.9% 73.2% 74.5% 75.9% 77.1% 78.2% 79.5% 80.7% Debt 8,487$ Less: Liquid Assets / Securities 121$ Adjusted EBITDA 588 797 999 1,092 1,126 1,239 1,379 1,538 1,711 1,938 2,181 Margin 61.6% 61.1% 65.4% 66.8% 67.9% 69.5% 71.3% 72.8% 74.1% 75.7% 77.2% Net Debt 8,366$ EBIT 147 230 337 328 394 508 646 804 978 1,219 1,475 Total Enterprise Value 21,951$ Interest Expense 278 312 337 340 361 369 390 420 451 490 532 52 Week High $128.47 52 Week Low $101.12 Net Income (181) (56) (24) (197) 33 140 256 384 527 728 943 Leverage Statistics FCF 228 329 473 490 607 638 753 880 1,019 1,204 1,403 Pro Forma Net Debt/EBITDA 7.7 EBITDA/Interest Expense 3.2 FCF/Share 1.88$ 2.53$ 3.58$ 3.83$ 5.06$ 5.51$ 6.88$ 8.64$ 10.71$ 13.58$ 17.11$ Net Debt/Total Enterprise 38.1% AFFO / Share 3.09$ 4.09$ 5.21$ 5.69$ 6.20$ 7.32$ 8.82$ 10.76$ 13.02$ 16.11$ 19.89$ Federal NOL Position 1,300$ EBITDA Multiple 37.3 27.5 22.0 20.1 19.5 17.7 15.9 14.3 12.8 11.3 10.1 Based on current PT income estimates, burndown FCF Multiple 56.8 42.3 29.9 27.9 21.1 19.4 15.5 12.4 10.0 7.9 6.3 would occur in 2020. Does that drive REIT conv? AFFO Multiple 34.6 26.2 20.5 18.8 17.3 14.6 12.1 9.9 8.2 6.6 5.4 Can they improve tax position? Net Debt / EBITDA 8.7x 7.2x 7.8x 8.2x 7.9x 7.6x 7.5x 7.3x 7.4x 7.2x 7.0x SBA is a higher quality asset than other REITS, Interest Coverage 2.1x 2.6x 3.0x 3.2x 3.1x 3.4x 3.5x 3.7x 3.8x 4.0x 4.1x faster growth, lower capital intensity w/ better interest rate coverage. 2-4x premium vs group seems reasonable 2012 2013 2014 2015E 2016P 2017P 2018P 2019P 2020P 2021P 2022P TCF 675$ 897$ 1,099$ 1,191$ 1,213$ 1,328$ 1,469$ 1,629$ 1,805$ 2,035$ 2,281$ Valuation Multiple 22.0 22.0 22.0 22.0 22.0 22.0 22.0 22.0 22.0 22.0 22.0 14,841$ 19,726$ 24,167$ 26,212$ 26,697$ 29,205$ 32,310$ 35,848$ 39,721$ 44,765$ 50,193$ Total Intrinsic Value 14,841$ 19,726$ 24,167$ 26,212$ 26,697$ 29,205$ 32,310$ 35,848$ 39,721$ 44,765$ 50,193$ Less: Net Debt 5,090 5,702 7,763 8,954 8,915 9,401 10,273 11,268 12,624 14,045 15,267 Equity Value 9,751$ 14,024$ 16,404$ 17,258$ 17,782$ 19,804$ 22,037$ 24,581$ 27,097$ 30,720$ 34,926$ FD Shares Outstanding 149.0 141.0 130.4 122.4 118.3 113.0 105.3 97.8 91.9 84.8 78.9 Intrinsic Value Per share 65$ 99$ 126$ 141$ 150$ 175$ 209$ 251$ 295$ 362$ 443$ Current Market - Discount to Intrinsic Value 28.8% 39.0% 48.9% 57.4% 63.7% 70.5% 75.8% Implied average buyback price 124.54$ 139.63$ 163.62$ 199.55$ 254.53$ 316.01$ 379.28$ New Build CAPEX 113 168 211 226 147 222 225 228 231 234 236 Acquisitions 2,259 687 1,591 614 68 375 375 375 375 375 375 Share Buybacks - - - (900) (500) (750) (1,250) (1,500) (1,500) (2,250) (2,250)