SlideShare a Scribd company logo
1 of 156
Journal of Monetary Economics 22 (1988) 3-42. North-Holland
ON THE MECHANICS OF ECONOMIC DEVELOPMENT*
Robert E. LUCAS, Jr.
University of Chicago, Chicago, 1L 60637, USA
Received August 1987, final version received February 1988
This paper considers the prospects for constructing a
neoclassical theory of growth and interna-
tional trade that is consistent with some of the main features of
economic development. Three
models are considered and compared to evidence: a model
emphasizing physical capital accumula-
tion and technological change, a model emphasizing human
capital accumulation through school-
ing. and a model emphasizing specialized human capital
accumulation through learning-by-doing.
1. Introduction
By the problem of economic development I mean simply the
problem of
accounting for the observed pattern, across countries and across
time, in levels
and rates of growth of per capita income. This may seem too
narrow a
definition, and perhaps it is, but thinking about income patterns
will neces-
sarily involve us in thinking about many other aspects of
societies too. so I
would suggest that we withhold judgment on the scope of this
definition until
we have a clearer idea of where it leads us.
The main features of levels and rates of growth of national
incomes are well
enough known to all of us, but I want to begin with a few
numbers, so as to
set a quantitative tone and to keep us from getting mired in the
wrong kind of
details. Unless I say otherwise, all figures are from the World
Bank's World
Development Report of 1983.
The diversity across countries in measured per capita income
levels is
literally too great to be believed. Compared to the 1980 average
for what the
WorId Bank calls the 'industrial market economies' (Ireland up
through
Switzerland) of U.S. $10,000, India's per capita income is $240,
Haiti's is $270,
*This paper was originally written for the Marshall Lectures,
given at Cambridge University in
1985. ! am very grateful to the Cambridge faculty for this
honor, and also for the invitatiou's long
lead time, which gave me the opportunity to think through a
new topic with the stimulus of so
distinguished an audience in prospect. Since then, versions of
this lecture have been given as the
David Horowitz Lectures in Israel, the W.A. Mackintosh
Lecture at Queens University, the Carl
Snyder Memorial Lecture at the University of California at
Santa Barbara, the Chung-Hua
Lecture in Taipei. the Nancy Schwartz Lecture at Northwestern
University, and the Lionel
McKenzie Lecture at the University of Rochester. I have also
based several seminars on various
parts of this material.
0304-3932j88j$3.50©1988, Elsevier Science Publishers B.V.
(North-Holland)
4 R. E. Lucas, Jr., On the mechanics of economic development
and so on for the rest of the very poorest countries. This is a
difference of a
factor of 40 in living standards! These latter figures are too low
to sustain life
in, say, England or the United States, so they cannot be taken at
face value
and I will avoid hanging too much on their exact magnitudes.
But I do not
think anyone will argue that there is not enormous diversity in
living stan-
dards. I
Rates of growth of real per capita GNP are also diverse, even
over sustained
periods. For 1960-80 we observe, for example: India, 1.4% per
year; Egypt,
3.4%; South Korea, 7.0%; Japan, 7.1 %; the United States,
2.3%; the industrial
economies averaged 3.6%. To obtain from growth rates the
number of years it
takes for incomes to double, divide these numbers into 69 (the
log of 2 times
100). Then Indian incomes will double every 50 years; Korean
every 10. An
Indian will, on average, be twice as well off as his grandfather;
a Korean 32
times. These differences are at least as striking as differences in
income levels,
and in some respects more trustworthy, since within-country
income compari-
sons are easier to draw than across-country comparisons.
I have not calculated a correlation across countries between
income levels
and rates of growth, but it would not be far from zero. (The
poorest countries
tend to have the lowest growth; the wealthiest next; the 'middle-
income'
countries highest.) The generalizations that strike the eye have
to do with
variability within these broad groups: the rich countries show
little diversity
(Japan excepted - else it would not have been classed as a rich
country in
1980 at all). Within the poor countries (low and middle income)
there is
enormous variability. 2
Within the advanced countries, growth rates tend to be very
stable over long
periods of time, provided one averages over periods long
enough to eliminate
business-cycle effects (or corrects for short-term fluctuations in
some other
way). For poorer countries, however, there are many examples
of sudden, large
changes in growth rates, both up and down. Some of these
changes are no
doubt due to political or military disruption: Angola's total GDP
growth fell
from 4.8 in the 60s to - 9.2 in the 70s; Iran's fell from 11.3 to
2.5, comparing
the same two periods. I do not think we need to look to
economic theory for
an account of either of these declines. There are also some
striking examples
1 The income estimates reported in Summers and Heston (1984)
are more satisfactory than those
in the World Development Reports. In 1975 U.S. dollars, these
authors estimate 1980 U.S. real
GDP per capita at $8000, and for the industrialized economies
as a group, $5900. The comparable
figures for India and Haiti are $460 and $500, respectively.
Income differences of a factor of 16 are
certainly smaJler, and J think more accurate, than a factor of 40,
but I think they are still fairly
described as exhibiting 'enormous diversity'.
2 Baumol (1986) summarizes evidence, mainly from Maddison
(1982) indicating apparent
convergence during this century to a common path of the
income levels of the wealthiest
countries. But De Long (1987) shows that this effect is entirely
due to 'selection bias': If one
examines the countries with the highest income levels at the
beginning of the century (as opposed
to currently, as in Maddison's 'sample') the data show apparent
divergence!
R.E. Lucas. Jr., On the mechanics of economic development 5
of sharp increases in growth rates. The four East Asian
'miracles' of South
Korea, Taiwan, Hong Kong and Singapore are the most familiar:
for the
1960-80 period, per capita income in these economies grew at
rates of 7.0, 6.5,
6.8 and 7.5, respectively, compared to much lower rates in the
1950's and
earlier. 3,4 Between the 60s and the 70s, Indonesia's GDP
growth increased
from 3.9 to 7.5; Syria's from 4.6 to 10.0.
I do not see how one can look at figures like these without
seeing them as
representing possibilities. Is there some action a government of
India could
take that would lead the Indian economy to grow like
Indonesia's I)r Egypt's?
If so, what, exactly? If not, what is it about the' nature of India'
that makes it
so? The consequences for human welfare involved in questions
like these are
simply staggering: Once one starts to think about them, it is
hard to think
about anything else.
This is what we need a theory of economic development for: to
provide
some kind of framework for organizing facts like these, for
judging which
represent opportunities and which necessities. But the term'
theory' is used in
so many different ways, even within economics, that if I do not
clarify what I
mean by it early on, the gap between what I think I am saying
and what you
think you are hearing will grow too wide for us to have a
serious discussion. I
prefer to use the term' theory' in a very narrow sense, to refer to
an explicit
dynamic system, something that can be put on a computer and
run. This is
what I mean by the' mechanics' of economic development - the
construction
of a mechanical, artificial world, populated by the interacting
robots that
economics typically studies, that is capable of exhibiting
behavior the gross
features of which resemble those of the actual world that I have
just described.
My lectures will be occupied with one such construction, and it
will take some
work: It is easy to set out models of economic growth based on
reasonable-
looking axioms that predict the cessation of growth in a few
decades, or that
predict the rapid convergence of the living standards of
different economies to
a common level, or that otherwise produce logically possible
outcomes that
bear no resemblance to the outcomes produced by actual
economic systems.
On the other hand, there is no doubt that there must be
mechanics other than
the ones I will describe that would fit the facts about as well as
mine. This is
why I have titled the lectures 'On the Mechanics ... ' rather than
simply 'The
Mechanics of Economic Development'. At some point, then, the
study of
development will need to involve working out the implications
of competing
theories for data other than those they were constructed to fit,
and testing
these implications against observation. But this is getting far
ahead of the
3The World Bank no longer transmits data for Taiwan. The
figure 6.5 in the text is from
Harberger (1984, table 1, p. 9).
4According to Heston and Summers (1984), Taiwan's per-capita
GDP growth rate in the 1950s
was 3.6. South Korea's was 1.7 from 1953 to 1960.
6 R.E. Lucas. Jr., On the mechanics of economic development
story I have to tell, which will involve leaving many important
questions open
even at the purely theoretical level and will touch upon
questions of empirical
testing hardly at all.
My plan is as follows. I will begin with an application of a now-
standard
neoclassical model to the study of twentieth century U.S.
growth, closely
following the work of Robert Solow, Edward Denison and many
others. I will
then ask, somewhat unfairly, whether this model as it stands is
an adequate
model of economic development, concluding that it is not. Next,
I will
consider two adaptations of this standard model to include the
effects of
human capital accumulation. The first retains the one-sector
character of the
original model and focuses on the interaction of physical and
human capital
accumulation. The second examines a two-good system that
admits specialized
human capital of different kinds and offers interesting
possibilities for the
interaction of trade and development. Finally, I will turn to a
discussion of
what has been arrived at and of what is yet to be done.
In general, I will be focusing on various aspects of what
economists, using
the term very broadly, call the' technology'. I will be abstracting
altogether
from the economics of demography, taking population growth as
a given
throughout. This is a serious omission, for which I can only
offer the excuse
that a serious discussion of demographic issues would be at
least as difficult as
the issues I will be discussing and I have neither the time nor
the knowledge to
do both. I hope the interactions between these topics are not
such that they
cannot usefully be considered separately, at least in a
preliminary way. 5
I will also be abstracting from all monetary matters, treating all
exchange as
though it involved goods-for-goods. In general, I believe that
the importance
of financial matters is very badly over-stressed in popular and
even much
professional discussion and so am not inclined to be apologetic
for going to
the other extreme. Yet insofar as the development of financial
institutions is a
limiting factor in development more generally conceived I will
be falsifying the
picture, and I have no clear idea as to how badly. But one
cannot theorize
about everything at once. I had better get on with what I do
have to say.
2. Neoclassical growth theory: Review
The example, or model, of a successful theory that I will try to
build on is
the theory of economic growth that Robert Solow and Edward
Denison
developed and applied to twentieth century U.S. experience.
This theory will
serve as a basis for further discussion in three ways: as an
example of the form
that I believe useful aggregative theories must take, as an
opportunity to
5Becker and Barro (1985) is the first attempt known to me to
analyze fertility and capital
accumulation decisions simultaneously within a general
equilibrium framework. Tamura (1986)
contains further results along this line.
R.E. Lucas, Jr., On the mechanics of economic development 7
explain exactly what theories of this form can tell us that other
kinds of
theories cannot, and as a possible theory of economic
development. In this
third capacity, the theory will be seen to fail badly, but also
suggestively.
Following up on these suggestions will occupy the remainder of
the lectures.
Both Solow and Denison were attempting to account for the
main features
of U.S. economic growth, not to provide a theory of economic
development,
and their work was directed at a very different set of
observations from the
cross-country comparisons I cited in my introduction. The most
useful
summary is provided in Denison's 1961 monograph, The
Sources of Economic
Growth in the United States. Unless otherwise mentioned, this
is the source for
the figures I will cite next.
During the 1909-57 period covered in Denison's study, U.S. real
output
grew at an annual rate of 2.9%, employed manhours at 1.3%,
and capital stock
at 2.4%. The remarkable feature of these figures, as compared
to those cited
earlier, is their stability over time. Even if one takes as a
starting point the
trough of the Great Depression (1933) output growth to 1957
averages only
5%. If business-cycle effects are removed in any reasonable way
(say, by using
peak-to-peak growth rates) U.S. output growth is within half a
percentage
point of 3% annually for any sizeable subperiod for which we
have data.
Solow (1956) was able to account for this stability, and also for
some of the
relative magnitudes of these growth rates, with a very simple
but also easily
refineable model. 6 There are many variations of this model in
print. I will set
out a particularly simple one that is chosen also to serve some
later purposes. I
will do so without much comment on its assumed structure:
There is no point
in arguing over a model's assumptions until one is clear on what
questions it
will be used to answer.
We consider a closed economy with competitive markets, with
identical,
rational agents and a constant returns technology. At date t
there are N( t)
persons or, equivalently, manhours devoted to production. The
exogenously
given rate of growth of N( t) is A. Real, per-capita consumption
is a stream
c(t), t ~ 0, of units of a single good. Preferences over (per-
capita) consumption
streams are given by
i
oo
e-pt_l_[c(t)l-o-I]N(t)dt,
o I-a
(1)
6 Solow's 1956 paper stimulated a vast literature in the 1960s,
exploring many variations on the
original one-sector structure. See Burmeister and Dobell (1970)
for an excellent introduction and
survey. By putting a relatively simple version to empirical use,
as I shall shortly do, I do not
intend a negative comment on this body of research. On the
contrary, it is exactly this kind of
theoretical experimentation with alternative assumptions that is
needed to give one the confidence
that working with a particular, simple parameterization may, for
the specific purpose at hand, be
adequate.
8 R.E. Lucas, Jr., On the mechanics of economic development
where the discount rate p and the coefficient of (relative) risk
aversion 0 are
both positive. 7
Production per capita of the one good is divided into
consumption c( t) and
capital accumulation. If we let K(t) denote the total .stock of
cal?ital, and
K(t) its rate of change, then total output is N(t)c(t) + K(t).
[Here K(t) is net
investment and total output N(t)c(t) + K(t) is identified with net
national
product.] Production is assumed to depend on the levels of
capital and labor
inpu ts and on the level A ( t) of the 'technology', according to
(2)
where 0 < f3 < 1 and where the exogenously given rate of
technical change,
A/A, is p. > O.
The resource allocation problem faced by this simple economy
is simply to
choose a time path c( t) for per-capita consumption. Given a
path c(t) and an
initial capital stock K(O), the technology (2) then implies a
time path K( t) for
capital. The paths A(t) and N(t) are given exogenously. One
way to think
abou t this allocation problem is to think of choosing c(t) at
each date, given
the values of K(t), A(t) and N(t) that have been attained by that
date.
Evidently, it will not be optimal to choose c( t) to maximize
current-period
utility, N(t)[1j(1 - o)][c(t) - 1]1-0, for the choice that achieves
this is to set
net investment K(t) equal to zero (or, if feasible, negative): One
needs to set
some value or price on increments to capital. A central
construct in the study
of optimal allocations, allocations that maximize utility (1)
subject to the
technology (2), is the current-value Hamiltonian H defined by
N
H(K, 8, c, t) = -1-[c1- O -1] + 8[AK.8N 1-.8 - Nc],
-0
which is just the sum of current-period utility and [from (2)] the
rate of
increase of capital, the latter valued at the' price' 8( t). An
optimal allocation
must maximize the expression H at each date t, provided the
price O( t) is
correctly chosen.
The first-order condition for maximizing H with respect to c is
(3)
which is to say that goods must be so allocated at each date as
to be equally
valuable, on the margin, used either as consumption or as
investment. It is
7The inverse a -I of the coefficient of risk aversion is
sometimes called the intertemporal
elasticity of substitution. Since all the models considered in this
paper are deterministic, this latter
terminology may be more suitable.
R.E. Lucas, Jr., On the mechanics 0/ economic development
known that the price 8( t) must satisfy
. a
8(t) = p8(t) - aKH(K(t),8(t),c(t), t)
= [p - f3A ( t ) N ( t )1-f3 K ( t ) f3 - 1] 8 ( t ) ,
9
(4)
at each date t if the solution c(t) to (3) is to yield an optimal
path (c(t»~=o.
Now if (3) is used to express c(t) as a function 8(1), and this
function 8- 1/ 0
is substituted in place of c(t) in (2) and (4), these two equations
are a pair of
first-order differential equations in K (t) and its 'price' 8(1).
Solving this
system, there will be a one-parameter family of paths (K (t), 8(
t», satisfying
the given initial condition on K(O). The unique member of this
family that
satisfies the transversality condition:
lim e- pt8(t)K(t) = 0
t-+ 00
(5)
is the optimal path. I am hoping that this application of
Pontryagin's Maxi-
mum Principle, essentially taken from David Cass (1961), is
familiar to most
of you. I will be applying these same ideas repeatedly in what
follows.
For this particular model, with convex preferences and
technology and with
no external effects of any kind, it is also known and not at all
surprising that
the optimal program characterized by (2), (3), (4) and (5) is also
the unique
competitive equilibrium program, provided either that all
trading is consum-
mated in advance, Arrow-Debreu style, or (and this is the
interpretation I
favor) that consumers and firms have rational expectations
about future prices.
In this deterministic context, rational expectations just means
perfect fore-
sight. For my purposes, it is this equilibrium interpretation that
is most
interesting: I intend to use the model as a positive theory of
U.S. economic
growth.
In order to do this, we will need to work out the predictions of
the model in
more detail, which involves solving the differential equation
system so we can
see what the equilibrium time paths look like and compare them
to observa-
tions like Denison's. Rather than carry this analysis through to
completion, I
will work out the properties of a particular solution to the
system and then
just indicate briefly how the rest of the answer can be found in
Cass's paper.
Let us construct from (2), (3) and (4) the system's balanced
growth path: the
particular solution (K(t), 8(1), c(t» such that the rates of growth
of each of
these variables is constant. (I have never been sure exactly what
it is that is
'balanced' along such a path, but we need a term for solutions
with this
constant growth rate property and this is as good as any.) Let K
denote the
rate of growth of per-capita consumption, c(t)jc(t), on a
balanced growth
10 R.E. Lucas, Jr., On the mechanics of economic development
path. Then from (3), we have 8(t)/8(t) = -al(. Then from (4), we
must have
f3A ( t ) N ( t ) 1 - fJ K ( t ) fJ - 1 = P + aI( . (6)
That is, along the balanced path, the marginal product of capital
must equal
the constant value p + al(. With this Cobb-Douglas technology,
the marginal
product of capital is proportional to the average product, so that
dividing (2)
through by K( t) and applying (6) we obtain
N(t)c(t) K(t) =A( )K( )fJ-11t.T( )l- fJ = p+al(
K(t) + K(t) t t iV t 13' (7)
By definition of a balanced path, K(t)/K(t) is constant so (7)
implies that
N( t )c(t)/K( t) is constant or, differentiating, that
K(t) N(t) c(t)
--=--+--=I(+A
K(t) N(t) c(t) .
(8)
Thus per-capita consumption and per-capita capital grow at the
common
rate 1(. To solve for this common rate, differentiate either (6) or
(7) to obtain
p.
1(= --.
1-13
(9)
Then (7) may be solved to obtain the constant, balanced
consumption-capital
ratio N(t)c(t)/K(t) or, which is equivalent and slightly easier to
interpret, the
constant, balanced net savings rate s defined by
K(t) f3(I(+A)
s= =---
N(t)c(t)+K(t) p+al('
(10)
Hence along a balanced path, the rate of growth of per-capita
magnitudes is
simply proportional to the given rate of technical change, p.,
where the
constant of proportionality is the inverse of labor's share, 1 -
13. The rate of
time preference p and the degree of risk aversion a have no
bearing on this
long-run growth rate. Low time preference p and low risk
aversion a induce a
high savings rate s, and high savings is, in turn, associated with
relatively high
output levels on a balanced path. A thrifty society will, in the
long run, be
wealthier than an impatient one, but it will not grow faster.
In order that the balanced path characterized by (9) and (10)
satisfy the
transversality condition (5), it is necessary that p + al( > I( + A.
[From (10), one
sees that this is the same as requiring the savings rate to be less
than capital's
R.E. Lucas, Jr., On the mechanics of economic development 11
share.] Under this condition, an economy that begins on the
balanced path
will find it optimal to stay there. What of economies that begin
off the
balanced path - surely the normal case? Cass showed - and this
is exactly
why the balanced path is interesting to us - that for any initial
capital
K(O) > 0, the optimal capital-consumption path (K(t), c(t» will
converge to
the balanced path asymptotically. That is, the balanced path will
be a good
approximation to any actual path 'most' of the time.
Now given the taste and technology parameters (p, 0, X, f3 and
JL) (9) and
(10) can be solved for the asymptotic growth rate K of capital,
consumption
and real output, and the savings rate s that they imply.
Moreover, it would be
straightforward to calculate numerically the approach to the
balanced path
from any initial capital level K (0). This is the exercise that an
idealized
planner would go through.
Our interest in the model is positive, not normative, so we want
to go in the
opposite direction and try to infer the underlying preferences
and technology
from what we can observe. I will outline this, taking the
balanced path as the
model's prediction for the behavior of the U.S. economy during
the entire
(1909-57) period covered by Denison's study.8 From this point
of view,
Denison's estimates provide a value of 0.013 for X, and two
values, 0.029 and
0.024 for K + X, depending on whether we use output or capital
growth rates
(which the model predicts to be equal). In the tradition of
statistical inference,
let us average to get K + X= 0.027. The theory predicts that 1 -
f3 should
equal labor's share in national income, about 0.75 in the U.S.,
averaging over
the entire 1909-57 period. The savings rate (net investment over
NNP) is
fairly constant at 0.10. Then (9) implies an estimate of 0.0105
for JL. Eq. (10)
implies that the preference parameters p and 0 satisfy
p + (0.014)0 = 0.0675.
(The parameters p and 0 are not separately identified along a
smooth
consumption path, so this is as far as we can go with the sample
averages I
have provided.)
These are the parameter values that give the theoretical model
its best fit to
the U.S. data. How good a fit is it? Either output growth is
underpredicted or
capital growth overpredicted, as remarked earlier (and in the
theory of growth,
a half a percentage point is a large discrepancy). There are
interesting secular
changes in manhours per household that the model assumes
away, and labor's
share is secularly rising (in all growing economies), not
constant as assumed.
There is, in short, much room for improvement, even in
accounting for the
secular changes the model was designed to fit, and indeed, a
fuller review of
8With the parameter values described in this paragraph, the
half-life of the approximate linear
system associated with this model is about eleven years.
12 R.E. Lucas, Jr., On the mechanics of economic development
the literature would reveal interesting progress on these and
many other
fronts. 9 A model as explicit as this one, by the very nakedness
of its simplify-
ing assumptions, invites criticism and suggests refinements to
itself. This is
exactly why we prefer explicitness, or why I think we ought to.
Even granted its limitations, the simple neoclassical model has
made basic
contributions to our thinking about economic growth.
Qualitatively, it empha-
sizes a distinction between 'growth effects' - changes in
parameters that alter
growth rates along balanced paths - and 'level effects' - changes
that raise or
lower balanced growth paths without affecting their slope - that
is fundamen-
tal in thinking about policy changes. Solow's 1956 conclusion
that changes in
savings rates are level effects (which transposes in the present
context to the
conclusion that changes in the discount rate, P, are level
effects) was startling
at the time, and remains widely and very unfortunately
neglected today. The
influential idea that changes in the tax structure that make
savings more
attractive can have large, sustained effects on an economy's
growth rate
sounds so reasonable, and it may even be true, but it is a clear
implication of
the theory we have that it is not.
Even sophisticated discussions of economic growth can often be
confusing
as to what are thought to be level effects and what growth
effects. Thus
Krueger (1983) and Harberger (1984), in their recent, very
useful surveys of
the growth experiences of poor countries, both identify
inefficient barriers to
trade as a limitation on growth, and their removal as a key
explanation of
several rapid growth episodes. The facts Krueger and Harberger
summarize
are not in dispute, but under the neoclassical model just
reviewed one would
not expect the removal of inefficient trade barriers to induce
sustained
increases in growth rates. Removal of trade barriers is, on this
theory, a level
effect, analogous to the one-time shifting upward in production
possibilities,
and not a growth effect. Of course, level effects can be drawn
out through time
through adjustment costs of various kinds, but not so as to
produce increases
in growth rates that are both large and sustained. Thus the
removal of an
inefficiency that reduced output by five percent (an enormous
effect) spread
out over ten years in simply a one-half of one percent annual
growth rate
stimulus. Inefficiencies are important and their removal
certainly desirable, but
the familiar ones are level effects, not growth effects. (This is
exactly why it is
not paradoxical that centrally planned economies, with
allocative inefficiencies
of legendary proportions, grow about as fast as market
economies.) The
empirical connections between trade policies and economic
growth that
9In particular, there is much evidence that capital stock growth,
as measured by Denison,
understates true capital growth due to the failure to correct
price deflators for quality improve-
ments. See, for example, Griliches and Jorgenson (1967) or
Gordon (1971). These errors may well
account for all of the 0.005 discrepancy noted in the text (or
more!).
Boxall (1986) develops a modification of the Solow-Cass model
in which labor supply is
variable, and which has the potential (at least) to account for
long-run changes in manhours.
R. E. Lucas, Jr., On the mechanics of economic development 13
Krueger and Harberger document are of evident importance, but
they seem to
me to pose a real paradox to the neoclassical theory we have,
not a confirma-
tion of it.
The main contributions of the neoclassical framework, far more
important
than its contributions to the clarity of purely qualitative
discussions, stem
from its ability to quantify the effects of various influences on
growth.
Denison's monograph lists dozens of policy changes, some
fanciful and many
others seriously proposed at the time he wrote, associating with
each of them
rough upper bounds on their likely effects on U.S. growth. 1o In
the main, the
theory adds little to what common sense would tell us about the
direction of
each effect - it is easy enough to guess which changes stimulate
production,
hence savings, and hence (at least …
The Lahore Journal of Economics
13 : 1 (Summer 2008): pp. 1-27
16
Qaisar Abbas and James Foreman-Peck Human Capital and
Economic Growth: Pakistan, 1960-2003
15Human Capital and Economic Growth:
Pakistan, 1960-2003
Qaisar Abbas*, James Foreman-Peck**Abstract
This paper investigates the relationship between human capital
and economic growth in Pakistan with aggregate time series
data. Estimated with the Johansen (1991) approach, the fitted
model indicates a critical role for human capital in boosting the
economy’s capacity to absorb world technical progress. Much
higher returns, including spillovers, to secondary schooling in
Pakistan than in OECD economies is consistent with very
substantial education under-investment in Pakistan. Similarly,
extremely large returns to health spending compare very
favorably with industrial investment. Human capital is
estimated to have accounted for just under one-fifth of the
increase in Pakistan’s GDP per head. Since the 1990s, the
impact of deficient human capital policies is shown by the
negative contribution to economic growth.
JEL Classification: C13, C22, C51, O15, O53
Keywords:Human Capital, Economic Growth, Cointegration,
Pakistan
1. Introduction
Human capital plays a key role in both neoclassical and
endogenous growth models (Mankiw, Romer and Weil, 1992;
Rebelo, 1991; Sianesi and Van Reenen, 2003). The critical
difference is that in the first group, economic growth is
ultimately driven by exogenous technical progress. Diminishing
returns to accumulated factors, including human capital,
eventually halt growth in a neoclassical model, in the absence
of intervention from outside influences. Policy changes can
raise the level of productivity but not the long run growth rate.
Endogenous growth models, on the other hand, need no
additional explanation, for human capital investment propels
knowledge creation without diminishing returns. A permanent
alteration in some policy variable can cause a permanent change
in an economy’s growth rate.
Unlike time series evidence for the United States, at first sight
the data for many developing economies could be broadly
consistent with this prediction (Jones, 1995). Since political
independence for these countries after 1945 was accompanied
by major policy changes, the shifts could be responsible for
accelerated growth after this date in an endogenous growth
model
.
However, Parente and Prescott (1999, 2000) point out that the
technical progress in an extended neoclassical model can alter
in response to policy as well. Individual choices determine the
pace of productivity increase, when time is diverted from
normal work to activities that improve technology. These
activities can draw on the world stock of knowledge and borrow
capital on world markets. Policy-induced constraints, such as
taxation, international capital controls, or entry barriers to
industries, create disincentives to do so. They give rise to
international differences in levels and growth of aggregate
productivity, even when the stock of useful knowledge is
potentially common to all countries.
For economies behind the world technological frontier,
productivity growth is likely to depend critically upon the
spread and absorption of technology, rather than upon the
generation of new knowledge (Nelson and Phelps, 1966;
Benhabib and Spiegel, 2002). Absorptive capacity depends on
national institutions and policies; openness to foreign direct
investment, regulation of intellectual property rights, and
exchange rate regimes affect a follower economy’s imports of
technology, as well as the generation of new useful knowledge
(Shapiro, 2005). But the stock of skills, and the education and
training that create them, is likely to be vital to utilizing foreign
know-how, in addition to functioning as a conventional factor
of production (Saggi, 2002).
Human capital is not restricted to knowledge. Health has been
found to be a positive and significant contributor to economic
growth in many empirical cross-country models (Bloom and
Canning 2000, 2003). Measured simply as life expectancy,
health human capital can effect economic growth in several
ways. As people live longer, they may save more for old age.
Life expectancy can also serve as proxy for the heath status of
the whole population, because declines in mortality rates are
related to falls in morbidity. Important as this form of human
capital may be, it will not contribute to technology transfer, in
contrast to education and training.
Despite the theoretical significance of knowledge human
capital, the empirical evidence from cross-country studies is
very mixed. Pungo (1996) showed that the Mankiw et al. (1992)
(MRW) human capital-augmented neoclassical specification
exhibits structural breaks, such that the coefficient on human
capital is insignificant for a sample of labor-abundant countries
and if influential observations are excluded. A possible reason
for these last results is that schooling in developing economies
tends to be of low and very variable quality
. In Pakistan, the largest learning gaps are between primary
schools. The divergence in English test scores between
government and private schools is 12 times that between
children from rich and poor families (Das, Pandey and Zajonc,
2006).
Another possible contributor to the lack of impact evidence for
knowledge capital is the central contribution of the state in
schooling. Variations in the effectiveness and magnitude of
state schooling spending, together with the way in which taxes
are levied to pay for it, can even create a negative correlation
with economic growth (Blankenau and Simpson, 2004). Public
spending might crowd out private spending on education.
Moreover, in the short-term, increasing the proportion of the
potential workforce in full time education reduces the
workforce and may be expected to lower per capita output. Not
surprisingly then, the macroeconomic evidence is unclear about
the effects of public education expenditures on economic
growth.
National economies are likely to be especially diverse in the
supply and demand for human capital because of distinctive
institutions. Yet most empirical research has been concerned
with cross-sections or panels of large numbers of countries,
thereby ignoring economy-level institutional differences
. National time series studies offer a way of eliminating or
reducing such heterogeneity (Durlauf, Johnson and Temple,
2004). For this reason the present paper tests and estimates a
time series model of human capital and economic growth for
Pakistan over the period 1960-2003. As a low income economy
that has invested relatively little in human capital over the past
40 years, Pakistan is an especially helpful case for
understanding the relationship with economic growth (Husain,
Qasim and Sheikh, 2003)
.
Most econometric research on human capital in Pakistan has
entailed estimating Mincer (1974) earnings functions on micro
data. Nasir and Nazli (2001) find each year of education brings
approximately 7 percent (private gross) return for wage earners.
Another study by Haroon et al. (2003) estimated that the
maximum private gross return (16 percent) is associated with
higher secondary education. Their results also indicate that
private payoffs from primary education declined during the
previous decade, while returns to higher secondary and tertiary
education rose. Recent research on rural Pakistan by Behrman et
al. (2008) shows that ‘social’ and private rates of return to low
quality primary schooling versus no schooling were 18.2
percent and 20.5 percent respectively
. They also estimated that ‘social’ rates of return to high-quality
versus low-quality primary schooling in rural Pakistan were
13.0 percent. Unfortunately, studies of this type are unlikely to
capture all indirect benefits of human capital for economic
growth, especially the stimulus to technology development and
adoption. Therefore, there is a strong case for supplementing
them with macroeconomic studies of rates of return, as
attempted here.
The paper models the impact of human capital on Pakistani
economic growth, provides estimates of social rates of return to
human capital in Pakistan, and assesses the policy implications
of the findings. Section I presents the theoretical framework of
the study, setting out the production function and rate of return
approach. Section II outlines the experience of human capital
investment and development of Pakistan since 1960, with some
international comparisons. Section III elaborates the
measurement of variables and estimation procedures, explaining
why the Johansen approach is necessary. Section IV presents the
empirical results and section V discusses the sources of growth
implied by the analysis of the preceding section.
2. Theoretical Framework
One reason for endogenous growth (in Rebelo, 1991) is that
human capital is embodied in labor. This implies that a worker’s
improved human capital boosts their productivity but cannot
benefit another worker in the same way. The total amount of
human capital, H, in an economy is the product of the number of
workers and their average embodied human capital. If L is
number of workers, the total human capital input is the flow of
services from L(H/L) = H. More workers without any human
capital add nothing to output, so a growing workforce in itself
will drive down output per head at the rate at which it grows.
Constant returns to all three factors are equivalent to constant
returns to human and physical capital alone.
It follows that with constant returns, increased investment in
human and physical capital induced by more benign policies,
can permanently raise the growth rate of an economy. The
steady state growth of output and the two types of capital are
obtained by substituting both savings/investment rates into the
production function. Ignoring depreciation, if savings and
investment in human and physical capital increase from 5 to 10
percent of output, the steady state growth of output and capital
rises from 5 to 10 percent. The ratio of human to physical
capital in the steady state will not change because their relative
accumulation rates are unaltered.
Human capital in a neoclassical model has less dramatic but
still fundamental effects. A human capital-augmented Cobb-
Douglas production function consistent with the estimates of
MRW has coefficients of one-third on each of the three factor
inputs; a one percent increase in both human and physical
capital increases output by only two thirds of a percent.
Accumulation at a constant proportion of output therefore adds
less and less to output until the steady state is reached, in the
absence of technical progress. Hence the neoclassical model
must include exogenous technical progress if it is to explain
economic growth in the long run.
The disembodied human capital of MRW (equation 8) implies
that a one percent increase in the work force has a greater
positive effect on output than a one percent rise in human
capital per worker. With H unchanged, greater L boosts output
even though H/L falls. Where Y is real output, A the technology
level that shifts exogenously, K physical capital and 0<α, β, γ0
<1 parameters, the neoclassical (Cobb-Douglas) production
function is:
Y = A K( L( H
0
g
= A K( L(+
0
g
(H/L)
0
g
(1)
For Pakistan, and many developing countries with high
population and workforce growth, this disembodied model is
more optimistic than an endogenous growth Cobb-Douglas
production function specification, discussed above, of:
Y = A K( H
0
g
= A K( (L (H/L))
0
g
(2)
In a low income open economy, technology transfer is likely to
be a major source of growth. The scope for transfer will depend
on the technological progress of the leaders in the world
economy, below assumed to advance at a rate given by the
technological frontier economy’s Total Factor Productivity
index (F). But technology can only be transferred if an economy
has the absorptive capacity.
Benhabib and Spiegel (1994) conclude that international
technology spillover rates depend on levels of education in the
follower countries. So a plausible formulation for a poorer
economy allows greater technical progress the higher is the
human capital that promotes this capacity. The gap between the
follower economy’s technology (A) and the leader’s (F) depends
upon the follower’s average human capital and the level of the
leader’s technology. Taking logs:
ln A- ln F = (γ1ln(H/L)-1)lnF + lnA0
(3)
Technical progress, F, is exogenous (neoclassical) to the
domestic economy, but the impact of the technology is
endogenous. Substituting (3) into the log of (1) shows that there
is a complete offset to the rising human capital elasticity with
world technical progress; the labor elasticity of output falls as
the world technological frontier extends.
LnY = lnA0 + (γ0 +γ1 lnF)lnH + α ln K + (β- γ0- γ1 lnF) lnL
(4)
With the endogenous growth production function, β=0, and the
labor output elasticity is the same as the human capital output
elasticity. An economy with high workforce growth and weak
human capital investment will increasingly miss out as the
world technology frontier advances. If L actually grows faster
than H, output growth on this account is progressively negative.
When, as in (4), human capital supports the absorption of world
technology, as well as being a factor of production, the excess
of social over private returns may be substantial. Regardless, in
a relatively poor economy the returns to factor inputs, including
human capital, should be high because of their scarcity.
Unfortunately poor quality schooling and an inappropriate
syllabus may lower the return to education as a social
investment, but as Behrman et al (2008) have shown, even these
returns can be high in Pakistan. However, if education is merely
a signal, rather than an investment in human capital, private
returns may be high although social returns could be low. For
this reason, and because of the technological spillover, macro
estimation of social rates of return provides information not
available from the more common micro studies.
With the production function assumed in the present model,
rates of return to human capital per worker, as measured by the
marginal product, are higher the lower is an economy’s ratio of
human capital per worker to output. The full return to human
capital includes the technology absorption component γ1ln F/
((H/Y).
(∂Y/∂H) = ((0+γ1ln F)/ ((H/Y)
When economic development raises the ratio of human capital
to output, the rate of return will be driven down. But if world
technical progress, F, is faster than the rise in the human capital
output ratio, returns will rise.
Whether optimal investment in human capital is achieved might
be inferred from the principle that in an efficiently functioning
economy, at the margin returns to human and physical assets
will be equalized. With human assets, the inability to
appropriate returns often deters optimal investment, and thereby
allows persistent higher marginal returns, in the absence of
adequate investment by non-profit institutions. If the return on
comparable alternative physical assets, or on comparable human
capital in other economies is known, the measure of
underinvestment, the (excess) marginal rate of return on human
capital, can be found from the human capital stock to output
ratio and ((0+γ1ln F).
3. The Pakistani Economy Since 1960
Consistent with the endogenous growth model, in conjunction
with a broad policy or environmental shift, Pakistan’s economy
experienced an apparent permanent increase in the growth rate
by the 1960s. Pakistan’s average annual real GDP growth rate
of 5.3 percent since then has not matched those of the East
Asian miracle countries. Yet, per capita GDP growth surpassed
that of the typical developing country (1.3 percent since the
1960s) with an annual average rate of 2.6 percent.
Three groups of Asian countries, now classified as East Asian
rapid growers, South Asian developing and Asian least
developed, in many respects were at a broadly similar level of
economic development in 1960. But by the end of the
millennium, there were wide gaps in their per capita incomes.
Their human capital endowments, both in terms of education
and health, also were hugely different.
In the early 1960s, Pakistan was seen around the world as a
model of economic development. Many countries sought to
emulate Pakistan’s economic planning strategy and one of them,
South Korea, copied its second Five Year Plan, 1960-65. In the
early 1960s, the per capita income of South Korea was less than
double that of Pakistan (Maddison, 2001). But South Korea
became by far the more developed, with GNI per capita in 2006
of $22990 compared with Pakistan’s $2410, using purchasing
power parity (World Bank, 2007).
A possible reason for the divergence, consistent with the
fundamental contribution of human capital, is that literacy rates
for East Asian developing countries in the early 1960s were as
high as 71 percent for the Republic of Korea, and 68 percent for
Thailand, while Malaysia achieved a rate of over 50 percent. On
the other hand, in all other Asian least developed countries and
South Asian developing countries, the literacy rate was low;
only 9 percent for Nepal and 16 percent for Pakistan (Table 1).
After three decades, during which this group of Asian countries
somewhat improved their human capital, literacy rates are still
below 50 percent. By contrast, literacy in South Korea reached
98 percent and Malaysia managed a rate of about 90 percent
(World Bank, 1982; UNESCO, 1999).
Table-1: Human Capital Measures for Pakistan, 1960-2005
Years Indicator
1960
1965
1970
1975
1980
1985
1990
1995
2000
2005
Primary Schooling Enrollment (% of Age Group)
20.4
27.4
30.3
38.2
32.1
35.8
47.5
57.3
60.5
68.1
Secondary Schooling Enrollment (% of Age Group)
3.4
4.6
5.7
7.0
6.4
7.3
9.6
12.2
11.6
12.0
Literacy Rate
16.7
16.8
20.9
24.3
26.1
28.8
33.8
39.6
47.1
52.5
Public Spending on Education (% of GDP)
0.9
1.8
2.5
2.2
2.0
2.7
2.7
2.2
2.0
2.5
Public spending on health (% of GDP)
0.4
0.6
0.5
0.6
0.6
0.8
1.0
0.7
0.7
0.6
Life Expectancy
43.9
46.7
49.4
52.3
55.1
57.4
59.1
60.9
63.0
66.0
Source: State Bank of Pakistan (2006), UNESCO Yearbooks
(Various Issues), World Bank (Various Issues).
Another potential contributor to the divergence is health.
Measured by life expectancy at birth across the three groups of
countries in the Asian region, health shows a similar pattern to
literacy. In the 1960s, life expectancy at birth was below 45
years in all Asian least developed countries and South Asian
developing countries. On the other hand, the East Asian
developing countries had life expectancies well over 50 years,
with the Republic of Korea achieving a figure of over 54 years,
followed by the 53 years of Malaysia and 51 years for Thailand
(World Bank, 1984). In the late 1990s, the Asian least
developed countries and South Asian developing countries
enhanced their life expectancy to more than 60 years, at least in
the case of Pakistan, India, Bangladesh and Bhutan. Yet the life
expectancy rate in both Malaysia and Korea is remains much
higher; of the order of more than 72 years, with Thailand
reaching a figure of 69 years.
Nonetheless human capital has grown in Pakistan. Table-1
shows that primary and secondary schooling enrolment in
Pakistan increased substantially in the years after 1960.
However public spending on education as a proportion of GDP
stopped rising on trend after 1970, while public spending on
health peaked as a proportion of GDP in 1990. Human capital
per head, as measured by the secondary schooling stock per
worker (lnsstpw, Figure-1), increased strongly in the 1960s and
in the second half of the 1980s. During the later 1990s the stock
fell; the endogenous growth model of the previous section
predicts adverse output consequences, for in 2005 the stock was
lower than in 1995.
Schooling, particularly in rural areas, remained problematic
despite land and other reforms during the 1960s. In 1962, four
tiers of government were introduced and each was assigned
responsibilities in both rural and urban areas, such as
maintenance of primary schools, public roads, and bridges.
Much military and economic aid was received and the capital-
labor ratio (lnkspw, figure 1) rose most rapidly in this decade.
But aid was reduced in 1965, when another war with India over
Kashmir broke out. Later the Tashkent agreement of 1966
mediated the conflict. The longer term impact of the war on the
economy though was severe, ultimately triggering a downturn in
real GDP per worker (lnrgdppw) and the employed labor force
(lnelf) between 1967 and 1968 (figure 1).
The 1970s were a difficult decade for some forms of human
capital accumulation and economic growth. A third war between
India and Pakistan in 1971, the upheaval associated with the
establishment of Bangladesh in January 1972, the first oil crisis
in 1974 and the populist and restrictive economic policies of
new political regime of 1971-77, all adversely affected the
economy. After 1973, Prime Minister Zulfikar Bhutto
nationalized basic industries, insurance companies,
domestically-owned banks, and schools and colleges. The
proportion of the workforce with secondary schooling fell in the
first half of the decade. Table 1 shows that school enrolments as
a proportion of the relevant age group were lower in 1980 than
in 1975 and figure 1 reveals a stagnation of the secondary
schooling stock per worker (lnsstpw) in the 1970s.
Some incomplete structural reform efforts were implemented in
the 1990s. Output and employment fell between 1990 and 1991
but recovered the following year. The second half of the decade
was marked by economic uncertainty associated with heightened
domestic and regional political tensions. The 1998 nuclear
explosions and consequent sanctions, coupled with drought and
unsustainable debt, gave rise to macroeconomic instability.
Interest payments and military spending by the government
exceeded 50 percent of consolidated government spending,
shrinking the relative size of public sector development
spending, and leaving only limited resources for state-funded
education, health and physical infrastructure. External balances
deteriorated significantly and foreign reserves fell to
dangerously low levels (World Bank, 2002). Health spending as
a proportion of GDP (lnhegdp, figure 1) declined. According to
the model of the previous section, returns to human capital
should be very high because investment has been so low. But
resource misallocation could hold down returns in practice.
Figure-1: Pakistani Growth Variables 1960-2005 (Logarithmic)
7.6
7.8
8.0
8.2
8.4
8.6
8.8
9.0
60
65
70
75
80
85
90
95
00
05
LNRGDPPW
6.5
7.0
7.5
8.0
8.5
9.0
9.5
60
65
70
75
80
85
90
95
00
05
LNKSPW1
2.4
2.6
2.8
3.0
3.2
3.4
3.6
3.8
60
65
70
75
80
85
90
95
00
05
LNELF
-3.5
-3.0
-2.5
-2.0
-1.5
-1.0
60
65
70
75
80
85
90
95
00
05
LNSSTPW
-1.2
-1.0
-0.8
-0.6
-0.4
-0.2
0.0
0.2
60
65
70
75
80
85
90
95
00
05
LNHEGDP
-16
-14
-12
-10
-8
-6
-4
60
65
70
75
80
85
90
95
00
05
SSMFP
7.6
7.8
8.0
8.2
8.4
8.6
8.8
9.0
60657075808590950005
LNRGDPPW
6.5
7.0
7.5
8.0
8.5
9.0
9.5
60657075808590950005
LNKSPW1
2.4
2.6
2.8
3.0
3.2
3.4
3.6
3.8
60657075808590950005
LNELF
-3.5
-3.0
-2.5
-2.0
-1.5
-1.0
60657075808590950005
LNSSTPW
-1.2
-1.0
-0.8
-0.6
-0.4
-0.2
0.0
0.2
60657075808590950005
LNHEGDP
-16
-14
-12
-10
-8
-6
-4
60657075808590950005
SSMFP
Since 1999, the government committed itself to reversing
Pakistan’s poor economic performance with a major
macroeconomic stabilization effort and structural reforms aimed
at strengthening microeconomic fundamentals. Employment
(lnelf) growth faltered between 1999 and 2000 but quickly
resumed. Real output (lnrgdppw) fell for two consecutive years
but in 2002 jumped to a previously unattained height (figure 1).
Fiscal measures included the privatization of state-owned banks
and strengthening the role of State Bank of Pakistan, together
with reform of telecoms and trade policy. Expansion of the U.S.
and E.U. textile quotas further helped to stabilize and revive the
economy. Economic growth exceeded the 5 percent mark in
2003 for the first time since the mid 1990s, and reached 6
percent in 2004 (World Bank, 2006).
In the modeling below we assess what difference these changes
have made.
4. Measurement, Specification and Estimation
Assessing how policy shifts influenced the formation of
knowledge human capital first requires definition and
measurement. Only proxies, such as the number of graduates,
average years of education, literacy rates, school enrolment
ratios or proportion of the population that has completed
schooling at different levels of education, are available. They
do not fully match the concept of knowledge capital.
The production function model postulates a flow of productive
services from the human capital stock. More output is generated
by an increase in the human capital, so long as the service flow
is proportional to the stock. The increase in the stock is gross
investment minus depreciation. So for example, considering the
stock of workers with secondary education, more secondary
educated young people may enter the workforce every year, but
both secondary educated and uneducated people leave each year
as well. It is the difference between these two magnitudes that
is relevant for economic growth, though for the level of gross
income, simply the flow generated by the stock of secondary
educated workers is pertinent.
When considering year to year variations in human capital,
these measurement issues matter particularly. In the case of an
increase in the proportion of the relevant age group attending
school from one year to the next, while the eventual effect may
be to increase human capital services, the immediate effect is to
reduce the supply of unskilled labor. If they would have been
productive, this will have a negative impact on output, even
though eventually there will be a greater positive effect.
Given the limited availability of the data, the proxies for human
capital here considered are as follows.
· The stock of human capital at the secondary level of education
is defined as the percentage of the workforce that has completed
secondary education (H). Estimates are constructed from
benchmark figures based on Barro and Lee (2000). Following
the perpetual inventory method, net flows of graduates with
secondary education are added to benchmark stocks to generate
an annual series.
· Health expenditure as a percentage of GDP is the measure of
health capital services (HE).
The U.S. (Bureau of Labor Statistics, 2007) multi-factor
productivity index is taken to measure the shift in the world
technological frontier. Data are annual and cover the period
1960-2003. Sources of data and a description of variables are
given in the appendix.
The demand for human capital is derived from the production
function and profit-maximizing behavior, but the supply of
human capital is typically dominated by non-profit
organizations, especially the state. With forward-looking
behavior, the supply of human capital might be expected to
respond to future demands (derived from GDP), as well as GDP
depending upon human capital. Although interest centers on
measuring the contribution of inputs to output, output may have
a causal effect on inputs as well. For example, output growth
may stimulate investments in physical capital and may also
augment human capital by facilitating increased schooling and
income (see for example Bils and Klenow (2000)). This bi-
directional causality creates a correlation between the
independent variables and the equation error term that renders
OLS estimates of the production function coefficients
inconsistent, an important reason for using the Johansen
approach below.
The parameters of the production function measure a long run
relationship, and the time series from which the function is to
be estimated are likely to be non-stationary. Regression models
using such series may give rise to ‘spurious regressions’, even
when the series are integrated of the same order. A necessary
condition for a regression estimate to be a genuine economic
relationship is that the variables are cointegrated, in which case
the residuals will be stationary.
Parameter estimates of a cointegrating equation are
‘superconsistent’; the distributions are asymptotically invariant
to measurement error and simultaneous equation bias. However
they may be also subject to small sample bias and have non-
standard distributions. This last characteristic means the usual
tests of significance do not apply. Moreover there are possibly a
number of different cointegrating relations among a group of
cointegrated variables. For reasons already stated, all the inputs
into the production function can be endogenous, in which case
there may be a cointegrating equation and an error correction
model for each input, in addition to the production function.
For such circumstances, Johansen (1991, 1995) proposed a
maximum likelihood method for estimating and testing for the
number of cointegrating equations, as well as their speeds of
adjustments. The approach is to test the restrictions imposed by
cointegration on the Vector Error Correction model involving
all the series under consideration. In this system, the dependent
column vector is the first difference of output and all the inputs
of the production function (∆Zt). On the right hand side is the
column vector of these variables lagged (here we consider only
one lag, ∆Zt-1) and the associated coefficients (Γ). Also there is
a column vector of the lagged levels of the production function
variables (Zt-1). Matrices of adjustment coefficients (a) and of
cointegrating coefficients (b) premultiply this vector. The
standard errors of the coefficients in the cointegrating equations
of the Johansen method have conventional distributions and so
may be used for the usual significance tests.
With a one period lag the system is:
∆Zt = Γ∆Zt-1 + abZt-1+ et
where et is a vector of error terms.
5. Empirical Results
The elements of the Z vector are obtained from (4) in section I,
modified to include two human capital variables, secondary
education (H) and health spending (HE):
Y/L = A0 F
)
/
ln(
1
L
H
g
(K/L)( L
1
0
-
+
+
g
b
a
(H/L)
0
g
(HE/Y) φ
(5)
The production function (5a) shows how the parameters of (5)
are related to the output elasticities:
LnY = lnA0 + ((γ0 +γ1 lnF)/(1+ φ))lnH + (α/(1+ φ))ln K + ((β-
γ0- γ1 lnF)/(1+ φ)) lnL + (φ /(1+ φ)) ln HE
(5a)
When γ1>0, the growth of the technological frontier F increases
the human capital elasticity, but reduces the labor elasticity, of
output. The education human capital measure influences
absorptive capacity, and therefore interacts with the
technological frontier. The health human capital variable only
affects productivity directly.
Testing for Unit Roots
The degree of integration of each series in (5) is determined
with Augmented Dickey Fuller (ADF) tests statistics, reported
in table 2. Trend and additional lags were included when they
were statistically significant. The ADFs show that all the
variables considered are integrated of order one at the one
percent level except Lnsstpw, which is significant at the 5%
level. We cannot reject the hypotheses that all the variables are
stationary in the first difference, and integrated of order I(1). So
the series may be used to estimate co-integration regressions.
Co-Integrating Equations
The next stage is the estimation of the long-run relationship.
The lag length for the Johnansen VAR is chosen to maximise
the AIC. With one lag on the first differenced variables, AIC is
-21.3 and with two lags it is -22.4. With increased lag length
the AIC becomes smaller, indicating that one lag is the
preferred specification.
The cointegrating model specification that fits the data and the
theoretical constraints is one with a linear deterministic trend in
the data, and an intercept, but no trend in the cointegrating
equation(s). The trace and max-eigen tests for numbers of
cointegrating vectors reject the hypothesis of none, but not at
most one (Table 3). So the data are consistent with one
cointegrating vector.
Table-2: Augmented Dickey Fuller (ADF) Tests
Variable
Model
Adf Stat
Lags
Levels
Lnrgdppw
C and tr
-0.766
2
Lnkspw
C and tr
-2.137
2
Lnsstpw
C no tr
-1.801
1
Ssmfp
C and tr
-3.460
2
Lnhegdp
C no tr
-2.213
1
Lnelf
C and tr
-4.02
1
First Differences
Lnrgdppw
C and tr
-4.634
1
Lnkspw
C no tr
-3.968
2
Lnsstpw
C and tr
-3.823
2
Ssmfp
C and tr
-4.083
2
Lnhegdp
C no tr
-5.157
1
Lnelf
C no tr
-6.048
1
Lnrgdppw: Log of real GDP per worker, ln (Y/L)
Lnkspw:
Log of real capital stock per worker, ln(K/L)
Lnelf:
Log of employed labor force, ln L
Lnsstpw:
Log of human capital stock at the secondary level of
education per worker, ln(H/L)
Lnhegdp:
Log of government expenditure on health as
percentage of GDP, ln(HE/Y)
Ssmfp:
ln(H/L)*lnF (where F is U.S. multifactor productivity)
C:
Constant
tr:
Time trend
Table-3: Unrestricted Cointegration Rank Test
Sample: 1960 2005
Included observations: 42
Test assumption: Linear deterministic trend in the data
Series: LNRGDPPW LNKSPW1 LNSSTPW LNHEGDP SSMFP
LNELF
Lags interval: 1 to 1
Hypothesized
No. of CE(s)
Eigenvalue
Trace Statistic
5 Percent
Critical Value
Max-Eigen
Statistic
5 Percent
Critical Value
None **
0.658140
104.1756
94.15
45.08086
40.07757
At most 1
0.471896
59.09474
68.52
26.81542
33.87687
** denotes rejection of the hypothesis at the 0.05 level by both
Trace and Max-Eigen Statistics.
The normalized cointegrating vector (equation 6) is
theoretically consistent with an aggregate production function
including human capital, although the coefficient on physical
capital/labor ratio is small, and on the margins of statistical
significance. The other coefficients are more than three times
their standard errors (in parentheses).
ln (Y/L) = 0.175 ln(K/L) + 0.310 ln (HE/Y) + (0.447 ln MFP -
1.767) ln(H/L)
(0.092) (0.038)
(0.110) (0.498)
+ 0.357 ln L - 6.226
(6)
(0.095)
Log likelihood
518.3626
The adjustment coefficients, (a), of the right hand side variables
of (6) are not significantly different from zero (not reported),
consistent with these variables being weakly exogenous.
Advances of the world technological frontier (F), measured by
the coefficient (γ1) (on Ssmfp or ln (H/L)lnMFP in equation 6),
raise the output elasticity of secondary schooling human capital
variable from 0.08 in 1960 to 0.25 in 2005
. Health expenditure has an elasticity (φ) of 0.24 and the capital
elasticity (() is 0.13. The total human and physical capital
elasticity of 0.62 is therefore well below unity in 2005. The
labor elasticity is large, at 0.82 in 1960, falling to 0.65 in 2005
. Adding all the input elasticities implies increasing returns to
scale for all factors together throughout the period.
Implied Rates of Return
The return to educated workers in 2005 can be compared with
that discussed by Bassanini and Scarpetta (2001) and by Sianesi
and Van Reenen (2003); that is, increasing average education in
the population by one year raises output per head by between 3
and 6 percent, and returns are higher for LDCs than for OECD
economies. To do so, it is necessary to assume that a rise in the
proportion of the workforce having attained a certain level of
education can be directly translated into an increase in the
average number of years of education in the workforce. Since
there is no control for primary education in the model, the
secondary education impact must be assumed to include years of
primary education as well, that is, a total of ten years of
education. For the comparison, the 2005 value of the proportion
of the workforce with secondary education of 0.195 is
considered. One extra year of education for the whole workforce
translates into 10 years of education for one tenth of the
workforce. Ten percent amounts to a (10/19.5 =) 0.513 increase
in the workforce with secondary education. With an elasticity of
0.25, a 51.3 percent increase in the workforce with secondary
education raises output per head by nearly 13 percent. This falls
well outside the Sianesi and Van Reenan range for the OECD,
indicating substantial under-investment in education in
Pakistan.
To compare with returns to primary education excluding
spillovers reported earlier, secondary education must be
assigned a financial cost. From section 1, (∂Y/∂H) = ((0+γ1ln
F)/ ((H/Y), and ((0+γ1ln F) has been estimated at 0.25 for 2005.
If the secondary education financial returns, including
spillovers, are equal to the Behrman et al (2008) estimated
returns to poor quality primary education (20 percent), the
secondary educated human capital stock to income ratio in 2005
was (0.25/0.2=) 1.25.
Turning to the second human capital measure, a rate of return
from health investment may be obtained directly. Total health
spending can be considered as the flow of services from a health
human capital stock. A health investment ratio (0.6%) in the
year 2005 (Table 1), and the coefficient of (0.31/1.31=) 0.24
implies an even higher return than for education, of
(0.24*0.006-1 =) 39 percent
. As with secondary education, this not only constitutes a very
high return to an investment judged by commercial standards,
but also indicates an enormous unmet requirement for health
spending.
6. Sources of Growth
Proximate sources of Pakistani economic growth can be
obtained from a decomposition of the production function (6).
Table 4 gives the decadal average annual growth rates of inputs
and output. The variation between decades has already been
noted, but the decline in human capital inputs in more recent
decades is very obvious in the table and remarkable. Both health
and schooling input growth rates become negative from the
1990s, and, as a consequence, so to does the absorption of
technology variable (technology frontier shift*human capital).
Yet the foreign (U.S.) technology frontier shifted faster, and
therefore the possibilities for absorption were greater, in most
recent years.
Table-4: Pakistani Economic Growth Data 1961-2005
Actual Annual Average Growth Rates
Real GDP / Worker
Real Capital / Worker
Secondary Schooling Stock / Worker
Health Expenditure / GDP
Technology Frontier Shift* Human Capital
Labour Force
Tech Frontier
1961-70
3.73
7.42
7.79
2.19
17.15
2.61
1.53
1971-80
2.29
2.97
0.88
3.08
2.45
2.42
0.62
1981-1990
2.63
3.09
5.82
1.91
14.93
1.95
0.57
1991-2000
0.76
1.89
-0.52
-1.79
-4.08
2.19
0.87
2001-5
-0.38
-3.24
-4.16
2.36
1.65
The following growth attribution (Table-5) is derived from the
production function estimate, equation 3.
Table-5: Human Capital and Pakistani Economic Growth 1961-
2000
Actual / Worker Real GDP Annual Average Percentage Growth
Model Predicted
Model Predicted due to Human Capital
1961-2003
2.73
2.34
0.41
1961-70
3.73
3.42
0.57
1971-80
2.29
2.32
0.74
1981-1990
2.63
3.53
2.13
1991-2000
0.76
0.12
-1.12
The results in Table 5 indicate that, over the whole period 1961-
2003, just under one-fifth (0.41/2.34) of (predicted) growth in
output per worker was due to human capital as measured here.
Human capital has been responsible for more economic growth
in successive decades from the 1970s until the 1990s. The 1980s
appears to have experienced the strongest impact of human
capital, accounting for 60 percent of predicted economic
growth. Most extraordinary for a developing country is the
massive negative contribution of human capital to growth in
recent years, because of falling inputs
.
Strong growth during the 1960s was largely due to Pakistan’s
capital accumulation. During the 1980s, economic growth was
almost as high, but based on a greater human capital
contribution. Later, economic mismanagement in general and
fiscally imprudent economic policies in particular, caused a
large increase in the country's public debt and reduced the input
of human capital, leading to slower growth in the 1990s. No
clearer indication of underinvestment in human capital can be
found than the evidence of this decade.
7. Conclusion
Economic growth in Pakistan for practical purposes is
endogenous, influenced by government policy. Technical
progress is driven by the ability to absorb foreign technology
and the rate of absorption depends upon knowledge human
capital. Thus the movement of the foreign technological frontier
and the stock of human capital (secondary school graduates) are
increasingly critical for economic development. Yet the return
to years of secondary education indicates substantial
underinvestment in knowledge human capital. The marginal
output generated by secondary education far exceeds the range
calculated for OECD countries. Unlike micro estimates, the
macro estimate of this paper takes into account spillovers; it is
a wider measure of social costs, and therefore is more
appropriate for policy guidance.
The high return is found despite the poor average quality of
education shown by, for instance, large numbers of schools
lacking buildings and widespread teacher absenteeism (Human
Rights Commission, 2005 pp. 243-4). Higher quality education
may be expected to achieve greater returns. The extremely large
rate of return to health spending of 39 percent suggests such
outlays are sound investments, quite independently of their
consumption value. It may also indicate that the quality of
health care needs less of a boost than does the quality of
education.
Compared with the MRW implied production function, the
output elasticity of human capital is low
, and the elasticity of ‘raw’ labor is high. This may reflect
deficiencies in the measurement of human capital. But it may
capture shortcomings in the Pakistani education system as well.
A decomposition of the sources of growth implied by the
estimated cointegrating equation shows that even the incomplete
measures of human capital employed in this study explain just
under 20 percent of the increase in output per head during the
years 1961-2003. The striking feature of this growth analysis is
the impact of human capital policies from the 1990s. Rapid
labor force growth was not matched by expansion of secondary
education, so that the proportion of the educated workforce
declined. As the opportunities for benefiting from world
technology increased, Pakistan’s ability to reap the advantages
deteriorated.
References
Asian Development Bank (2006), ”Key Indicators of
Developing Asian and Pacific Countries,” Oxford University
Press.
Barro, R.J. and Lee, J.W. (2000), “International Data on
Educational Attainment: Updates and Implications,” manuscript,
Harvard University, February.
Barro, R.J. and Lee, J.W. (2001), “International Data on
Educational Attainment: Updates and Implications,” Oxford
Economic Papers, 53(3): 541-563.
Bassanini, A. and Scarpettta, S. (2001), “Does Human Capital
Matter for Growth in OECD Countries? Evidence from PMG
Estimates,” OECD Economics Department, Working Papers, No.
282.
Behrman, J.R., Ross, D. and Sabot, R. (2008), “Improving
Quality Versus Increasing the Quantity of Schooling: Estimates
of Rates of Return from Rural Pakistan,” Journal of
Development Economics, 85(1-2): 84-104.
Benhabib, J. and Spiegel, M. M. (1994), “The Role of Human
Capital in Economic Development: Evidence from Aggregate
Cross-Country Data,” Journal of Monetary Economics, 34: 143-
173.
Benhabib, J. and Spiegel, M.M. (2002), “Human Capital and
Technology Diffusion,” Federal Reserve Bank of San Francisco
Working Paper 2003-02.
Bils, M. and Klenow, P. (2000), “Does Schooling Cause
Growth?” American Economic Review, 90(1): 1160-1183.
Blankenau, W F. and Simpson, N B. (2004), “Public Education
Expenditures and Growth,” Journal of Development Economics,
73(2): 583-605.
Bloom, D., and Canning, D. (2000), “The Health and Wealth of
Nations,” Science, 287(5456): 1207-09.
Bloom, D., and Canning, D. (2003), “The Health and Poverty of
Nations: from Theory to Practice,” Journal of Human
Development, 4(1): 47-71.
Das, J., Pandey, P. and Zajonc, T. (2006), “Learning Levels and
Gaps in Pakistan. Policy,” Research Working Paper Series 4067,
World Bank.
Durlauf, S., P. Johnson and J. Temple (2004), “Growth
Econometrics,” In the Handbook of Economic Growth, P.
Aghion and S. Durlauf, eds., North-Holland.
Dutta D and Ahmed A. (2004), “Trade Liberalization and
Industrial Growth in Pakistan: A Cointegration Analysis,”
Applied Economics, 36: 1421-1429.
Federal Bureau of Statistics (2005), Fifty Years of Pakistan
Statistics, Government of Pakistan.
Government of Pakistan (2006), “Economic Survey, 2005-06,”
Finance Division Economic Advisor’s Wing, Islamabad.
Haroon J. et al. (2003), “Private Returns to Education: Evidence
from Pakistan,” State Bank of Pakistan, Research Report No.
50.
Human Rights Commission of Pakistan (2005), “State of Human
Rights in 2005,” Lahore.
Husain, F. Qasim M. A. Sheikh K. H. (2003), “An Analysis of
Public Expenditure on Education in Pakistan,” The Pakistan
Development Review, 42(4-II): 771–780.
Johansen, S. (1991), “Estimation and Hypothesis Testing of
Cointegration Vectors in Gaussian Vector Autoregressive
Models,” Econometrica, 59: 1551–1580.
Johansen, S. (1995), “Likelihood-Based Inference in
Cointegrated Vector Autoregressive Models,” Oxford University
Press.
Jones, C. (1995), “Time Series Tests of Endogenous Growth
Models,” Quarterly Journal of Economics, 110(2): 495-525.
Maddison, A., (1995), “Monitoring the World Economy, 1820-
1992.” OECD Paris.
Maddison, A. (2001), “The World Economy: A Millennial
Perspective,” OECD Paris.
Mankiw, N. G, Romer, D. and Weil, D. N. (1992), “A
Contribution to the Empirics of Economic Growth,” Quarterly
Journal of Economics, May: 407-37.
Mincer, J. (1974), “Schooling, Experience and Earning,” New
York: National Bureau of Economic Research.
Nasir, Z.M. and Nazil H. (2000), “Education and Earnings in
Pakistan,” Pakistan Institute of Development Economics
Research Report No. 177, Islamabad.
Nelson, R. R. and Phelps E.S. (1966), “Investment in Humans,
Technological Diffusion, and Economic Growth”, American
Economic Review, 56: 69-75.
Parente, S. and Prescott, E. (2000), “Barriers to Riches,”
Cambridge, MA, MIT Press.
Parente, S. and Prescott, E. (1999), “Monopoly Rights: A
Barrier to Riches,” American Economic Review, 89(5): 1216-
1233.
Pungo, M. (1996), “Structural Stability in a Cross Country
Neoclassical Growth Model,” Applied Economics, 28: 1555-
1566.
Rebelo, S. (1991), “Long-Run Policy Analysis and Long Run
Growth,” Journal of Political Economy, 99: 500-521.
Saggi, K. (2002), “Trade, Foreign Direct Investment, and
International Technology Transfer: A Survey,” World Bank
Research Observer, 17(2): 191-235.
Shapiro M. (2005), “Complements of Human Capital in
Technological Catch-up: Openness, Capital and Technology
Transfer in East Asia,” Paper presented at the annual meeting
of the Midwest Political Science Association, Chicago, Illinois.
Sianesi, B. and Van Reenen, J. (2003), “The Returns to
Education: Macro-Economics,” Journal of Economic Surveys,
17(2): 157-200.
State Bank of Pakistan (2006), “Handbook of Pakistan
Economy.”
United Nations Commission for Education (1999), UNESCO
Yearbook.
World Bank (1982), World Development Report 1982, Oxford
University Press, Washington, DC.
World Bank (1984), World Development Report,” Oxford
University Press, Washington, DC.
World Bank (2002), “Development Policy Review: A New
Dawn,” April.
World Bank (2006), “Pakistan Growth and Export
Competitiveness,” Poverty Reduction and Economic
Management Sector Unit, South Asia Region, Report No, 35499.
World Bank (2007), “Key Development Data & Statistics.”
http://go.worldbank.org/1SF48T40L0.
APPENDIX
Table-A: Description of variables and data sources
Variables
Definition and Unit of Measurement
Data Sources
RGDPPW
Real GDP per worker (In US $ per worker in 2000 Constant
Prices)
Penn World Table 6.2
ELF
Employed labour force (in million)
Handbook of Pakistan Economy by Sate Bank of Pakistan, ILO
yearbook statistics
KSPW
Capital stock per worker (in millions)
Miketa, A., 2004: Technical description on the growth study
datasets. Environmentally Compatible Energy Strategies
Program, International Institute for Applied Systems Analysis
(IIASA), Laxenburg, Austria, October 2004.
http://www.iiasa.ac.at/ECS/data_am/index.html
SST
Secondary Schooling Stock (percentage)
Benchmark figures are taken from Barro and Lee (2000) and
following the perpetual inventory method, we constructed flows
of adult population that are added to bench mark stocks.
LITERACY
Literacy (percentage)
Economic Surveys of Pakistan for different years, World tables
by World Bank,
Handbook of Pakistan economy by State Bank of Pakistan, Fifty
year of Pakistan Statistics by Federal Bureau of Statistics (FBS)
Pakistan, and Statistical yearbooks by UNESCO for different
years.
HEGDP
Total health expenditure as % of GDP (HEGDP)
Handbook of Pakistan Economy by State Bank of Pakistan
MFP
Multifactor Productivity
U.S., Bureau of Labor Statistics, Office of Productivity and
Technology (May 2007 publication)
RHE
Real health expenditure (in millions)
Handbook of Pakistan Economy by State Bank of Pakistan
LER
Life Expectancy Rate
Handbook of Pakistan Economy by State Bank of Pakistan and
World Bank
TELE1000
Telephone in use (000 people)
Statistical Yearbooks by United Nation for different years
Education Expenditure
Government Expenditure on Education as % of GDP (GEEGDP)
Economic Surveys of Pakistan for different years, Statistical
Yearbooks by United Nation for different years, Handbook of
Pakistan economy
Table B: Descriptive Statistics
Statistics Variables
Mean
Standard Deviation
LNRGDPPW
8.379
0.382
LNKSPW
8.640
0.645
LNELF
3.212
0.329
LNLITERACY
3.341
0.367
LNSST
1.421
0.667
LNHEGDP
-0.433
0.309
LNMFP
4.471
0.117
Table-C: Partial Correlations
Variables
LNRGDPPW
LNKSPW
LNELF
LNSST
LITERACY
LNHEGDP
LNRGDPPW
1.000
0.981
0.980
0.969
0.961
0.802
LNKSPW
1.000
0.961
0.975
0.936
0.755
LNELF
1.000
0.937
0.981
0.765
LNSST
1.000
0.924
0.713
LITERACY
1.000
0.711
LNHEGDP
1.000
* Comsats Institute of Information Technology, Islamabad,
Pakistan & Cardiff Business School, Cardiff University, UK.
** Cardiff Business School, Cardiff University.
� For instance from 1820 to 1929 Maddison’s (1995) estimates
show that Pakistan’s real GDP per head grew at an average rate
of 0.31 percent. Then incomes doubled in the course of the
1960s, and high growth by historical standards became
sustained in subsequent years, albeit at varying rates.
� Tested at the end of the third grade, only 31 percent of
Pakistani primary school children could correctly form a
sentence with the word “school” in the vernacular (Urdu) (Das,
Pandey and Zajonc, 2006).
� This may be an explanation for Shapiro’s (2005) surprising
finding of a negative international technology diffusion effect
for East Asia.
� A previous time series study of Pakistan industrial’s growth
1973-1995 (Dutta and Ahmed, 2004) investigated the impact of
secondary school enrolment, but there is some question about
the signs of the variables in the cointegrating vector.
� ‘Social’ here does not include spillovers but only the public
(as well as private) financial costs of providing education.
� ((0 + γ1 lnF) / (1 + φ) = ((4.19076 * 0.447) - 1.767) / 1.31 for
1960.
� (β - (0 - γ1 lnF) / (1 + φ) = ((1.357 - 0.175) / 1.31) - 0.08 =
0.82 for 1960, to ((1.357 -0.175) / 1.31) - (((4.6923 * 0.447) -
1.767) / 1.31) = 0.65 for 2005
� (∂Y/∂HE)(HE/Y) = 0.31/1.31, (HE/Y)=0.006, so ∂Y/∂HE =
0.236/.006 =39.44.
� There is a substantial error in the decadal predictions for
growth.
� MRW’s implied result is about one third for human capital,
and it should be noted that by excluding technical progress, as
they do, a similar result can be obtained here.
_1274802552.unknown
_1274802757.unknown
_1274802843.unknown
_1274802697.unknown
_1274802511.unknown
Chapter 15 in S Broadberry and K Fukao eds. Cambridge
Economic History of the Modern World (forthcoming)
Underlying sources of growth: institutions and the state
James Foreman-Peck and Leslie
Hannah
Two characteristics differentiate today’s rich
countries from many poor and middle-income ones: they are all
market economies run largely by capitalist corporations, and
most are representative democracies (oil-rich economies being
exceptions)[footnoteRef:1]. However, capitalist democracies
have widely differing commitments to tax redistribution, levels
of state ownership, health and welfare policies, or the balance
between protecting established property rights and interventions
to remedy the system’s perceived failings. Autocrats have also
promoted economic growth - President Xi of China follows a
long tradition - and have sometimes succeeded over a lower
range of GDP per head. However, economic growth eventually
seems to expand demands for participation: in the later
twentieth century military dictatorships of Taiwan, South Korea
and Spain liberalized and communist autocrats in eastern
Europe conceded free elections. [1: In 2018 no country that
was an autocracy (Polity IV definition, see note 10, below) had
an income per head of more than $15,000 if it was not heavily
dependent on fossil-fuel exports. Countries that were
autocratically ruled and did not have the option to export fossil
fuels were poor (Roser 2014).]
While democracy, capitalism and wealth are
correlated, the possibility and nature of causation among the
three is much debated. Major themes in the western literature -
pioneered by Nobel-prizewinning economic historian Douglass
North and enriched by many others[footnoteRef:2] - are when
these correlations emerged and how they are structurally
related. We follow this “new institutional economics” approach
here. Wealth-maximizing political institutions are hypothesized
to be inclusively representative, sometimes leading toward full
democracy, combined with respect for minorities. Arguably
political and economic ‘open access’ - representative political
institutions and ready access to incorporation or similar
enterprise forms - are mutually reinforcing and conducive to
high living standards, broadly shared (North Wallis and
Weingast 2009, hereafter NWW). [2: For instance, North and
Thomas 1973; Rosenberg and Birdzell 1986; Ostrom 1990;
Engerman and Sokoloff 2012; Acemoglu and Johnson 2005;
Haber North and Weingast 2008; Acemoglu and Robinson 2012;
Lamoreaux and Wallis 2017; Alston et al 2018.]
Institutions are the patterns of interaction that govern
and constrain the relationships of individuals; the ‘rules of the
game’. Relevant rules include written laws, formal social
conventions, informal norms of behaviour and shared beliefs
about the world. This variety ensures that institutions are often
difficult to define precisely. The institutional form of some
states includes the rule of law, in others the rule of arbitrary
terror. Institutions are often hard to create and highly persistent.
Institutional economics attempts to understand why and under
what conditions they emerge.
Institutions facilitating transitionsfrom limited to open access
must allow the circulation of elites. Elites may be elected but in
a low income, feudal society such as contemporary Pakistan
they can still at best be a ‘selectorate’. New people must be
allowed access to power, changing the social structure, but
without too much collateral damage to society. Peaceful
transitions therefore may entail outgoing elites being permitted
to hold on to their wealth, so they abandon power without
violence. The condition of peaceful circulation in turn needs
acceptance of a rule of law for elites that offers them a form of
legal protection. A second condition is that there must be
substantial numbers of independent, perpetually lived
organizations, such as corporations; these can undertake more
economic activities than finite life organizations. Political
control of the military is an essential third condition. The
failure of the military coups in 1981 and 1982 marked the
success of the Spanish transition to open political and economic
access. Control is essential to reduce threats of violence and
trade disruption and cutting the risk of expropriation by the
military increases the benefits of markets. When economies and
societies satisfy these three conditions and become wealthier,
the open access transition and sustained economic growth are
more likely to occur (NWW 2009).
The “Washington consensus” - or the
“Manchester School” as similarly free market
liberal[footnoteRef:3] ideas were known in the nineteenth
century - never goes uncontested (Chang 2002, Stiglitz
2003).[footnoteRef:4] It is now concretely expressed in the
World Bank’s detailed policy prescriptions and “Doing
Business” index (www.worldbank.org). The “good” institutions
it recommends include democracy, an independent judiciary,
uncorrupt and efficient bureaucrats, secure property rights, a
politically-independent central bank, easy and cheap business
registration, transparent and market-orientated corporate
governance, and a responsive legal system (with common law
systems judged to perform well on this dimension). [3: We use
the term “liberal” in its original European - or modern “neo-
liberal” - sense to mean anti-authoritarian supporters of
individual freedom, free markets and a limited state, not in the
modern American English sense (broadly the opposite).] [4:
Before 1914, the Manchester School was similarly contested by
Marxists, American institutionalists, German
Kathedersozialisten, British Fabian socialists and many others.]
A frequent problem in understanding their role today is that
institutions have often existed for decades. They have
sometimes evolved with minimal formal deliberation (the
unwritten British “constitution”) rather than being consciously
constructed (the American constitution, though that too
evolved). It is sometimes difficult to identify origins, causes
and effects separately from those of related institutions, or
cultural background, with which they interact. For example,
Haber, North and Weingast (2008) contend that correlations
between favourable economic outcomes and Anglo-American
common law systems are not causal: both the outcomes and
common law judgments are triggered by third factors,
representative political institutions and tolerably equal
economic access.
Some institutions - such as patents, education
and demographic norms - are discussed in other chapters. We
pay special attention here to the development of business
incorporation and its relation to evolving representative
government. The capitalist corporate form - and some state-
owned substitutes - came to dominate enterprise in almost all
post-agrarian societies by the end of the twentieth century and
political institutions played a key role in this development.
NWW (2009) maintain that under the ‘natural state’ (a coalition
of elites), economic growth can take place but will be
eventually choked off as the basis of elite power comes under
threat. The transition to sustained economic growth requires the
transformation of both political and economic institutions, so
that they can become mutually supporting. Traditional - feudal,
monarchical, established religion, class- or caste-bound –
societies usually restrained political and economic open access.
Sometimes the move to more representative government
occurred because incumbent elites made mistakes that weakened
their hold on power (Treisman 2017). For those outside the elite
the overthrow of such systems in the name of “modernity” often
seemed a prerequisite for growth and development. In that
limited sense American and French revolutionaries
overthrowing monarchy and aristocracy, Lenin’s execution of
the Tsar and attacks on the bourgeoisie, and Maoist
revolutionaries undermining Confucianism and the Manchukuo
dynasty were all on the same page. All also seriously risked
oversimplifying (sometimes murderously) the problematic
transition to modernity.
We set the scene with a survey of economic and political
institutions in 1870 and the concentration of wealth in Western
Europe and North America. We go on to consider the experience
and institutional features of the first non-Western moderniser
after 1870, Japan. The third section summarises the non-market
institutions and state development from 1917 of the Communist
alternative states. This is followed by a brief account of the key
characteristics of the hybrid state-driven capitalist economies
that begin to appear after 1945. In each section we rely heavily,
but not uncritically, on the NWW framework to interpret the
relationships between economic development and political and
economic institutions.
I Economic and Political Institutions in 1870
In 1870 political economists - as institutional
economists were then called - had strong views on the
characteristics of desirable institutions and were confident they
were the cause, not merely the happy result, of prosperity. They
used Christianity and “civilisation” as synonyms:
“Christendom” meant the developed world (Mulhall 1881). A
leading sociologist, Max Weber, and many historians agreed
that religion - and especially the Protestant variety - had
promoted capitalist prosperity (Weber 1904, Butterfield 1931,
Tawney 1964) and there remain today some exponents of the
view that “good” or “poor” institutions are rooted in deep
national cultural traits such as religion (Landes 1999; Stulz and
Williamson 2003; McCloskey 2010; Djankov and Hauck
2016).[footnoteRef:5] Most Islamic countries have experienced
difficulties in growing rich (except on oil) and generally have
had autocratic governments (Kuran 2011). Yet economic growth
is now more widely shared by non-Protestant countries and rich
countries have become more agnostic. Religious institutions as
causes of national economic growth are accordingly less
prominent in today’s institutional economics than they were in
the past. [5: For a broader discussion of the interactions
between culture (generally learned informally from parents,
civil society or churches) and institutions (which are more
deliberate -and often political – creations), see Alesina and
Giuliano 2015.]
One obvious feature of the world of 1870 was how distant the
bulk of humanity were from the NWW ideal of ‘open access’ or
‘inclusive’ institutions. Living standards were already high in
much of western Europe, north America and Australasia, where
governments fostered widespread (if imperfectly democratic)
participation in both dispersed capitalist corporations and
representative political assemblies. It was still a matter of
heated debate whether some institutions – like limited liability,
patents, or democracy - were aids to, or barriers to, economic
progress. Not until the early twentieth century did three rich
countries – Finland, Australia and New Zealand – introduce a
franchise close to that considered democratic today (including
women). Some, like France and Switzerland, did not do so until
after World War Two. One near approach to a more generous
definition of democracy - universal adult male franchise - in the
French Second Republic only demonstrated its dangers: it had
led in 1852 to the endorseement of the autocratic Napoleon III.
In the richest countries, statesmen either judged a wider
franchise undesirable, or, accepting it was inevitable, fretted
about ensuring broader commitment to the existing polity and
social hierarchy. They pressed for wider education, modest
social protections, or for restricting radicals, labour unions and
(within empires) native independence movements.
Most of the world’s population lived under absolute hereditary
rulers, subject to few formal restraints (Russia, China, Japan,
Brazil, the Ottomans) or direct rule by a controlling power
(British India, French Indo-China, American Alaska). In the
developed world, most states (including the UK, Germany,
Italy) were monarchies, though with some representative
government and serious restraints on the arbitrary exercise of
regal power. Only in America (north and south) did republics
predominate. Nation states were the basic institutional
framework for political and economic development: their
governments were the authors of legislation and incubators of
formal institutions. People, capital, goods and ideas moved
across national borders, but they travelled more easily within
those borders, especially borders that enclosed linguistic or
culturally homogeneous communities. Newspapers, political
activities, social interactions, education systems, transport
improvements and laws increasingly reinforced national links.
Mill (1861) argued that representative government “was next to
impossible in a country made up of different nationalities.” The
Hapsburg monarchy, though opting not to merge its nine million
German-speakers into the new German confederation of 1870-
71, did separate the government of its constituent Austrian and
Hungarian kingdoms. Mill’s point was important, as nation
states consolidated, but also raised as many questions as it
answered: were the Irish British? were Poles and Alsatians
German? were Muslims or Buddhists Indian? could one really
create a nation out of US polyglot immigrants, when the north
disagreed with the south on as fundamental an issue as slavery?
The number of sovereigns had declined as states consolidated
and major sovereigns annexed weaker ones and was to decline
further, notably with the European “scramble for Africa,” to 54
by 1914.[footnoteRef:6] European empires, which had
administered a third of the world’s land surface in 1800,
controlled over 84% by 1914 (Fieldhouse 1973). Rich nation
states (excluding their empires) in 1870 were about equal in
size: populations were 40m (US), 39m (Germany), 38m (France)
and 31m (UK). Many more people lived in recognizably poorer
countries with autocratic governments (Russia with 83m, the
Indian subcontinent with 300m and China with 358m together
accounted for 58% of the world’s population). [6: War-induced
break-ups were to increase that to 76 by 1949 and later de-
colonizations resulted in today’s level of around 200 nation
states (Gancia et al 2016, p. 1).
]
International institutions - European empires apart
- were almost non-existent. Bodies such as the International
Commission on the Danube worked well for riparian states, the
International Office of Telegraphy was set up 1869 and the
International Bureau of Weights and Measures in 1870. The
Hague Tribunal (another forerunner of today’s United Nations
for resolving international disputes) had to wait until 1899.
Nonetheless international trade (the increasingly protectionist
US excepted) was relatively free, facilitated by tariff reduction
agreements and acceptance of the “most favoured nation”
clause. Communications were improving: the French opened the
Suez Canal (speeding communication between Europe and Asia)
in 1869 and in the same year the US completed north America’s
first transcontinental railway, both expanding trade
opportunities. The Victorian “worldwide web” was almost
complete, with a working cable across the Atlantic by 1866,
India and Singapore connected by 1870 and Australia and major
cities on Asia’s Pacific coastline following in 1871 (Foreman-
Peck 1995). These achievements left sub-Saharan Africa as the
only major region not then linked to rapid telegraphic
communication.
The connection that North et al hypothesised
between open access in the political and economic spheres
might be expected to show up earliest and most clearly in the
US, a self-consciously new and different country whose many
constituent states were experimenting with open access both
politically and economically: extending the franchise and
general incorporation laws. The number of corporations per
capita in the US was already high by European standards by the
middle decades of the nineteenth century (Wright 2014, Hannah
2014). However, there was considerable variation between US
states in allowing incorporation with limited liability by simple
registration and political open access, with long lags both ways;
the changes were slow, difficult and contingent (Hilt 2017).
Few believed that opening access to organizations of all kinds
could both spark sustained economic growth and enhance the
workings of democratic politics (Lamoreaux and Wallis 2017).
A more sharply mixed pattern can be seen globally.
China, Japan, many un-colonized Asian and African states, the
Russian and Ottoman Empires and much of south eastern Europe
lacked general incorporation statutes in 1870 and for several
more decades. On the other hand, most rich countries with some
Journal of Monetary Economics 22 (1988) 3-42. North-Holland.docx

More Related Content

Similar to Journal of Monetary Economics 22 (1988) 3-42. North-Holland.docx

Institution As The Fundamental Cause Of Long Tern Growth
Institution As The Fundamental Cause Of Long Tern GrowthInstitution As The Fundamental Cause Of Long Tern Growth
Institution As The Fundamental Cause Of Long Tern GrowthTammy Majors
 
Presidents Day Writing If I Were President A To Z
Presidents Day Writing If I Were President A To ZPresidents Day Writing If I Were President A To Z
Presidents Day Writing If I Were President A To ZErin Perez
 
Agricultural Extension and Communication
Agricultural Extension and CommunicationAgricultural Extension and Communication
Agricultural Extension and CommunicationKarl Obispo
 
Compare And Contrast 5 Paragraph Essay.pdf
Compare And Contrast 5 Paragraph Essay.pdfCompare And Contrast 5 Paragraph Essay.pdf
Compare And Contrast 5 Paragraph Essay.pdfTrina Martin
 
Understanding the Informal Sector
Understanding the Informal SectorUnderstanding the Informal Sector
Understanding the Informal SectorDr Lendy Spires
 
ECON 1110 Intermediate MacroeconomicsSpring 2020Instructions.docx
ECON 1110 Intermediate MacroeconomicsSpring 2020Instructions.docxECON 1110 Intermediate MacroeconomicsSpring 2020Instructions.docx
ECON 1110 Intermediate MacroeconomicsSpring 2020Instructions.docxtidwellveronique
 
Aging Problem of China : Impact and Solution
Aging Problem of China : Impact and SolutionAging Problem of China : Impact and Solution
Aging Problem of China : Impact and SolutionVed Prakash Gupta
 
FUTURE AGENDA: Future of wealth (initial-perspective) Prof. Julio J. Prado
FUTURE AGENDA: Future of wealth (initial-perspective) Prof. Julio J. PradoFUTURE AGENDA: Future of wealth (initial-perspective) Prof. Julio J. Prado
FUTURE AGENDA: Future of wealth (initial-perspective) Prof. Julio J. PradoJulio Jose Prado
 
Scientific Revolution Essay. PDF THE SCIENTIFIC REVOLUTION IN ENGLAND John H...
Scientific Revolution Essay. PDF THE SCIENTIFIC REVOLUTION IN ENGLAND  John H...Scientific Revolution Essay. PDF THE SCIENTIFIC REVOLUTION IN ENGLAND  John H...
Scientific Revolution Essay. PDF THE SCIENTIFIC REVOLUTION IN ENGLAND John H...Violeta Cressman
 
Scientific Revolution Essay.pdf
Scientific Revolution Essay.pdfScientific Revolution Essay.pdf
Scientific Revolution Essay.pdfVanessa Henderson
 
The Importance of Parameter Constancy for Endogenous Growth with Externality
The Importance of Parameter Constancy for Endogenous Growth with Externality The Importance of Parameter Constancy for Endogenous Growth with Externality
The Importance of Parameter Constancy for Endogenous Growth with Externality Dr. Kelly YiYu Lin
 
Indian Economy Essay.pdf
Indian Economy Essay.pdfIndian Economy Essay.pdf
Indian Economy Essay.pdfStephanie Green
 
The Informal Economy: Definitions, Theories and Policies
 The Informal Economy: Definitions, Theories and Policies  The Informal Economy: Definitions, Theories and Policies
The Informal Economy: Definitions, Theories and Policies Dr Lendy Spires
 
Role of Business Schools in Orienting Students towards Building Happy Economi...
Role of Business Schools in Orienting Students towards Building Happy Economi...Role of Business Schools in Orienting Students towards Building Happy Economi...
Role of Business Schools in Orienting Students towards Building Happy Economi...ijcnes
 
Short note on developmental study for pg
Short note on developmental study for pgShort note on developmental study for pg
Short note on developmental study for pgasegede kebede
 

Similar to Journal of Monetary Economics 22 (1988) 3-42. North-Holland.docx (17)

Institution As The Fundamental Cause Of Long Tern Growth
Institution As The Fundamental Cause Of Long Tern GrowthInstitution As The Fundamental Cause Of Long Tern Growth
Institution As The Fundamental Cause Of Long Tern Growth
 
Presidents Day Writing If I Were President A To Z
Presidents Day Writing If I Were President A To ZPresidents Day Writing If I Were President A To Z
Presidents Day Writing If I Were President A To Z
 
49488
4948849488
49488
 
Agricultural Extension and Communication
Agricultural Extension and CommunicationAgricultural Extension and Communication
Agricultural Extension and Communication
 
Compare And Contrast 5 Paragraph Essay.pdf
Compare And Contrast 5 Paragraph Essay.pdfCompare And Contrast 5 Paragraph Essay.pdf
Compare And Contrast 5 Paragraph Essay.pdf
 
Understanding the Informal Sector
Understanding the Informal SectorUnderstanding the Informal Sector
Understanding the Informal Sector
 
ECON 1110 Intermediate MacroeconomicsSpring 2020Instructions.docx
ECON 1110 Intermediate MacroeconomicsSpring 2020Instructions.docxECON 1110 Intermediate MacroeconomicsSpring 2020Instructions.docx
ECON 1110 Intermediate MacroeconomicsSpring 2020Instructions.docx
 
Aging Problem of China : Impact and Solution
Aging Problem of China : Impact and SolutionAging Problem of China : Impact and Solution
Aging Problem of China : Impact and Solution
 
FUTURE AGENDA: Future of wealth (initial-perspective) Prof. Julio J. Prado
FUTURE AGENDA: Future of wealth (initial-perspective) Prof. Julio J. PradoFUTURE AGENDA: Future of wealth (initial-perspective) Prof. Julio J. Prado
FUTURE AGENDA: Future of wealth (initial-perspective) Prof. Julio J. Prado
 
Scientific Revolution Essay. PDF THE SCIENTIFIC REVOLUTION IN ENGLAND John H...
Scientific Revolution Essay. PDF THE SCIENTIFIC REVOLUTION IN ENGLAND  John H...Scientific Revolution Essay. PDF THE SCIENTIFIC REVOLUTION IN ENGLAND  John H...
Scientific Revolution Essay. PDF THE SCIENTIFIC REVOLUTION IN ENGLAND John H...
 
Scientific Revolution Essay.pdf
Scientific Revolution Essay.pdfScientific Revolution Essay.pdf
Scientific Revolution Essay.pdf
 
The Importance of Parameter Constancy for Endogenous Growth with Externality
The Importance of Parameter Constancy for Endogenous Growth with Externality The Importance of Parameter Constancy for Endogenous Growth with Externality
The Importance of Parameter Constancy for Endogenous Growth with Externality
 
Indian Economy Essay.pdf
Indian Economy Essay.pdfIndian Economy Essay.pdf
Indian Economy Essay.pdf
 
The Informal Economy: Definitions, Theories and Policies
 The Informal Economy: Definitions, Theories and Policies  The Informal Economy: Definitions, Theories and Policies
The Informal Economy: Definitions, Theories and Policies
 
Role of Business Schools in Orienting Students towards Building Happy Economi...
Role of Business Schools in Orienting Students towards Building Happy Economi...Role of Business Schools in Orienting Students towards Building Happy Economi...
Role of Business Schools in Orienting Students towards Building Happy Economi...
 
Short note on developmental study for pg
Short note on developmental study for pgShort note on developmental study for pg
Short note on developmental study for pg
 
Essay On Role Model
Essay On Role ModelEssay On Role Model
Essay On Role Model
 

More from donnajames55

KATIES POST The crisis case I chose to discuss this week is th.docx
KATIES POST The crisis case I chose to discuss this week is th.docxKATIES POST The crisis case I chose to discuss this week is th.docx
KATIES POST The crisis case I chose to discuss this week is th.docxdonnajames55
 
Kate Chopins concise The Story of an Hour.  What does Joseph.docx
Kate Chopins concise The Story of an Hour.  What does Joseph.docxKate Chopins concise The Story of an Hour.  What does Joseph.docx
Kate Chopins concise The Story of an Hour.  What does Joseph.docxdonnajames55
 
Kadyr AkovaCosc 1437D. KirkEnemy.javaimport java.util..docx
Kadyr AkovaCosc 1437D. KirkEnemy.javaimport java.util..docxKadyr AkovaCosc 1437D. KirkEnemy.javaimport java.util..docx
Kadyr AkovaCosc 1437D. KirkEnemy.javaimport java.util..docxdonnajames55
 
K-2nd Grade3rd-5th Grade6th-8th GradeMajor Concepts,.docx
K-2nd Grade3rd-5th Grade6th-8th GradeMajor Concepts,.docxK-2nd Grade3rd-5th Grade6th-8th GradeMajor Concepts,.docx
K-2nd Grade3rd-5th Grade6th-8th GradeMajor Concepts,.docxdonnajames55
 
JWI 505 Business Communications and Executive Presence Lect.docx
JWI 505 Business Communications and Executive Presence Lect.docxJWI 505 Business Communications and Executive Presence Lect.docx
JWI 505 Business Communications and Executive Presence Lect.docxdonnajames55
 
Just Walk on By by Brent Staples My firs.docx
Just Walk on By by Brent Staples               My firs.docxJust Walk on By by Brent Staples               My firs.docx
Just Walk on By by Brent Staples My firs.docxdonnajames55
 
Just make it simple. and not have to be good, its the first draft. .docx
Just make it simple. and not have to be good, its the first draft. .docxJust make it simple. and not have to be good, its the first draft. .docx
Just make it simple. and not have to be good, its the first draft. .docxdonnajames55
 
JUST 497 Senior Seminar and Internship ExperienceInternationa.docx
JUST 497 Senior Seminar and Internship ExperienceInternationa.docxJUST 497 Senior Seminar and Internship ExperienceInternationa.docx
JUST 497 Senior Seminar and Internship ExperienceInternationa.docxdonnajames55
 
July 2002, Vol 92, No. 7 American Journal of Public Health E.docx
July 2002, Vol 92, No. 7  American Journal of Public Health E.docxJuly 2002, Vol 92, No. 7  American Journal of Public Health E.docx
July 2002, Vol 92, No. 7 American Journal of Public Health E.docxdonnajames55
 
Journals are to be 2 pages long with an introduction, discussion and.docx
Journals are to be 2 pages long with an introduction, discussion and.docxJournals are to be 2 pages long with an introduction, discussion and.docx
Journals are to be 2 pages long with an introduction, discussion and.docxdonnajames55
 
Judgement in Managerial Decision MakingBased on examples fro.docx
Judgement in Managerial Decision MakingBased on examples fro.docxJudgement in Managerial Decision MakingBased on examples fro.docx
Judgement in Managerial Decision MakingBased on examples fro.docxdonnajames55
 
Joyce is a 34-year-old woman who has been married 10 years. She .docx
Joyce is a 34-year-old woman who has been married 10 years. She .docxJoyce is a 34-year-old woman who has been married 10 years. She .docx
Joyce is a 34-year-old woman who has been married 10 years. She .docxdonnajames55
 
Journal Write in 300-500 words about the following topic.After .docx
Journal Write in 300-500 words about the following topic.After .docxJournal Write in 300-500 words about the following topic.After .docx
Journal Write in 300-500 words about the following topic.After .docxdonnajames55
 
Journal Supervision and Management StyleWhen it comes to superv.docx
Journal Supervision and Management StyleWhen it comes to superv.docxJournal Supervision and Management StyleWhen it comes to superv.docx
Journal Supervision and Management StyleWhen it comes to superv.docxdonnajames55
 
Journal of Soc. & Psy. Sci. 2018 Volume 11 (1) 51-55 Ava.docx
Journal of Soc. & Psy. Sci. 2018 Volume 11 (1) 51-55  Ava.docxJournal of Soc. & Psy. Sci. 2018 Volume 11 (1) 51-55  Ava.docx
Journal of Soc. & Psy. Sci. 2018 Volume 11 (1) 51-55 Ava.docxdonnajames55
 
Journal of Social Work Values & Ethics, Fall 2018, Vol. 15, No.docx
Journal of Social Work Values & Ethics, Fall 2018, Vol. 15, No.docxJournal of Social Work Values & Ethics, Fall 2018, Vol. 15, No.docx
Journal of Social Work Values & Ethics, Fall 2018, Vol. 15, No.docxdonnajames55
 
Journal of Policy Practice, 9220–239, 2010 Copyright © Taylor &.docx
Journal of Policy Practice, 9220–239, 2010 Copyright © Taylor &.docxJournal of Policy Practice, 9220–239, 2010 Copyright © Taylor &.docx
Journal of Policy Practice, 9220–239, 2010 Copyright © Taylor &.docxdonnajames55
 
Journal of Personality 862, April 2018VC 2016 Wiley Perio.docx
Journal of Personality 862, April 2018VC 2016 Wiley Perio.docxJournal of Personality 862, April 2018VC 2016 Wiley Perio.docx
Journal of Personality 862, April 2018VC 2016 Wiley Perio.docxdonnajames55
 
Journal of Personality and Social Psychology1977, Vol. 35, N.docx
Journal of Personality and Social Psychology1977, Vol. 35, N.docxJournal of Personality and Social Psychology1977, Vol. 35, N.docx
Journal of Personality and Social Psychology1977, Vol. 35, N.docxdonnajames55
 
Journal of Pcnonaluy and Social Psychology1»M. Vd 47, No 6. .docx
Journal of Pcnonaluy and Social Psychology1»M. Vd 47, No 6. .docxJournal of Pcnonaluy and Social Psychology1»M. Vd 47, No 6. .docx
Journal of Pcnonaluy and Social Psychology1»M. Vd 47, No 6. .docxdonnajames55
 

More from donnajames55 (20)

KATIES POST The crisis case I chose to discuss this week is th.docx
KATIES POST The crisis case I chose to discuss this week is th.docxKATIES POST The crisis case I chose to discuss this week is th.docx
KATIES POST The crisis case I chose to discuss this week is th.docx
 
Kate Chopins concise The Story of an Hour.  What does Joseph.docx
Kate Chopins concise The Story of an Hour.  What does Joseph.docxKate Chopins concise The Story of an Hour.  What does Joseph.docx
Kate Chopins concise The Story of an Hour.  What does Joseph.docx
 
Kadyr AkovaCosc 1437D. KirkEnemy.javaimport java.util..docx
Kadyr AkovaCosc 1437D. KirkEnemy.javaimport java.util..docxKadyr AkovaCosc 1437D. KirkEnemy.javaimport java.util..docx
Kadyr AkovaCosc 1437D. KirkEnemy.javaimport java.util..docx
 
K-2nd Grade3rd-5th Grade6th-8th GradeMajor Concepts,.docx
K-2nd Grade3rd-5th Grade6th-8th GradeMajor Concepts,.docxK-2nd Grade3rd-5th Grade6th-8th GradeMajor Concepts,.docx
K-2nd Grade3rd-5th Grade6th-8th GradeMajor Concepts,.docx
 
JWI 505 Business Communications and Executive Presence Lect.docx
JWI 505 Business Communications and Executive Presence Lect.docxJWI 505 Business Communications and Executive Presence Lect.docx
JWI 505 Business Communications and Executive Presence Lect.docx
 
Just Walk on By by Brent Staples My firs.docx
Just Walk on By by Brent Staples               My firs.docxJust Walk on By by Brent Staples               My firs.docx
Just Walk on By by Brent Staples My firs.docx
 
Just make it simple. and not have to be good, its the first draft. .docx
Just make it simple. and not have to be good, its the first draft. .docxJust make it simple. and not have to be good, its the first draft. .docx
Just make it simple. and not have to be good, its the first draft. .docx
 
JUST 497 Senior Seminar and Internship ExperienceInternationa.docx
JUST 497 Senior Seminar and Internship ExperienceInternationa.docxJUST 497 Senior Seminar and Internship ExperienceInternationa.docx
JUST 497 Senior Seminar and Internship ExperienceInternationa.docx
 
July 2002, Vol 92, No. 7 American Journal of Public Health E.docx
July 2002, Vol 92, No. 7  American Journal of Public Health E.docxJuly 2002, Vol 92, No. 7  American Journal of Public Health E.docx
July 2002, Vol 92, No. 7 American Journal of Public Health E.docx
 
Journals are to be 2 pages long with an introduction, discussion and.docx
Journals are to be 2 pages long with an introduction, discussion and.docxJournals are to be 2 pages long with an introduction, discussion and.docx
Journals are to be 2 pages long with an introduction, discussion and.docx
 
Judgement in Managerial Decision MakingBased on examples fro.docx
Judgement in Managerial Decision MakingBased on examples fro.docxJudgement in Managerial Decision MakingBased on examples fro.docx
Judgement in Managerial Decision MakingBased on examples fro.docx
 
Joyce is a 34-year-old woman who has been married 10 years. She .docx
Joyce is a 34-year-old woman who has been married 10 years. She .docxJoyce is a 34-year-old woman who has been married 10 years. She .docx
Joyce is a 34-year-old woman who has been married 10 years. She .docx
 
Journal Write in 300-500 words about the following topic.After .docx
Journal Write in 300-500 words about the following topic.After .docxJournal Write in 300-500 words about the following topic.After .docx
Journal Write in 300-500 words about the following topic.After .docx
 
Journal Supervision and Management StyleWhen it comes to superv.docx
Journal Supervision and Management StyleWhen it comes to superv.docxJournal Supervision and Management StyleWhen it comes to superv.docx
Journal Supervision and Management StyleWhen it comes to superv.docx
 
Journal of Soc. & Psy. Sci. 2018 Volume 11 (1) 51-55 Ava.docx
Journal of Soc. & Psy. Sci. 2018 Volume 11 (1) 51-55  Ava.docxJournal of Soc. & Psy. Sci. 2018 Volume 11 (1) 51-55  Ava.docx
Journal of Soc. & Psy. Sci. 2018 Volume 11 (1) 51-55 Ava.docx
 
Journal of Social Work Values & Ethics, Fall 2018, Vol. 15, No.docx
Journal of Social Work Values & Ethics, Fall 2018, Vol. 15, No.docxJournal of Social Work Values & Ethics, Fall 2018, Vol. 15, No.docx
Journal of Social Work Values & Ethics, Fall 2018, Vol. 15, No.docx
 
Journal of Policy Practice, 9220–239, 2010 Copyright © Taylor &.docx
Journal of Policy Practice, 9220–239, 2010 Copyright © Taylor &.docxJournal of Policy Practice, 9220–239, 2010 Copyright © Taylor &.docx
Journal of Policy Practice, 9220–239, 2010 Copyright © Taylor &.docx
 
Journal of Personality 862, April 2018VC 2016 Wiley Perio.docx
Journal of Personality 862, April 2018VC 2016 Wiley Perio.docxJournal of Personality 862, April 2018VC 2016 Wiley Perio.docx
Journal of Personality 862, April 2018VC 2016 Wiley Perio.docx
 
Journal of Personality and Social Psychology1977, Vol. 35, N.docx
Journal of Personality and Social Psychology1977, Vol. 35, N.docxJournal of Personality and Social Psychology1977, Vol. 35, N.docx
Journal of Personality and Social Psychology1977, Vol. 35, N.docx
 
Journal of Pcnonaluy and Social Psychology1»M. Vd 47, No 6. .docx
Journal of Pcnonaluy and Social Psychology1»M. Vd 47, No 6. .docxJournal of Pcnonaluy and Social Psychology1»M. Vd 47, No 6. .docx
Journal of Pcnonaluy and Social Psychology1»M. Vd 47, No 6. .docx
 

Recently uploaded

Student login on Anyboli platform.helpin
Student login on Anyboli platform.helpinStudent login on Anyboli platform.helpin
Student login on Anyboli platform.helpinRaunakKeshri1
 
APM Welcome, APM North West Network Conference, Synergies Across Sectors
APM Welcome, APM North West Network Conference, Synergies Across SectorsAPM Welcome, APM North West Network Conference, Synergies Across Sectors
APM Welcome, APM North West Network Conference, Synergies Across SectorsAssociation for Project Management
 
BAG TECHNIQUE Bag technique-a tool making use of public health bag through wh...
BAG TECHNIQUE Bag technique-a tool making use of public health bag through wh...BAG TECHNIQUE Bag technique-a tool making use of public health bag through wh...
BAG TECHNIQUE Bag technique-a tool making use of public health bag through wh...Sapna Thakur
 
Russian Call Girls in Andheri Airport Mumbai WhatsApp 9167673311 💞 Full Nigh...
Russian Call Girls in Andheri Airport Mumbai WhatsApp  9167673311 💞 Full Nigh...Russian Call Girls in Andheri Airport Mumbai WhatsApp  9167673311 💞 Full Nigh...
Russian Call Girls in Andheri Airport Mumbai WhatsApp 9167673311 💞 Full Nigh...Pooja Nehwal
 
Kisan Call Centre - To harness potential of ICT in Agriculture by answer farm...
Kisan Call Centre - To harness potential of ICT in Agriculture by answer farm...Kisan Call Centre - To harness potential of ICT in Agriculture by answer farm...
Kisan Call Centre - To harness potential of ICT in Agriculture by answer farm...Krashi Coaching
 
mini mental status format.docx
mini    mental       status     format.docxmini    mental       status     format.docx
mini mental status format.docxPoojaSen20
 
1029-Danh muc Sach Giao Khoa khoi 6.pdf
1029-Danh muc Sach Giao Khoa khoi  6.pdf1029-Danh muc Sach Giao Khoa khoi  6.pdf
1029-Danh muc Sach Giao Khoa khoi 6.pdfQucHHunhnh
 
Call Girls in Dwarka Mor Delhi Contact Us 9654467111
Call Girls in Dwarka Mor Delhi Contact Us 9654467111Call Girls in Dwarka Mor Delhi Contact Us 9654467111
Call Girls in Dwarka Mor Delhi Contact Us 9654467111Sapana Sha
 
Disha NEET Physics Guide for classes 11 and 12.pdf
Disha NEET Physics Guide for classes 11 and 12.pdfDisha NEET Physics Guide for classes 11 and 12.pdf
Disha NEET Physics Guide for classes 11 and 12.pdfchloefrazer622
 
The Most Excellent Way | 1 Corinthians 13
The Most Excellent Way | 1 Corinthians 13The Most Excellent Way | 1 Corinthians 13
The Most Excellent Way | 1 Corinthians 13Steve Thomason
 
Introduction to Nonprofit Accounting: The Basics
Introduction to Nonprofit Accounting: The BasicsIntroduction to Nonprofit Accounting: The Basics
Introduction to Nonprofit Accounting: The BasicsTechSoup
 
Beyond the EU: DORA and NIS 2 Directive's Global Impact
Beyond the EU: DORA and NIS 2 Directive's Global ImpactBeyond the EU: DORA and NIS 2 Directive's Global Impact
Beyond the EU: DORA and NIS 2 Directive's Global ImpactPECB
 
POINT- BIOCHEMISTRY SEM 2 ENZYMES UNIT 5.pptx
POINT- BIOCHEMISTRY SEM 2 ENZYMES UNIT 5.pptxPOINT- BIOCHEMISTRY SEM 2 ENZYMES UNIT 5.pptx
POINT- BIOCHEMISTRY SEM 2 ENZYMES UNIT 5.pptxSayali Powar
 
Arihant handbook biology for class 11 .pdf
Arihant handbook biology for class 11 .pdfArihant handbook biology for class 11 .pdf
Arihant handbook biology for class 11 .pdfchloefrazer622
 
Separation of Lanthanides/ Lanthanides and Actinides
Separation of Lanthanides/ Lanthanides and ActinidesSeparation of Lanthanides/ Lanthanides and Actinides
Separation of Lanthanides/ Lanthanides and ActinidesFatimaKhan178732
 
Activity 01 - Artificial Culture (1).pdf
Activity 01 - Artificial Culture (1).pdfActivity 01 - Artificial Culture (1).pdf
Activity 01 - Artificial Culture (1).pdfciinovamais
 
Mastering the Unannounced Regulatory Inspection
Mastering the Unannounced Regulatory InspectionMastering the Unannounced Regulatory Inspection
Mastering the Unannounced Regulatory InspectionSafetyChain Software
 

Recently uploaded (20)

Student login on Anyboli platform.helpin
Student login on Anyboli platform.helpinStudent login on Anyboli platform.helpin
Student login on Anyboli platform.helpin
 
APM Welcome, APM North West Network Conference, Synergies Across Sectors
APM Welcome, APM North West Network Conference, Synergies Across SectorsAPM Welcome, APM North West Network Conference, Synergies Across Sectors
APM Welcome, APM North West Network Conference, Synergies Across Sectors
 
BAG TECHNIQUE Bag technique-a tool making use of public health bag through wh...
BAG TECHNIQUE Bag technique-a tool making use of public health bag through wh...BAG TECHNIQUE Bag technique-a tool making use of public health bag through wh...
BAG TECHNIQUE Bag technique-a tool making use of public health bag through wh...
 
Russian Call Girls in Andheri Airport Mumbai WhatsApp 9167673311 💞 Full Nigh...
Russian Call Girls in Andheri Airport Mumbai WhatsApp  9167673311 💞 Full Nigh...Russian Call Girls in Andheri Airport Mumbai WhatsApp  9167673311 💞 Full Nigh...
Russian Call Girls in Andheri Airport Mumbai WhatsApp 9167673311 💞 Full Nigh...
 
Kisan Call Centre - To harness potential of ICT in Agriculture by answer farm...
Kisan Call Centre - To harness potential of ICT in Agriculture by answer farm...Kisan Call Centre - To harness potential of ICT in Agriculture by answer farm...
Kisan Call Centre - To harness potential of ICT in Agriculture by answer farm...
 
INDIA QUIZ 2024 RLAC DELHI UNIVERSITY.pptx
INDIA QUIZ 2024 RLAC DELHI UNIVERSITY.pptxINDIA QUIZ 2024 RLAC DELHI UNIVERSITY.pptx
INDIA QUIZ 2024 RLAC DELHI UNIVERSITY.pptx
 
mini mental status format.docx
mini    mental       status     format.docxmini    mental       status     format.docx
mini mental status format.docx
 
1029-Danh muc Sach Giao Khoa khoi 6.pdf
1029-Danh muc Sach Giao Khoa khoi  6.pdf1029-Danh muc Sach Giao Khoa khoi  6.pdf
1029-Danh muc Sach Giao Khoa khoi 6.pdf
 
Call Girls in Dwarka Mor Delhi Contact Us 9654467111
Call Girls in Dwarka Mor Delhi Contact Us 9654467111Call Girls in Dwarka Mor Delhi Contact Us 9654467111
Call Girls in Dwarka Mor Delhi Contact Us 9654467111
 
Disha NEET Physics Guide for classes 11 and 12.pdf
Disha NEET Physics Guide for classes 11 and 12.pdfDisha NEET Physics Guide for classes 11 and 12.pdf
Disha NEET Physics Guide for classes 11 and 12.pdf
 
The Most Excellent Way | 1 Corinthians 13
The Most Excellent Way | 1 Corinthians 13The Most Excellent Way | 1 Corinthians 13
The Most Excellent Way | 1 Corinthians 13
 
Introduction to Nonprofit Accounting: The Basics
Introduction to Nonprofit Accounting: The BasicsIntroduction to Nonprofit Accounting: The Basics
Introduction to Nonprofit Accounting: The Basics
 
Beyond the EU: DORA and NIS 2 Directive's Global Impact
Beyond the EU: DORA and NIS 2 Directive's Global ImpactBeyond the EU: DORA and NIS 2 Directive's Global Impact
Beyond the EU: DORA and NIS 2 Directive's Global Impact
 
Mattingly "AI & Prompt Design: Structured Data, Assistants, & RAG"
Mattingly "AI & Prompt Design: Structured Data, Assistants, & RAG"Mattingly "AI & Prompt Design: Structured Data, Assistants, & RAG"
Mattingly "AI & Prompt Design: Structured Data, Assistants, & RAG"
 
Código Creativo y Arte de Software | Unidad 1
Código Creativo y Arte de Software | Unidad 1Código Creativo y Arte de Software | Unidad 1
Código Creativo y Arte de Software | Unidad 1
 
POINT- BIOCHEMISTRY SEM 2 ENZYMES UNIT 5.pptx
POINT- BIOCHEMISTRY SEM 2 ENZYMES UNIT 5.pptxPOINT- BIOCHEMISTRY SEM 2 ENZYMES UNIT 5.pptx
POINT- BIOCHEMISTRY SEM 2 ENZYMES UNIT 5.pptx
 
Arihant handbook biology for class 11 .pdf
Arihant handbook biology for class 11 .pdfArihant handbook biology for class 11 .pdf
Arihant handbook biology for class 11 .pdf
 
Separation of Lanthanides/ Lanthanides and Actinides
Separation of Lanthanides/ Lanthanides and ActinidesSeparation of Lanthanides/ Lanthanides and Actinides
Separation of Lanthanides/ Lanthanides and Actinides
 
Activity 01 - Artificial Culture (1).pdf
Activity 01 - Artificial Culture (1).pdfActivity 01 - Artificial Culture (1).pdf
Activity 01 - Artificial Culture (1).pdf
 
Mastering the Unannounced Regulatory Inspection
Mastering the Unannounced Regulatory InspectionMastering the Unannounced Regulatory Inspection
Mastering the Unannounced Regulatory Inspection
 

Journal of Monetary Economics 22 (1988) 3-42. North-Holland.docx

  • 1. Journal of Monetary Economics 22 (1988) 3-42. North-Holland ON THE MECHANICS OF ECONOMIC DEVELOPMENT* Robert E. LUCAS, Jr. University of Chicago, Chicago, 1L 60637, USA Received August 1987, final version received February 1988 This paper considers the prospects for constructing a neoclassical theory of growth and interna- tional trade that is consistent with some of the main features of economic development. Three models are considered and compared to evidence: a model emphasizing physical capital accumula- tion and technological change, a model emphasizing human capital accumulation through school- ing. and a model emphasizing specialized human capital accumulation through learning-by-doing. 1. Introduction By the problem of economic development I mean simply the problem of accounting for the observed pattern, across countries and across time, in levels and rates of growth of per capita income. This may seem too narrow a definition, and perhaps it is, but thinking about income patterns will neces- sarily involve us in thinking about many other aspects of
  • 2. societies too. so I would suggest that we withhold judgment on the scope of this definition until we have a clearer idea of where it leads us. The main features of levels and rates of growth of national incomes are well enough known to all of us, but I want to begin with a few numbers, so as to set a quantitative tone and to keep us from getting mired in the wrong kind of details. Unless I say otherwise, all figures are from the World Bank's World Development Report of 1983. The diversity across countries in measured per capita income levels is literally too great to be believed. Compared to the 1980 average for what the WorId Bank calls the 'industrial market economies' (Ireland up through Switzerland) of U.S. $10,000, India's per capita income is $240, Haiti's is $270, *This paper was originally written for the Marshall Lectures, given at Cambridge University in 1985. ! am very grateful to the Cambridge faculty for this honor, and also for the invitatiou's long lead time, which gave me the opportunity to think through a new topic with the stimulus of so distinguished an audience in prospect. Since then, versions of this lecture have been given as the David Horowitz Lectures in Israel, the W.A. Mackintosh Lecture at Queens University, the Carl Snyder Memorial Lecture at the University of California at Santa Barbara, the Chung-Hua
  • 3. Lecture in Taipei. the Nancy Schwartz Lecture at Northwestern University, and the Lionel McKenzie Lecture at the University of Rochester. I have also based several seminars on various parts of this material. 0304-3932j88j$3.50©1988, Elsevier Science Publishers B.V. (North-Holland) 4 R. E. Lucas, Jr., On the mechanics of economic development and so on for the rest of the very poorest countries. This is a difference of a factor of 40 in living standards! These latter figures are too low to sustain life in, say, England or the United States, so they cannot be taken at face value and I will avoid hanging too much on their exact magnitudes. But I do not think anyone will argue that there is not enormous diversity in living stan- dards. I Rates of growth of real per capita GNP are also diverse, even over sustained periods. For 1960-80 we observe, for example: India, 1.4% per year; Egypt, 3.4%; South Korea, 7.0%; Japan, 7.1 %; the United States, 2.3%; the industrial economies averaged 3.6%. To obtain from growth rates the number of years it takes for incomes to double, divide these numbers into 69 (the log of 2 times 100). Then Indian incomes will double every 50 years; Korean
  • 4. every 10. An Indian will, on average, be twice as well off as his grandfather; a Korean 32 times. These differences are at least as striking as differences in income levels, and in some respects more trustworthy, since within-country income compari- sons are easier to draw than across-country comparisons. I have not calculated a correlation across countries between income levels and rates of growth, but it would not be far from zero. (The poorest countries tend to have the lowest growth; the wealthiest next; the 'middle- income' countries highest.) The generalizations that strike the eye have to do with variability within these broad groups: the rich countries show little diversity (Japan excepted - else it would not have been classed as a rich country in 1980 at all). Within the poor countries (low and middle income) there is enormous variability. 2 Within the advanced countries, growth rates tend to be very stable over long periods of time, provided one averages over periods long enough to eliminate business-cycle effects (or corrects for short-term fluctuations in some other way). For poorer countries, however, there are many examples of sudden, large changes in growth rates, both up and down. Some of these changes are no doubt due to political or military disruption: Angola's total GDP
  • 5. growth fell from 4.8 in the 60s to - 9.2 in the 70s; Iran's fell from 11.3 to 2.5, comparing the same two periods. I do not think we need to look to economic theory for an account of either of these declines. There are also some striking examples 1 The income estimates reported in Summers and Heston (1984) are more satisfactory than those in the World Development Reports. In 1975 U.S. dollars, these authors estimate 1980 U.S. real GDP per capita at $8000, and for the industrialized economies as a group, $5900. The comparable figures for India and Haiti are $460 and $500, respectively. Income differences of a factor of 16 are certainly smaJler, and J think more accurate, than a factor of 40, but I think they are still fairly described as exhibiting 'enormous diversity'. 2 Baumol (1986) summarizes evidence, mainly from Maddison (1982) indicating apparent convergence during this century to a common path of the income levels of the wealthiest countries. But De Long (1987) shows that this effect is entirely due to 'selection bias': If one examines the countries with the highest income levels at the beginning of the century (as opposed to currently, as in Maddison's 'sample') the data show apparent divergence! R.E. Lucas. Jr., On the mechanics of economic development 5 of sharp increases in growth rates. The four East Asian
  • 6. 'miracles' of South Korea, Taiwan, Hong Kong and Singapore are the most familiar: for the 1960-80 period, per capita income in these economies grew at rates of 7.0, 6.5, 6.8 and 7.5, respectively, compared to much lower rates in the 1950's and earlier. 3,4 Between the 60s and the 70s, Indonesia's GDP growth increased from 3.9 to 7.5; Syria's from 4.6 to 10.0. I do not see how one can look at figures like these without seeing them as representing possibilities. Is there some action a government of India could take that would lead the Indian economy to grow like Indonesia's I)r Egypt's? If so, what, exactly? If not, what is it about the' nature of India' that makes it so? The consequences for human welfare involved in questions like these are simply staggering: Once one starts to think about them, it is hard to think about anything else. This is what we need a theory of economic development for: to provide some kind of framework for organizing facts like these, for judging which represent opportunities and which necessities. But the term' theory' is used in so many different ways, even within economics, that if I do not clarify what I mean by it early on, the gap between what I think I am saying and what you think you are hearing will grow too wide for us to have a
  • 7. serious discussion. I prefer to use the term' theory' in a very narrow sense, to refer to an explicit dynamic system, something that can be put on a computer and run. This is what I mean by the' mechanics' of economic development - the construction of a mechanical, artificial world, populated by the interacting robots that economics typically studies, that is capable of exhibiting behavior the gross features of which resemble those of the actual world that I have just described. My lectures will be occupied with one such construction, and it will take some work: It is easy to set out models of economic growth based on reasonable- looking axioms that predict the cessation of growth in a few decades, or that predict the rapid convergence of the living standards of different economies to a common level, or that otherwise produce logically possible outcomes that bear no resemblance to the outcomes produced by actual economic systems. On the other hand, there is no doubt that there must be mechanics other than the ones I will describe that would fit the facts about as well as mine. This is why I have titled the lectures 'On the Mechanics ... ' rather than simply 'The Mechanics of Economic Development'. At some point, then, the study of development will need to involve working out the implications of competing theories for data other than those they were constructed to fit,
  • 8. and testing these implications against observation. But this is getting far ahead of the 3The World Bank no longer transmits data for Taiwan. The figure 6.5 in the text is from Harberger (1984, table 1, p. 9). 4According to Heston and Summers (1984), Taiwan's per-capita GDP growth rate in the 1950s was 3.6. South Korea's was 1.7 from 1953 to 1960. 6 R.E. Lucas. Jr., On the mechanics of economic development story I have to tell, which will involve leaving many important questions open even at the purely theoretical level and will touch upon questions of empirical testing hardly at all. My plan is as follows. I will begin with an application of a now- standard neoclassical model to the study of twentieth century U.S. growth, closely following the work of Robert Solow, Edward Denison and many others. I will then ask, somewhat unfairly, whether this model as it stands is an adequate model of economic development, concluding that it is not. Next, I will consider two adaptations of this standard model to include the effects of human capital accumulation. The first retains the one-sector character of the
  • 9. original model and focuses on the interaction of physical and human capital accumulation. The second examines a two-good system that admits specialized human capital of different kinds and offers interesting possibilities for the interaction of trade and development. Finally, I will turn to a discussion of what has been arrived at and of what is yet to be done. In general, I will be focusing on various aspects of what economists, using the term very broadly, call the' technology'. I will be abstracting altogether from the economics of demography, taking population growth as a given throughout. This is a serious omission, for which I can only offer the excuse that a serious discussion of demographic issues would be at least as difficult as the issues I will be discussing and I have neither the time nor the knowledge to do both. I hope the interactions between these topics are not such that they cannot usefully be considered separately, at least in a preliminary way. 5 I will also be abstracting from all monetary matters, treating all exchange as though it involved goods-for-goods. In general, I believe that the importance of financial matters is very badly over-stressed in popular and even much professional discussion and so am not inclined to be apologetic for going to the other extreme. Yet insofar as the development of financial
  • 10. institutions is a limiting factor in development more generally conceived I will be falsifying the picture, and I have no clear idea as to how badly. But one cannot theorize about everything at once. I had better get on with what I do have to say. 2. Neoclassical growth theory: Review The example, or model, of a successful theory that I will try to build on is the theory of economic growth that Robert Solow and Edward Denison developed and applied to twentieth century U.S. experience. This theory will serve as a basis for further discussion in three ways: as an example of the form that I believe useful aggregative theories must take, as an opportunity to 5Becker and Barro (1985) is the first attempt known to me to analyze fertility and capital accumulation decisions simultaneously within a general equilibrium framework. Tamura (1986) contains further results along this line. R.E. Lucas, Jr., On the mechanics of economic development 7 explain exactly what theories of this form can tell us that other kinds of theories cannot, and as a possible theory of economic development. In this third capacity, the theory will be seen to fail badly, but also
  • 11. suggestively. Following up on these suggestions will occupy the remainder of the lectures. Both Solow and Denison were attempting to account for the main features of U.S. economic growth, not to provide a theory of economic development, and their work was directed at a very different set of observations from the cross-country comparisons I cited in my introduction. The most useful summary is provided in Denison's 1961 monograph, The Sources of Economic Growth in the United States. Unless otherwise mentioned, this is the source for the figures I will cite next. During the 1909-57 period covered in Denison's study, U.S. real output grew at an annual rate of 2.9%, employed manhours at 1.3%, and capital stock at 2.4%. The remarkable feature of these figures, as compared to those cited earlier, is their stability over time. Even if one takes as a starting point the trough of the Great Depression (1933) output growth to 1957 averages only 5%. If business-cycle effects are removed in any reasonable way (say, by using peak-to-peak growth rates) U.S. output growth is within half a percentage point of 3% annually for any sizeable subperiod for which we have data. Solow (1956) was able to account for this stability, and also for
  • 12. some of the relative magnitudes of these growth rates, with a very simple but also easily refineable model. 6 There are many variations of this model in print. I will set out a particularly simple one that is chosen also to serve some later purposes. I will do so without much comment on its assumed structure: There is no point in arguing over a model's assumptions until one is clear on what questions it will be used to answer. We consider a closed economy with competitive markets, with identical, rational agents and a constant returns technology. At date t there are N( t) persons or, equivalently, manhours devoted to production. The exogenously given rate of growth of N( t) is A. Real, per-capita consumption is a stream c(t), t ~ 0, of units of a single good. Preferences over (per- capita) consumption streams are given by i oo e-pt_l_[c(t)l-o-I]N(t)dt, o I-a (1) 6 Solow's 1956 paper stimulated a vast literature in the 1960s, exploring many variations on the original one-sector structure. See Burmeister and Dobell (1970)
  • 13. for an excellent introduction and survey. By putting a relatively simple version to empirical use, as I shall shortly do, I do not intend a negative comment on this body of research. On the contrary, it is exactly this kind of theoretical experimentation with alternative assumptions that is needed to give one the confidence that working with a particular, simple parameterization may, for the specific purpose at hand, be adequate. 8 R.E. Lucas, Jr., On the mechanics of economic development where the discount rate p and the coefficient of (relative) risk aversion 0 are both positive. 7 Production per capita of the one good is divided into consumption c( t) and capital accumulation. If we let K(t) denote the total .stock of cal?ital, and K(t) its rate of change, then total output is N(t)c(t) + K(t). [Here K(t) is net investment and total output N(t)c(t) + K(t) is identified with net national product.] Production is assumed to depend on the levels of capital and labor inpu ts and on the level A ( t) of the 'technology', according to (2) where 0 < f3 < 1 and where the exogenously given rate of technical change, A/A, is p. > O.
  • 14. The resource allocation problem faced by this simple economy is simply to choose a time path c( t) for per-capita consumption. Given a path c(t) and an initial capital stock K(O), the technology (2) then implies a time path K( t) for capital. The paths A(t) and N(t) are given exogenously. One way to think abou t this allocation problem is to think of choosing c(t) at each date, given the values of K(t), A(t) and N(t) that have been attained by that date. Evidently, it will not be optimal to choose c( t) to maximize current-period utility, N(t)[1j(1 - o)][c(t) - 1]1-0, for the choice that achieves this is to set net investment K(t) equal to zero (or, if feasible, negative): One needs to set some value or price on increments to capital. A central construct in the study of optimal allocations, allocations that maximize utility (1) subject to the technology (2), is the current-value Hamiltonian H defined by N H(K, 8, c, t) = -1-[c1- O -1] + 8[AK.8N 1-.8 - Nc], -0 which is just the sum of current-period utility and [from (2)] the rate of increase of capital, the latter valued at the' price' 8( t). An optimal allocation must maximize the expression H at each date t, provided the price O( t) is
  • 15. correctly chosen. The first-order condition for maximizing H with respect to c is (3) which is to say that goods must be so allocated at each date as to be equally valuable, on the margin, used either as consumption or as investment. It is 7The inverse a -I of the coefficient of risk aversion is sometimes called the intertemporal elasticity of substitution. Since all the models considered in this paper are deterministic, this latter terminology may be more suitable. R.E. Lucas, Jr., On the mechanics 0/ economic development known that the price 8( t) must satisfy . a 8(t) = p8(t) - aKH(K(t),8(t),c(t), t) = [p - f3A ( t ) N ( t )1-f3 K ( t ) f3 - 1] 8 ( t ) , 9 (4) at each date t if the solution c(t) to (3) is to yield an optimal path (c(t»~=o. Now if (3) is used to express c(t) as a function 8(1), and this function 8- 1/ 0
  • 16. is substituted in place of c(t) in (2) and (4), these two equations are a pair of first-order differential equations in K (t) and its 'price' 8(1). Solving this system, there will be a one-parameter family of paths (K (t), 8( t», satisfying the given initial condition on K(O). The unique member of this family that satisfies the transversality condition: lim e- pt8(t)K(t) = 0 t-+ 00 (5) is the optimal path. I am hoping that this application of Pontryagin's Maxi- mum Principle, essentially taken from David Cass (1961), is familiar to most of you. I will be applying these same ideas repeatedly in what follows. For this particular model, with convex preferences and technology and with no external effects of any kind, it is also known and not at all surprising that the optimal program characterized by (2), (3), (4) and (5) is also the unique competitive equilibrium program, provided either that all trading is consum- mated in advance, Arrow-Debreu style, or (and this is the interpretation I favor) that consumers and firms have rational expectations about future prices. In this deterministic context, rational expectations just means
  • 17. perfect fore- sight. For my purposes, it is this equilibrium interpretation that is most interesting: I intend to use the model as a positive theory of U.S. economic growth. In order to do this, we will need to work out the predictions of the model in more detail, which involves solving the differential equation system so we can see what the equilibrium time paths look like and compare them to observa- tions like Denison's. Rather than carry this analysis through to completion, I will work out the properties of a particular solution to the system and then just indicate briefly how the rest of the answer can be found in Cass's paper. Let us construct from (2), (3) and (4) the system's balanced growth path: the particular solution (K(t), 8(1), c(t» such that the rates of growth of each of these variables is constant. (I have never been sure exactly what it is that is 'balanced' along such a path, but we need a term for solutions with this constant growth rate property and this is as good as any.) Let K denote the rate of growth of per-capita consumption, c(t)jc(t), on a balanced growth 10 R.E. Lucas, Jr., On the mechanics of economic development
  • 18. path. Then from (3), we have 8(t)/8(t) = -al(. Then from (4), we must have f3A ( t ) N ( t ) 1 - fJ K ( t ) fJ - 1 = P + aI( . (6) That is, along the balanced path, the marginal product of capital must equal the constant value p + al(. With this Cobb-Douglas technology, the marginal product of capital is proportional to the average product, so that dividing (2) through by K( t) and applying (6) we obtain N(t)c(t) K(t) =A( )K( )fJ-11t.T( )l- fJ = p+al( K(t) + K(t) t t iV t 13' (7) By definition of a balanced path, K(t)/K(t) is constant so (7) implies that N( t )c(t)/K( t) is constant or, differentiating, that K(t) N(t) c(t) --=--+--=I(+A K(t) N(t) c(t) . (8) Thus per-capita consumption and per-capita capital grow at the common rate 1(. To solve for this common rate, differentiate either (6) or (7) to obtain p. 1(= --. 1-13
  • 19. (9) Then (7) may be solved to obtain the constant, balanced consumption-capital ratio N(t)c(t)/K(t) or, which is equivalent and slightly easier to interpret, the constant, balanced net savings rate s defined by K(t) f3(I(+A) s= =--- N(t)c(t)+K(t) p+al(' (10) Hence along a balanced path, the rate of growth of per-capita magnitudes is simply proportional to the given rate of technical change, p., where the constant of proportionality is the inverse of labor's share, 1 - 13. The rate of time preference p and the degree of risk aversion a have no bearing on this long-run growth rate. Low time preference p and low risk aversion a induce a high savings rate s, and high savings is, in turn, associated with relatively high output levels on a balanced path. A thrifty society will, in the long run, be wealthier than an impatient one, but it will not grow faster. In order that the balanced path characterized by (9) and (10) satisfy the transversality condition (5), it is necessary that p + al( > I( + A. [From (10), one sees that this is the same as requiring the savings rate to be less than capital's
  • 20. R.E. Lucas, Jr., On the mechanics of economic development 11 share.] Under this condition, an economy that begins on the balanced path will find it optimal to stay there. What of economies that begin off the balanced path - surely the normal case? Cass showed - and this is exactly why the balanced path is interesting to us - that for any initial capital K(O) > 0, the optimal capital-consumption path (K(t), c(t» will converge to the balanced path asymptotically. That is, the balanced path will be a good approximation to any actual path 'most' of the time. Now given the taste and technology parameters (p, 0, X, f3 and JL) (9) and (10) can be solved for the asymptotic growth rate K of capital, consumption and real output, and the savings rate s that they imply. Moreover, it would be straightforward to calculate numerically the approach to the balanced path from any initial capital level K (0). This is the exercise that an idealized planner would go through. Our interest in the model is positive, not normative, so we want to go in the opposite direction and try to infer the underlying preferences and technology from what we can observe. I will outline this, taking the
  • 21. balanced path as the model's prediction for the behavior of the U.S. economy during the entire (1909-57) period covered by Denison's study.8 From this point of view, Denison's estimates provide a value of 0.013 for X, and two values, 0.029 and 0.024 for K + X, depending on whether we use output or capital growth rates (which the model predicts to be equal). In the tradition of statistical inference, let us average to get K + X= 0.027. The theory predicts that 1 - f3 should equal labor's share in national income, about 0.75 in the U.S., averaging over the entire 1909-57 period. The savings rate (net investment over NNP) is fairly constant at 0.10. Then (9) implies an estimate of 0.0105 for JL. Eq. (10) implies that the preference parameters p and 0 satisfy p + (0.014)0 = 0.0675. (The parameters p and 0 are not separately identified along a smooth consumption path, so this is as far as we can go with the sample averages I have provided.) These are the parameter values that give the theoretical model its best fit to the U.S. data. How good a fit is it? Either output growth is underpredicted or capital growth overpredicted, as remarked earlier (and in the theory of growth, a half a percentage point is a large discrepancy). There are
  • 22. interesting secular changes in manhours per household that the model assumes away, and labor's share is secularly rising (in all growing economies), not constant as assumed. There is, in short, much room for improvement, even in accounting for the secular changes the model was designed to fit, and indeed, a fuller review of 8With the parameter values described in this paragraph, the half-life of the approximate linear system associated with this model is about eleven years. 12 R.E. Lucas, Jr., On the mechanics of economic development the literature would reveal interesting progress on these and many other fronts. 9 A model as explicit as this one, by the very nakedness of its simplify- ing assumptions, invites criticism and suggests refinements to itself. This is exactly why we prefer explicitness, or why I think we ought to. Even granted its limitations, the simple neoclassical model has made basic contributions to our thinking about economic growth. Qualitatively, it empha- sizes a distinction between 'growth effects' - changes in parameters that alter growth rates along balanced paths - and 'level effects' - changes that raise or lower balanced growth paths without affecting their slope - that is fundamen-
  • 23. tal in thinking about policy changes. Solow's 1956 conclusion that changes in savings rates are level effects (which transposes in the present context to the conclusion that changes in the discount rate, P, are level effects) was startling at the time, and remains widely and very unfortunately neglected today. The influential idea that changes in the tax structure that make savings more attractive can have large, sustained effects on an economy's growth rate sounds so reasonable, and it may even be true, but it is a clear implication of the theory we have that it is not. Even sophisticated discussions of economic growth can often be confusing as to what are thought to be level effects and what growth effects. Thus Krueger (1983) and Harberger (1984), in their recent, very useful surveys of the growth experiences of poor countries, both identify inefficient barriers to trade as a limitation on growth, and their removal as a key explanation of several rapid growth episodes. The facts Krueger and Harberger summarize are not in dispute, but under the neoclassical model just reviewed one would not expect the removal of inefficient trade barriers to induce sustained increases in growth rates. Removal of trade barriers is, on this theory, a level effect, analogous to the one-time shifting upward in production possibilities,
  • 24. and not a growth effect. Of course, level effects can be drawn out through time through adjustment costs of various kinds, but not so as to produce increases in growth rates that are both large and sustained. Thus the removal of an inefficiency that reduced output by five percent (an enormous effect) spread out over ten years in simply a one-half of one percent annual growth rate stimulus. Inefficiencies are important and their removal certainly desirable, but the familiar ones are level effects, not growth effects. (This is exactly why it is not paradoxical that centrally planned economies, with allocative inefficiencies of legendary proportions, grow about as fast as market economies.) The empirical connections between trade policies and economic growth that 9In particular, there is much evidence that capital stock growth, as measured by Denison, understates true capital growth due to the failure to correct price deflators for quality improve- ments. See, for example, Griliches and Jorgenson (1967) or Gordon (1971). These errors may well account for all of the 0.005 discrepancy noted in the text (or more!). Boxall (1986) develops a modification of the Solow-Cass model in which labor supply is variable, and which has the potential (at least) to account for long-run changes in manhours.
  • 25. R. E. Lucas, Jr., On the mechanics of economic development 13 Krueger and Harberger document are of evident importance, but they seem to me to pose a real paradox to the neoclassical theory we have, not a confirma- tion of it. The main contributions of the neoclassical framework, far more important than its contributions to the clarity of purely qualitative discussions, stem from its ability to quantify the effects of various influences on growth. Denison's monograph lists dozens of policy changes, some fanciful and many others seriously proposed at the time he wrote, associating with each of them rough upper bounds on their likely effects on U.S. growth. 1o In the main, the theory adds little to what common sense would tell us about the direction of each effect - it is easy enough to guess which changes stimulate production, hence savings, and hence (at least … The Lahore Journal of Economics 13 : 1 (Summer 2008): pp. 1-27 16 Qaisar Abbas and James Foreman-Peck Human Capital and Economic Growth: Pakistan, 1960-2003 15Human Capital and Economic Growth: Pakistan, 1960-2003
  • 26. Qaisar Abbas*, James Foreman-Peck**Abstract This paper investigates the relationship between human capital and economic growth in Pakistan with aggregate time series data. Estimated with the Johansen (1991) approach, the fitted model indicates a critical role for human capital in boosting the economy’s capacity to absorb world technical progress. Much higher returns, including spillovers, to secondary schooling in Pakistan than in OECD economies is consistent with very substantial education under-investment in Pakistan. Similarly, extremely large returns to health spending compare very favorably with industrial investment. Human capital is estimated to have accounted for just under one-fifth of the increase in Pakistan’s GDP per head. Since the 1990s, the impact of deficient human capital policies is shown by the negative contribution to economic growth. JEL Classification: C13, C22, C51, O15, O53 Keywords:Human Capital, Economic Growth, Cointegration, Pakistan 1. Introduction Human capital plays a key role in both neoclassical and endogenous growth models (Mankiw, Romer and Weil, 1992; Rebelo, 1991; Sianesi and Van Reenen, 2003). The critical difference is that in the first group, economic growth is ultimately driven by exogenous technical progress. Diminishing returns to accumulated factors, including human capital, eventually halt growth in a neoclassical model, in the absence of intervention from outside influences. Policy changes can raise the level of productivity but not the long run growth rate. Endogenous growth models, on the other hand, need no additional explanation, for human capital investment propels knowledge creation without diminishing returns. A permanent alteration in some policy variable can cause a permanent change in an economy’s growth rate.
  • 27. Unlike time series evidence for the United States, at first sight the data for many developing economies could be broadly consistent with this prediction (Jones, 1995). Since political independence for these countries after 1945 was accompanied by major policy changes, the shifts could be responsible for accelerated growth after this date in an endogenous growth model . However, Parente and Prescott (1999, 2000) point out that the technical progress in an extended neoclassical model can alter in response to policy as well. Individual choices determine the pace of productivity increase, when time is diverted from normal work to activities that improve technology. These activities can draw on the world stock of knowledge and borrow capital on world markets. Policy-induced constraints, such as taxation, international capital controls, or entry barriers to industries, create disincentives to do so. They give rise to international differences in levels and growth of aggregate productivity, even when the stock of useful knowledge is potentially common to all countries. For economies behind the world technological frontier, productivity growth is likely to depend critically upon the spread and absorption of technology, rather than upon the generation of new knowledge (Nelson and Phelps, 1966; Benhabib and Spiegel, 2002). Absorptive capacity depends on national institutions and policies; openness to foreign direct investment, regulation of intellectual property rights, and exchange rate regimes affect a follower economy’s imports of technology, as well as the generation of new useful knowledge (Shapiro, 2005). But the stock of skills, and the education and training that create them, is likely to be vital to utilizing foreign know-how, in addition to functioning as a conventional factor of production (Saggi, 2002). Human capital is not restricted to knowledge. Health has been
  • 28. found to be a positive and significant contributor to economic growth in many empirical cross-country models (Bloom and Canning 2000, 2003). Measured simply as life expectancy, health human capital can effect economic growth in several ways. As people live longer, they may save more for old age. Life expectancy can also serve as proxy for the heath status of the whole population, because declines in mortality rates are related to falls in morbidity. Important as this form of human capital may be, it will not contribute to technology transfer, in contrast to education and training. Despite the theoretical significance of knowledge human capital, the empirical evidence from cross-country studies is very mixed. Pungo (1996) showed that the Mankiw et al. (1992) (MRW) human capital-augmented neoclassical specification exhibits structural breaks, such that the coefficient on human capital is insignificant for a sample of labor-abundant countries and if influential observations are excluded. A possible reason for these last results is that schooling in developing economies tends to be of low and very variable quality . In Pakistan, the largest learning gaps are between primary schools. The divergence in English test scores between government and private schools is 12 times that between children from rich and poor families (Das, Pandey and Zajonc, 2006). Another possible contributor to the lack of impact evidence for knowledge capital is the central contribution of the state in schooling. Variations in the effectiveness and magnitude of state schooling spending, together with the way in which taxes are levied to pay for it, can even create a negative correlation with economic growth (Blankenau and Simpson, 2004). Public spending might crowd out private spending on education. Moreover, in the short-term, increasing the proportion of the potential workforce in full time education reduces the workforce and may be expected to lower per capita output. Not
  • 29. surprisingly then, the macroeconomic evidence is unclear about the effects of public education expenditures on economic growth. National economies are likely to be especially diverse in the supply and demand for human capital because of distinctive institutions. Yet most empirical research has been concerned with cross-sections or panels of large numbers of countries, thereby ignoring economy-level institutional differences . National time series studies offer a way of eliminating or reducing such heterogeneity (Durlauf, Johnson and Temple, 2004). For this reason the present paper tests and estimates a time series model of human capital and economic growth for Pakistan over the period 1960-2003. As a low income economy that has invested relatively little in human capital over the past 40 years, Pakistan is an especially helpful case for understanding the relationship with economic growth (Husain, Qasim and Sheikh, 2003) . Most econometric research on human capital in Pakistan has entailed estimating Mincer (1974) earnings functions on micro data. Nasir and Nazli (2001) find each year of education brings approximately 7 percent (private gross) return for wage earners. Another study by Haroon et al. (2003) estimated that the maximum private gross return (16 percent) is associated with higher secondary education. Their results also indicate that private payoffs from primary education declined during the previous decade, while returns to higher secondary and tertiary education rose. Recent research on rural Pakistan by Behrman et al. (2008) shows that ‘social’ and private rates of return to low quality primary schooling versus no schooling were 18.2 percent and 20.5 percent respectively . They also estimated that ‘social’ rates of return to high-quality versus low-quality primary schooling in rural Pakistan were 13.0 percent. Unfortunately, studies of this type are unlikely to
  • 30. capture all indirect benefits of human capital for economic growth, especially the stimulus to technology development and adoption. Therefore, there is a strong case for supplementing them with macroeconomic studies of rates of return, as attempted here. The paper models the impact of human capital on Pakistani economic growth, provides estimates of social rates of return to human capital in Pakistan, and assesses the policy implications of the findings. Section I presents the theoretical framework of the study, setting out the production function and rate of return approach. Section II outlines the experience of human capital investment and development of Pakistan since 1960, with some international comparisons. Section III elaborates the measurement of variables and estimation procedures, explaining why the Johansen approach is necessary. Section IV presents the empirical results and section V discusses the sources of growth implied by the analysis of the preceding section. 2. Theoretical Framework One reason for endogenous growth (in Rebelo, 1991) is that human capital is embodied in labor. This implies that a worker’s improved human capital boosts their productivity but cannot benefit another worker in the same way. The total amount of human capital, H, in an economy is the product of the number of workers and their average embodied human capital. If L is number of workers, the total human capital input is the flow of services from L(H/L) = H. More workers without any human capital add nothing to output, so a growing workforce in itself will drive down output per head at the rate at which it grows. Constant returns to all three factors are equivalent to constant returns to human and physical capital alone. It follows that with constant returns, increased investment in human and physical capital induced by more benign policies,
  • 31. can permanently raise the growth rate of an economy. The steady state growth of output and the two types of capital are obtained by substituting both savings/investment rates into the production function. Ignoring depreciation, if savings and investment in human and physical capital increase from 5 to 10 percent of output, the steady state growth of output and capital rises from 5 to 10 percent. The ratio of human to physical capital in the steady state will not change because their relative accumulation rates are unaltered. Human capital in a neoclassical model has less dramatic but still fundamental effects. A human capital-augmented Cobb- Douglas production function consistent with the estimates of MRW has coefficients of one-third on each of the three factor inputs; a one percent increase in both human and physical capital increases output by only two thirds of a percent. Accumulation at a constant proportion of output therefore adds less and less to output until the steady state is reached, in the absence of technical progress. Hence the neoclassical model must include exogenous technical progress if it is to explain economic growth in the long run. The disembodied human capital of MRW (equation 8) implies that a one percent increase in the work force has a greater positive effect on output than a one percent rise in human capital per worker. With H unchanged, greater L boosts output even though H/L falls. Where Y is real output, A the technology level that shifts exogenously, K physical capital and 0<α, β, γ0 <1 parameters, the neoclassical (Cobb-Douglas) production function is: Y = A K( L( H 0 g
  • 32. = A K( L(+ 0 g (H/L) 0 g (1) For Pakistan, and many developing countries with high population and workforce growth, this disembodied model is more optimistic than an endogenous growth Cobb-Douglas production function specification, discussed above, of: Y = A K( H 0 g = A K( (L (H/L)) 0 g (2) In a low income open economy, technology transfer is likely to be a major source of growth. The scope for transfer will depend on the technological progress of the leaders in the world economy, below assumed to advance at a rate given by the technological frontier economy’s Total Factor Productivity
  • 33. index (F). But technology can only be transferred if an economy has the absorptive capacity. Benhabib and Spiegel (1994) conclude that international technology spillover rates depend on levels of education in the follower countries. So a plausible formulation for a poorer economy allows greater technical progress the higher is the human capital that promotes this capacity. The gap between the follower economy’s technology (A) and the leader’s (F) depends upon the follower’s average human capital and the level of the leader’s technology. Taking logs: ln A- ln F = (γ1ln(H/L)-1)lnF + lnA0 (3) Technical progress, F, is exogenous (neoclassical) to the domestic economy, but the impact of the technology is endogenous. Substituting (3) into the log of (1) shows that there is a complete offset to the rising human capital elasticity with world technical progress; the labor elasticity of output falls as the world technological frontier extends. LnY = lnA0 + (γ0 +γ1 lnF)lnH + α ln K + (β- γ0- γ1 lnF) lnL (4) With the endogenous growth production function, β=0, and the labor output elasticity is the same as the human capital output elasticity. An economy with high workforce growth and weak human capital investment will increasingly miss out as the world technology frontier advances. If L actually grows faster than H, output growth on this account is progressively negative. When, as in (4), human capital supports the absorption of world technology, as well as being a factor of production, the excess of social over private returns may be substantial. Regardless, in a relatively poor economy the returns to factor inputs, including human capital, should be high because of their scarcity. Unfortunately poor quality schooling and an inappropriate
  • 34. syllabus may lower the return to education as a social investment, but as Behrman et al (2008) have shown, even these returns can be high in Pakistan. However, if education is merely a signal, rather than an investment in human capital, private returns may be high although social returns could be low. For this reason, and because of the technological spillover, macro estimation of social rates of return provides information not available from the more common micro studies. With the production function assumed in the present model, rates of return to human capital per worker, as measured by the marginal product, are higher the lower is an economy’s ratio of human capital per worker to output. The full return to human capital includes the technology absorption component γ1ln F/ ((H/Y). (∂Y/∂H) = ((0+γ1ln F)/ ((H/Y) When economic development raises the ratio of human capital to output, the rate of return will be driven down. But if world technical progress, F, is faster than the rise in the human capital output ratio, returns will rise. Whether optimal investment in human capital is achieved might be inferred from the principle that in an efficiently functioning economy, at the margin returns to human and physical assets will be equalized. With human assets, the inability to appropriate returns often deters optimal investment, and thereby allows persistent higher marginal returns, in the absence of adequate investment by non-profit institutions. If the return on comparable alternative physical assets, or on comparable human capital in other economies is known, the measure of underinvestment, the (excess) marginal rate of return on human capital, can be found from the human capital stock to output ratio and ((0+γ1ln F). 3. The Pakistani Economy Since 1960
  • 35. Consistent with the endogenous growth model, in conjunction with a broad policy or environmental shift, Pakistan’s economy experienced an apparent permanent increase in the growth rate by the 1960s. Pakistan’s average annual real GDP growth rate of 5.3 percent since then has not matched those of the East Asian miracle countries. Yet, per capita GDP growth surpassed that of the typical developing country (1.3 percent since the 1960s) with an annual average rate of 2.6 percent. Three groups of Asian countries, now classified as East Asian rapid growers, South Asian developing and Asian least developed, in many respects were at a broadly similar level of economic development in 1960. But by the end of the millennium, there were wide gaps in their per capita incomes. Their human capital endowments, both in terms of education and health, also were hugely different. In the early 1960s, Pakistan was seen around the world as a model of economic development. Many countries sought to emulate Pakistan’s economic planning strategy and one of them, South Korea, copied its second Five Year Plan, 1960-65. In the early 1960s, the per capita income of South Korea was less than double that of Pakistan (Maddison, 2001). But South Korea became by far the more developed, with GNI per capita in 2006 of $22990 compared with Pakistan’s $2410, using purchasing power parity (World Bank, 2007). A possible reason for the divergence, consistent with the fundamental contribution of human capital, is that literacy rates for East Asian developing countries in the early 1960s were as high as 71 percent for the Republic of Korea, and 68 percent for Thailand, while Malaysia achieved a rate of over 50 percent. On the other hand, in all other Asian least developed countries and South Asian developing countries, the literacy rate was low; only 9 percent for Nepal and 16 percent for Pakistan (Table 1).
  • 36. After three decades, during which this group of Asian countries somewhat improved their human capital, literacy rates are still below 50 percent. By contrast, literacy in South Korea reached 98 percent and Malaysia managed a rate of about 90 percent (World Bank, 1982; UNESCO, 1999). Table-1: Human Capital Measures for Pakistan, 1960-2005 Years Indicator 1960 1965 1970 1975 1980 1985 1990 1995 2000 2005 Primary Schooling Enrollment (% of Age Group) 20.4 27.4 30.3 38.2 32.1 35.8 47.5 57.3 60.5 68.1 Secondary Schooling Enrollment (% of Age Group) 3.4 4.6 5.7 7.0 6.4
  • 37. 7.3 9.6 12.2 11.6 12.0 Literacy Rate 16.7 16.8 20.9 24.3 26.1 28.8 33.8 39.6 47.1 52.5 Public Spending on Education (% of GDP) 0.9 1.8 2.5 2.2 2.0 2.7 2.7 2.2 2.0 2.5 Public spending on health (% of GDP) 0.4 0.6 0.5 0.6 0.6 0.8 1.0 0.7
  • 38. 0.7 0.6 Life Expectancy 43.9 46.7 49.4 52.3 55.1 57.4 59.1 60.9 63.0 66.0 Source: State Bank of Pakistan (2006), UNESCO Yearbooks (Various Issues), World Bank (Various Issues). Another potential contributor to the divergence is health. Measured by life expectancy at birth across the three groups of countries in the Asian region, health shows a similar pattern to literacy. In the 1960s, life expectancy at birth was below 45 years in all Asian least developed countries and South Asian developing countries. On the other hand, the East Asian developing countries had life expectancies well over 50 years, with the Republic of Korea achieving a figure of over 54 years, followed by the 53 years of Malaysia and 51 years for Thailand (World Bank, 1984). In the late 1990s, the Asian least developed countries and South Asian developing countries enhanced their life expectancy to more than 60 years, at least in the case of Pakistan, India, Bangladesh and Bhutan. Yet the life expectancy rate in both Malaysia and Korea is remains much higher; of the order of more than 72 years, with Thailand reaching a figure of 69 years. Nonetheless human capital has grown in Pakistan. Table-1 shows that primary and secondary schooling enrolment in Pakistan increased substantially in the years after 1960. However public spending on education as a proportion of GDP
  • 39. stopped rising on trend after 1970, while public spending on health peaked as a proportion of GDP in 1990. Human capital per head, as measured by the secondary schooling stock per worker (lnsstpw, Figure-1), increased strongly in the 1960s and in the second half of the 1980s. During the later 1990s the stock fell; the endogenous growth model of the previous section predicts adverse output consequences, for in 2005 the stock was lower than in 1995. Schooling, particularly in rural areas, remained problematic despite land and other reforms during the 1960s. In 1962, four tiers of government were introduced and each was assigned responsibilities in both rural and urban areas, such as maintenance of primary schools, public roads, and bridges. Much military and economic aid was received and the capital- labor ratio (lnkspw, figure 1) rose most rapidly in this decade. But aid was reduced in 1965, when another war with India over Kashmir broke out. Later the Tashkent agreement of 1966 mediated the conflict. The longer term impact of the war on the economy though was severe, ultimately triggering a downturn in real GDP per worker (lnrgdppw) and the employed labor force (lnelf) between 1967 and 1968 (figure 1). The 1970s were a difficult decade for some forms of human capital accumulation and economic growth. A third war between India and Pakistan in 1971, the upheaval associated with the establishment of Bangladesh in January 1972, the first oil crisis in 1974 and the populist and restrictive economic policies of new political regime of 1971-77, all adversely affected the economy. After 1973, Prime Minister Zulfikar Bhutto nationalized basic industries, insurance companies, domestically-owned banks, and schools and colleges. The proportion of the workforce with secondary schooling fell in the first half of the decade. Table 1 shows that school enrolments as a proportion of the relevant age group were lower in 1980 than in 1975 and figure 1 reveals a stagnation of the secondary
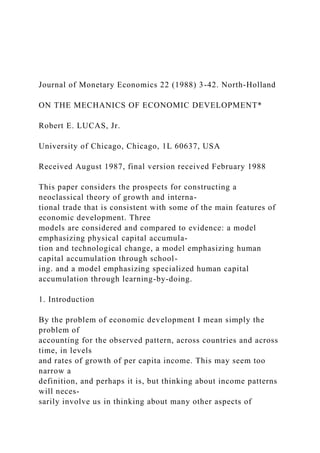
  • 40. schooling stock per worker (lnsstpw) in the 1970s. Some incomplete structural reform efforts were implemented in the 1990s. Output and employment fell between 1990 and 1991 but recovered the following year. The second half of the decade was marked by economic uncertainty associated with heightened domestic and regional political tensions. The 1998 nuclear explosions and consequent sanctions, coupled with drought and unsustainable debt, gave rise to macroeconomic instability. Interest payments and military spending by the government exceeded 50 percent of consolidated government spending, shrinking the relative size of public sector development spending, and leaving only limited resources for state-funded education, health and physical infrastructure. External balances deteriorated significantly and foreign reserves fell to dangerously low levels (World Bank, 2002). Health spending as a proportion of GDP (lnhegdp, figure 1) declined. According to the model of the previous section, returns to human capital should be very high because investment has been so low. But resource misallocation could hold down returns in practice. Figure-1: Pakistani Growth Variables 1960-2005 (Logarithmic) 7.6 7.8 8.0 8.2 8.4 8.6 8.8 9.0 60 65 70 75
  • 45. LNHEGDP -16 -14 -12 -10 -8 -6 -4 60657075808590950005 SSMFP Since 1999, the government committed itself to reversing Pakistan’s poor economic performance with a major macroeconomic stabilization effort and structural reforms aimed at strengthening microeconomic fundamentals. Employment (lnelf) growth faltered between 1999 and 2000 but quickly resumed. Real output (lnrgdppw) fell for two consecutive years but in 2002 jumped to a previously unattained height (figure 1). Fiscal measures included the privatization of state-owned banks and strengthening the role of State Bank of Pakistan, together with reform of telecoms and trade policy. Expansion of the U.S. and E.U. textile quotas further helped to stabilize and revive the economy. Economic growth exceeded the 5 percent mark in 2003 for the first time since the mid 1990s, and reached 6 percent in 2004 (World Bank, 2006). In the modeling below we assess what difference these changes have made. 4. Measurement, Specification and Estimation Assessing how policy shifts influenced the formation of knowledge human capital first requires definition and measurement. Only proxies, such as the number of graduates, average years of education, literacy rates, school enrolment ratios or proportion of the population that has completed
  • 46. schooling at different levels of education, are available. They do not fully match the concept of knowledge capital. The production function model postulates a flow of productive services from the human capital stock. More output is generated by an increase in the human capital, so long as the service flow is proportional to the stock. The increase in the stock is gross investment minus depreciation. So for example, considering the stock of workers with secondary education, more secondary educated young people may enter the workforce every year, but both secondary educated and uneducated people leave each year as well. It is the difference between these two magnitudes that is relevant for economic growth, though for the level of gross income, simply the flow generated by the stock of secondary educated workers is pertinent. When considering year to year variations in human capital, these measurement issues matter particularly. In the case of an increase in the proportion of the relevant age group attending school from one year to the next, while the eventual effect may be to increase human capital services, the immediate effect is to reduce the supply of unskilled labor. If they would have been productive, this will have a negative impact on output, even though eventually there will be a greater positive effect. Given the limited availability of the data, the proxies for human capital here considered are as follows. · The stock of human capital at the secondary level of education is defined as the percentage of the workforce that has completed secondary education (H). Estimates are constructed from benchmark figures based on Barro and Lee (2000). Following the perpetual inventory method, net flows of graduates with secondary education are added to benchmark stocks to generate an annual series.
  • 47. · Health expenditure as a percentage of GDP is the measure of health capital services (HE). The U.S. (Bureau of Labor Statistics, 2007) multi-factor productivity index is taken to measure the shift in the world technological frontier. Data are annual and cover the period 1960-2003. Sources of data and a description of variables are given in the appendix. The demand for human capital is derived from the production function and profit-maximizing behavior, but the supply of human capital is typically dominated by non-profit organizations, especially the state. With forward-looking behavior, the supply of human capital might be expected to respond to future demands (derived from GDP), as well as GDP depending upon human capital. Although interest centers on measuring the contribution of inputs to output, output may have a causal effect on inputs as well. For example, output growth may stimulate investments in physical capital and may also augment human capital by facilitating increased schooling and income (see for example Bils and Klenow (2000)). This bi- directional causality creates a correlation between the independent variables and the equation error term that renders OLS estimates of the production function coefficients inconsistent, an important reason for using the Johansen approach below. The parameters of the production function measure a long run relationship, and the time series from which the function is to be estimated are likely to be non-stationary. Regression models using such series may give rise to ‘spurious regressions’, even when the series are integrated of the same order. A necessary condition for a regression estimate to be a genuine economic relationship is that the variables are cointegrated, in which case the residuals will be stationary.
  • 48. Parameter estimates of a cointegrating equation are ‘superconsistent’; the distributions are asymptotically invariant to measurement error and simultaneous equation bias. However they may be also subject to small sample bias and have non- standard distributions. This last characteristic means the usual tests of significance do not apply. Moreover there are possibly a number of different cointegrating relations among a group of cointegrated variables. For reasons already stated, all the inputs into the production function can be endogenous, in which case there may be a cointegrating equation and an error correction model for each input, in addition to the production function. For such circumstances, Johansen (1991, 1995) proposed a maximum likelihood method for estimating and testing for the number of cointegrating equations, as well as their speeds of adjustments. The approach is to test the restrictions imposed by cointegration on the Vector Error Correction model involving all the series under consideration. In this system, the dependent column vector is the first difference of output and all the inputs of the production function (∆Zt). On the right hand side is the column vector of these variables lagged (here we consider only one lag, ∆Zt-1) and the associated coefficients (Γ). Also there is a column vector of the lagged levels of the production function variables (Zt-1). Matrices of adjustment coefficients (a) and of cointegrating coefficients (b) premultiply this vector. The standard errors of the coefficients in the cointegrating equations of the Johansen method have conventional distributions and so may be used for the usual significance tests. With a one period lag the system is: ∆Zt = Γ∆Zt-1 + abZt-1+ et where et is a vector of error terms. 5. Empirical Results The elements of the Z vector are obtained from (4) in section I, modified to include two human capital variables, secondary
  • 49. education (H) and health spending (HE): Y/L = A0 F ) / ln( 1 L H g (K/L)( L 1 0 - + + g b a (H/L) 0 g (HE/Y) φ (5) The production function (5a) shows how the parameters of (5) are related to the output elasticities: LnY = lnA0 + ((γ0 +γ1 lnF)/(1+ φ))lnH + (α/(1+ φ))ln K + ((β- γ0- γ1 lnF)/(1+ φ)) lnL + (φ /(1+ φ)) ln HE
  • 50. (5a) When γ1>0, the growth of the technological frontier F increases the human capital elasticity, but reduces the labor elasticity, of output. The education human capital measure influences absorptive capacity, and therefore interacts with the technological frontier. The health human capital variable only affects productivity directly. Testing for Unit Roots The degree of integration of each series in (5) is determined with Augmented Dickey Fuller (ADF) tests statistics, reported in table 2. Trend and additional lags were included when they were statistically significant. The ADFs show that all the variables considered are integrated of order one at the one percent level except Lnsstpw, which is significant at the 5% level. We cannot reject the hypotheses that all the variables are stationary in the first difference, and integrated of order I(1). So the series may be used to estimate co-integration regressions. Co-Integrating Equations The next stage is the estimation of the long-run relationship. The lag length for the Johnansen VAR is chosen to maximise the AIC. With one lag on the first differenced variables, AIC is -21.3 and with two lags it is -22.4. With increased lag length the AIC becomes smaller, indicating that one lag is the preferred specification. The cointegrating model specification that fits the data and the theoretical constraints is one with a linear deterministic trend in the data, and an intercept, but no trend in the cointegrating equation(s). The trace and max-eigen tests for numbers of cointegrating vectors reject the hypothesis of none, but not at most one (Table 3). So the data are consistent with one cointegrating vector. Table-2: Augmented Dickey Fuller (ADF) Tests
  • 51. Variable Model Adf Stat Lags Levels Lnrgdppw C and tr -0.766 2 Lnkspw C and tr -2.137 2 Lnsstpw C no tr -1.801 1 Ssmfp C and tr -3.460 2 Lnhegdp C no tr -2.213 1 Lnelf C and tr -4.02 1 First Differences Lnrgdppw C and tr -4.634 1 Lnkspw
  • 52. C no tr -3.968 2 Lnsstpw C and tr -3.823 2 Ssmfp C and tr -4.083 2 Lnhegdp C no tr -5.157 1 Lnelf C no tr -6.048 1 Lnrgdppw: Log of real GDP per worker, ln (Y/L) Lnkspw: Log of real capital stock per worker, ln(K/L) Lnelf: Log of employed labor force, ln L Lnsstpw: Log of human capital stock at the secondary level of education per worker, ln(H/L) Lnhegdp: Log of government expenditure on health as percentage of GDP, ln(HE/Y)
  • 53. Ssmfp: ln(H/L)*lnF (where F is U.S. multifactor productivity) C: Constant tr: Time trend Table-3: Unrestricted Cointegration Rank Test Sample: 1960 2005 Included observations: 42 Test assumption: Linear deterministic trend in the data Series: LNRGDPPW LNKSPW1 LNSSTPW LNHEGDP SSMFP LNELF Lags interval: 1 to 1 Hypothesized No. of CE(s) Eigenvalue Trace Statistic 5 Percent Critical Value Max-Eigen Statistic 5 Percent Critical Value None ** 0.658140 104.1756 94.15 45.08086 40.07757
  • 54. At most 1 0.471896 59.09474 68.52 26.81542 33.87687 ** denotes rejection of the hypothesis at the 0.05 level by both Trace and Max-Eigen Statistics. The normalized cointegrating vector (equation 6) is theoretically consistent with an aggregate production function including human capital, although the coefficient on physical capital/labor ratio is small, and on the margins of statistical significance. The other coefficients are more than three times their standard errors (in parentheses). ln (Y/L) = 0.175 ln(K/L) + 0.310 ln (HE/Y) + (0.447 ln MFP - 1.767) ln(H/L) (0.092) (0.038) (0.110) (0.498) + 0.357 ln L - 6.226 (6) (0.095) Log likelihood 518.3626 The adjustment coefficients, (a), of the right hand side variables of (6) are not significantly different from zero (not reported), consistent with these variables being weakly exogenous. Advances of the world technological frontier (F), measured by
  • 55. the coefficient (γ1) (on Ssmfp or ln (H/L)lnMFP in equation 6), raise the output elasticity of secondary schooling human capital variable from 0.08 in 1960 to 0.25 in 2005 . Health expenditure has an elasticity (φ) of 0.24 and the capital elasticity (() is 0.13. The total human and physical capital elasticity of 0.62 is therefore well below unity in 2005. The labor elasticity is large, at 0.82 in 1960, falling to 0.65 in 2005 . Adding all the input elasticities implies increasing returns to scale for all factors together throughout the period. Implied Rates of Return The return to educated workers in 2005 can be compared with that discussed by Bassanini and Scarpetta (2001) and by Sianesi and Van Reenen (2003); that is, increasing average education in the population by one year raises output per head by between 3 and 6 percent, and returns are higher for LDCs than for OECD economies. To do so, it is necessary to assume that a rise in the proportion of the workforce having attained a certain level of education can be directly translated into an increase in the average number of years of education in the workforce. Since there is no control for primary education in the model, the secondary education impact must be assumed to include years of primary education as well, that is, a total of ten years of education. For the comparison, the 2005 value of the proportion of the workforce with secondary education of 0.195 is considered. One extra year of education for the whole workforce translates into 10 years of education for one tenth of the workforce. Ten percent amounts to a (10/19.5 =) 0.513 increase in the workforce with secondary education. With an elasticity of 0.25, a 51.3 percent increase in the workforce with secondary education raises output per head by nearly 13 percent. This falls well outside the Sianesi and Van Reenan range for the OECD, indicating substantial under-investment in education in Pakistan. To compare with returns to primary education excluding
  • 56. spillovers reported earlier, secondary education must be assigned a financial cost. From section 1, (∂Y/∂H) = ((0+γ1ln F)/ ((H/Y), and ((0+γ1ln F) has been estimated at 0.25 for 2005. If the secondary education financial returns, including spillovers, are equal to the Behrman et al (2008) estimated returns to poor quality primary education (20 percent), the secondary educated human capital stock to income ratio in 2005 was (0.25/0.2=) 1.25. Turning to the second human capital measure, a rate of return from health investment may be obtained directly. Total health spending can be considered as the flow of services from a health human capital stock. A health investment ratio (0.6%) in the year 2005 (Table 1), and the coefficient of (0.31/1.31=) 0.24 implies an even higher return than for education, of (0.24*0.006-1 =) 39 percent . As with secondary education, this not only constitutes a very high return to an investment judged by commercial standards, but also indicates an enormous unmet requirement for health spending. 6. Sources of Growth Proximate sources of Pakistani economic growth can be obtained from a decomposition of the production function (6). Table 4 gives the decadal average annual growth rates of inputs and output. The variation between decades has already been noted, but the decline in human capital inputs in more recent decades is very obvious in the table and remarkable. Both health and schooling input growth rates become negative from the 1990s, and, as a consequence, so to does the absorption of technology variable (technology frontier shift*human capital). Yet the foreign (U.S.) technology frontier shifted faster, and therefore the possibilities for absorption were greater, in most recent years. Table-4: Pakistani Economic Growth Data 1961-2005 Actual Annual Average Growth Rates
  • 57. Real GDP / Worker Real Capital / Worker Secondary Schooling Stock / Worker Health Expenditure / GDP Technology Frontier Shift* Human Capital Labour Force Tech Frontier 1961-70 3.73 7.42 7.79 2.19 17.15 2.61 1.53 1971-80 2.29 2.97 0.88 3.08 2.45 2.42 0.62 1981-1990 2.63 3.09 5.82 1.91 14.93 1.95 0.57 1991-2000 0.76 1.89 -0.52
  • 58. -1.79 -4.08 2.19 0.87 2001-5 -0.38 -3.24 -4.16 2.36 1.65 The following growth attribution (Table-5) is derived from the production function estimate, equation 3. Table-5: Human Capital and Pakistani Economic Growth 1961- 2000 Actual / Worker Real GDP Annual Average Percentage Growth Model Predicted Model Predicted due to Human Capital 1961-2003 2.73 2.34 0.41 1961-70 3.73 3.42 0.57 1971-80 2.29 2.32 0.74 1981-1990 2.63 3.53
  • 59. 2.13 1991-2000 0.76 0.12 -1.12 The results in Table 5 indicate that, over the whole period 1961- 2003, just under one-fifth (0.41/2.34) of (predicted) growth in output per worker was due to human capital as measured here. Human capital has been responsible for more economic growth in successive decades from the 1970s until the 1990s. The 1980s appears to have experienced the strongest impact of human capital, accounting for 60 percent of predicted economic growth. Most extraordinary for a developing country is the massive negative contribution of human capital to growth in recent years, because of falling inputs . Strong growth during the 1960s was largely due to Pakistan’s capital accumulation. During the 1980s, economic growth was almost as high, but based on a greater human capital contribution. Later, economic mismanagement in general and fiscally imprudent economic policies in particular, caused a large increase in the country's public debt and reduced the input of human capital, leading to slower growth in the 1990s. No clearer indication of underinvestment in human capital can be found than the evidence of this decade. 7. Conclusion Economic growth in Pakistan for practical purposes is endogenous, influenced by government policy. Technical progress is driven by the ability to absorb foreign technology and the rate of absorption depends upon knowledge human capital. Thus the movement of the foreign technological frontier and the stock of human capital (secondary school graduates) are increasingly critical for economic development. Yet the return
  • 60. to years of secondary education indicates substantial underinvestment in knowledge human capital. The marginal output generated by secondary education far exceeds the range calculated for OECD countries. Unlike micro estimates, the macro estimate of this paper takes into account spillovers; it is a wider measure of social costs, and therefore is more appropriate for policy guidance. The high return is found despite the poor average quality of education shown by, for instance, large numbers of schools lacking buildings and widespread teacher absenteeism (Human Rights Commission, 2005 pp. 243-4). Higher quality education may be expected to achieve greater returns. The extremely large rate of return to health spending of 39 percent suggests such outlays are sound investments, quite independently of their consumption value. It may also indicate that the quality of health care needs less of a boost than does the quality of education. Compared with the MRW implied production function, the output elasticity of human capital is low , and the elasticity of ‘raw’ labor is high. This may reflect deficiencies in the measurement of human capital. But it may capture shortcomings in the Pakistani education system as well. A decomposition of the sources of growth implied by the estimated cointegrating equation shows that even the incomplete measures of human capital employed in this study explain just under 20 percent of the increase in output per head during the years 1961-2003. The striking feature of this growth analysis is the impact of human capital policies from the 1990s. Rapid labor force growth was not matched by expansion of secondary education, so that the proportion of the educated workforce declined. As the opportunities for benefiting from world technology increased, Pakistan’s ability to reap the advantages deteriorated.
  • 61. References Asian Development Bank (2006), ”Key Indicators of Developing Asian and Pacific Countries,” Oxford University Press. Barro, R.J. and Lee, J.W. (2000), “International Data on Educational Attainment: Updates and Implications,” manuscript, Harvard University, February. Barro, R.J. and Lee, J.W. (2001), “International Data on Educational Attainment: Updates and Implications,” Oxford Economic Papers, 53(3): 541-563. Bassanini, A. and Scarpettta, S. (2001), “Does Human Capital Matter for Growth in OECD Countries? Evidence from PMG Estimates,” OECD Economics Department, Working Papers, No. 282. Behrman, J.R., Ross, D. and Sabot, R. (2008), “Improving Quality Versus Increasing the Quantity of Schooling: Estimates of Rates of Return from Rural Pakistan,” Journal of Development Economics, 85(1-2): 84-104. Benhabib, J. and Spiegel, M. M. (1994), “The Role of Human Capital in Economic Development: Evidence from Aggregate Cross-Country Data,” Journal of Monetary Economics, 34: 143- 173. Benhabib, J. and Spiegel, M.M. (2002), “Human Capital and Technology Diffusion,” Federal Reserve Bank of San Francisco Working Paper 2003-02. Bils, M. and Klenow, P. (2000), “Does Schooling Cause Growth?” American Economic Review, 90(1): 1160-1183. Blankenau, W F. and Simpson, N B. (2004), “Public Education
  • 62. Expenditures and Growth,” Journal of Development Economics, 73(2): 583-605. Bloom, D., and Canning, D. (2000), “The Health and Wealth of Nations,” Science, 287(5456): 1207-09. Bloom, D., and Canning, D. (2003), “The Health and Poverty of Nations: from Theory to Practice,” Journal of Human Development, 4(1): 47-71. Das, J., Pandey, P. and Zajonc, T. (2006), “Learning Levels and Gaps in Pakistan. Policy,” Research Working Paper Series 4067, World Bank. Durlauf, S., P. Johnson and J. Temple (2004), “Growth Econometrics,” In the Handbook of Economic Growth, P. Aghion and S. Durlauf, eds., North-Holland. Dutta D and Ahmed A. (2004), “Trade Liberalization and Industrial Growth in Pakistan: A Cointegration Analysis,” Applied Economics, 36: 1421-1429. Federal Bureau of Statistics (2005), Fifty Years of Pakistan Statistics, Government of Pakistan. Government of Pakistan (2006), “Economic Survey, 2005-06,” Finance Division Economic Advisor’s Wing, Islamabad. Haroon J. et al. (2003), “Private Returns to Education: Evidence from Pakistan,” State Bank of Pakistan, Research Report No. 50. Human Rights Commission of Pakistan (2005), “State of Human Rights in 2005,” Lahore. Husain, F. Qasim M. A. Sheikh K. H. (2003), “An Analysis of
  • 63. Public Expenditure on Education in Pakistan,” The Pakistan Development Review, 42(4-II): 771–780. Johansen, S. (1991), “Estimation and Hypothesis Testing of Cointegration Vectors in Gaussian Vector Autoregressive Models,” Econometrica, 59: 1551–1580. Johansen, S. (1995), “Likelihood-Based Inference in Cointegrated Vector Autoregressive Models,” Oxford University Press. Jones, C. (1995), “Time Series Tests of Endogenous Growth Models,” Quarterly Journal of Economics, 110(2): 495-525. Maddison, A., (1995), “Monitoring the World Economy, 1820- 1992.” OECD Paris. Maddison, A. (2001), “The World Economy: A Millennial Perspective,” OECD Paris. Mankiw, N. G, Romer, D. and Weil, D. N. (1992), “A Contribution to the Empirics of Economic Growth,” Quarterly Journal of Economics, May: 407-37. Mincer, J. (1974), “Schooling, Experience and Earning,” New York: National Bureau of Economic Research. Nasir, Z.M. and Nazil H. (2000), “Education and Earnings in Pakistan,” Pakistan Institute of Development Economics Research Report No. 177, Islamabad. Nelson, R. R. and Phelps E.S. (1966), “Investment in Humans, Technological Diffusion, and Economic Growth”, American Economic Review, 56: 69-75. Parente, S. and Prescott, E. (2000), “Barriers to Riches,” Cambridge, MA, MIT Press.
  • 64. Parente, S. and Prescott, E. (1999), “Monopoly Rights: A Barrier to Riches,” American Economic Review, 89(5): 1216- 1233. Pungo, M. (1996), “Structural Stability in a Cross Country Neoclassical Growth Model,” Applied Economics, 28: 1555- 1566. Rebelo, S. (1991), “Long-Run Policy Analysis and Long Run Growth,” Journal of Political Economy, 99: 500-521. Saggi, K. (2002), “Trade, Foreign Direct Investment, and International Technology Transfer: A Survey,” World Bank Research Observer, 17(2): 191-235. Shapiro M. (2005), “Complements of Human Capital in Technological Catch-up: Openness, Capital and Technology Transfer in East Asia,” Paper presented at the annual meeting of the Midwest Political Science Association, Chicago, Illinois. Sianesi, B. and Van Reenen, J. (2003), “The Returns to Education: Macro-Economics,” Journal of Economic Surveys, 17(2): 157-200. State Bank of Pakistan (2006), “Handbook of Pakistan Economy.” United Nations Commission for Education (1999), UNESCO Yearbook. World Bank (1982), World Development Report 1982, Oxford University Press, Washington, DC. World Bank (1984), World Development Report,” Oxford University Press, Washington, DC. World Bank (2002), “Development Policy Review: A New Dawn,” April.
  • 65. World Bank (2006), “Pakistan Growth and Export Competitiveness,” Poverty Reduction and Economic Management Sector Unit, South Asia Region, Report No, 35499. World Bank (2007), “Key Development Data & Statistics.” http://go.worldbank.org/1SF48T40L0. APPENDIX Table-A: Description of variables and data sources Variables Definition and Unit of Measurement Data Sources RGDPPW Real GDP per worker (In US $ per worker in 2000 Constant Prices) Penn World Table 6.2 ELF Employed labour force (in million) Handbook of Pakistan Economy by Sate Bank of Pakistan, ILO yearbook statistics KSPW Capital stock per worker (in millions) Miketa, A., 2004: Technical description on the growth study datasets. Environmentally Compatible Energy Strategies Program, International Institute for Applied Systems Analysis (IIASA), Laxenburg, Austria, October 2004. http://www.iiasa.ac.at/ECS/data_am/index.html SST Secondary Schooling Stock (percentage) Benchmark figures are taken from Barro and Lee (2000) and following the perpetual inventory method, we constructed flows of adult population that are added to bench mark stocks. LITERACY Literacy (percentage)
  • 66. Economic Surveys of Pakistan for different years, World tables by World Bank, Handbook of Pakistan economy by State Bank of Pakistan, Fifty year of Pakistan Statistics by Federal Bureau of Statistics (FBS) Pakistan, and Statistical yearbooks by UNESCO for different years. HEGDP Total health expenditure as % of GDP (HEGDP) Handbook of Pakistan Economy by State Bank of Pakistan MFP Multifactor Productivity U.S., Bureau of Labor Statistics, Office of Productivity and Technology (May 2007 publication) RHE Real health expenditure (in millions) Handbook of Pakistan Economy by State Bank of Pakistan LER Life Expectancy Rate Handbook of Pakistan Economy by State Bank of Pakistan and World Bank TELE1000 Telephone in use (000 people) Statistical Yearbooks by United Nation for different years Education Expenditure Government Expenditure on Education as % of GDP (GEEGDP) Economic Surveys of Pakistan for different years, Statistical Yearbooks by United Nation for different years, Handbook of Pakistan economy Table B: Descriptive Statistics Statistics Variables Mean Standard Deviation LNRGDPPW 8.379
  • 68. 1.000 0.961 0.975 0.936 0.755 LNELF 1.000 0.937 0.981 0.765 LNSST 1.000 0.924 0.713 LITERACY 1.000 0.711 LNHEGDP 1.000 * Comsats Institute of Information Technology, Islamabad, Pakistan & Cardiff Business School, Cardiff University, UK.
  • 69. ** Cardiff Business School, Cardiff University. � For instance from 1820 to 1929 Maddison’s (1995) estimates show that Pakistan’s real GDP per head grew at an average rate of 0.31 percent. Then incomes doubled in the course of the 1960s, and high growth by historical standards became sustained in subsequent years, albeit at varying rates. � Tested at the end of the third grade, only 31 percent of Pakistani primary school children could correctly form a sentence with the word “school” in the vernacular (Urdu) (Das, Pandey and Zajonc, 2006). � This may be an explanation for Shapiro’s (2005) surprising finding of a negative international technology diffusion effect for East Asia. � A previous time series study of Pakistan industrial’s growth 1973-1995 (Dutta and Ahmed, 2004) investigated the impact of secondary school enrolment, but there is some question about the signs of the variables in the cointegrating vector. � ‘Social’ here does not include spillovers but only the public (as well as private) financial costs of providing education. � ((0 + γ1 lnF) / (1 + φ) = ((4.19076 * 0.447) - 1.767) / 1.31 for 1960.
  • 70. � (β - (0 - γ1 lnF) / (1 + φ) = ((1.357 - 0.175) / 1.31) - 0.08 = 0.82 for 1960, to ((1.357 -0.175) / 1.31) - (((4.6923 * 0.447) - 1.767) / 1.31) = 0.65 for 2005 � (∂Y/∂HE)(HE/Y) = 0.31/1.31, (HE/Y)=0.006, so ∂Y/∂HE = 0.236/.006 =39.44. � There is a substantial error in the decadal predictions for growth. � MRW’s implied result is about one third for human capital, and it should be noted that by excluding technical progress, as they do, a similar result can be obtained here. _1274802552.unknown _1274802757.unknown _1274802843.unknown _1274802697.unknown _1274802511.unknown Chapter 15 in S Broadberry and K Fukao eds. Cambridge Economic History of the Modern World (forthcoming) Underlying sources of growth: institutions and the state James Foreman-Peck and Leslie Hannah Two characteristics differentiate today’s rich countries from many poor and middle-income ones: they are all
  • 71. market economies run largely by capitalist corporations, and most are representative democracies (oil-rich economies being exceptions)[footnoteRef:1]. However, capitalist democracies have widely differing commitments to tax redistribution, levels of state ownership, health and welfare policies, or the balance between protecting established property rights and interventions to remedy the system’s perceived failings. Autocrats have also promoted economic growth - President Xi of China follows a long tradition - and have sometimes succeeded over a lower range of GDP per head. However, economic growth eventually seems to expand demands for participation: in the later twentieth century military dictatorships of Taiwan, South Korea and Spain liberalized and communist autocrats in eastern Europe conceded free elections. [1: In 2018 no country that was an autocracy (Polity IV definition, see note 10, below) had an income per head of more than $15,000 if it was not heavily dependent on fossil-fuel exports. Countries that were autocratically ruled and did not have the option to export fossil fuels were poor (Roser 2014).] While democracy, capitalism and wealth are correlated, the possibility and nature of causation among the three is much debated. Major themes in the western literature - pioneered by Nobel-prizewinning economic historian Douglass North and enriched by many others[footnoteRef:2] - are when these correlations emerged and how they are structurally related. We follow this “new institutional economics” approach here. Wealth-maximizing political institutions are hypothesized to be inclusively representative, sometimes leading toward full democracy, combined with respect for minorities. Arguably political and economic ‘open access’ - representative political institutions and ready access to incorporation or similar enterprise forms - are mutually reinforcing and conducive to high living standards, broadly shared (North Wallis and Weingast 2009, hereafter NWW). [2: For instance, North and Thomas 1973; Rosenberg and Birdzell 1986; Ostrom 1990;
  • 72. Engerman and Sokoloff 2012; Acemoglu and Johnson 2005; Haber North and Weingast 2008; Acemoglu and Robinson 2012; Lamoreaux and Wallis 2017; Alston et al 2018.] Institutions are the patterns of interaction that govern and constrain the relationships of individuals; the ‘rules of the game’. Relevant rules include written laws, formal social conventions, informal norms of behaviour and shared beliefs about the world. This variety ensures that institutions are often difficult to define precisely. The institutional form of some states includes the rule of law, in others the rule of arbitrary terror. Institutions are often hard to create and highly persistent. Institutional economics attempts to understand why and under what conditions they emerge. Institutions facilitating transitionsfrom limited to open access must allow the circulation of elites. Elites may be elected but in a low income, feudal society such as contemporary Pakistan they can still at best be a ‘selectorate’. New people must be allowed access to power, changing the social structure, but without too much collateral damage to society. Peaceful transitions therefore may entail outgoing elites being permitted to hold on to their wealth, so they abandon power without violence. The condition of peaceful circulation in turn needs acceptance of a rule of law for elites that offers them a form of legal protection. A second condition is that there must be substantial numbers of independent, perpetually lived organizations, such as corporations; these can undertake more economic activities than finite life organizations. Political control of the military is an essential third condition. The failure of the military coups in 1981 and 1982 marked the success of the Spanish transition to open political and economic access. Control is essential to reduce threats of violence and trade disruption and cutting the risk of expropriation by the military increases the benefits of markets. When economies and societies satisfy these three conditions and become wealthier, the open access transition and sustained economic growth are
  • 73. more likely to occur (NWW 2009). The “Washington consensus” - or the “Manchester School” as similarly free market liberal[footnoteRef:3] ideas were known in the nineteenth century - never goes uncontested (Chang 2002, Stiglitz 2003).[footnoteRef:4] It is now concretely expressed in the World Bank’s detailed policy prescriptions and “Doing Business” index (www.worldbank.org). The “good” institutions it recommends include democracy, an independent judiciary, uncorrupt and efficient bureaucrats, secure property rights, a politically-independent central bank, easy and cheap business registration, transparent and market-orientated corporate governance, and a responsive legal system (with common law systems judged to perform well on this dimension). [3: We use the term “liberal” in its original European - or modern “neo- liberal” - sense to mean anti-authoritarian supporters of individual freedom, free markets and a limited state, not in the modern American English sense (broadly the opposite).] [4: Before 1914, the Manchester School was similarly contested by Marxists, American institutionalists, German Kathedersozialisten, British Fabian socialists and many others.] A frequent problem in understanding their role today is that institutions have often existed for decades. They have sometimes evolved with minimal formal deliberation (the unwritten British “constitution”) rather than being consciously constructed (the American constitution, though that too evolved). It is sometimes difficult to identify origins, causes and effects separately from those of related institutions, or cultural background, with which they interact. For example, Haber, North and Weingast (2008) contend that correlations between favourable economic outcomes and Anglo-American common law systems are not causal: both the outcomes and common law judgments are triggered by third factors,
  • 74. representative political institutions and tolerably equal economic access. Some institutions - such as patents, education and demographic norms - are discussed in other chapters. We pay special attention here to the development of business incorporation and its relation to evolving representative government. The capitalist corporate form - and some state- owned substitutes - came to dominate enterprise in almost all post-agrarian societies by the end of the twentieth century and political institutions played a key role in this development. NWW (2009) maintain that under the ‘natural state’ (a coalition of elites), economic growth can take place but will be eventually choked off as the basis of elite power comes under threat. The transition to sustained economic growth requires the transformation of both political and economic institutions, so that they can become mutually supporting. Traditional - feudal, monarchical, established religion, class- or caste-bound – societies usually restrained political and economic open access. Sometimes the move to more representative government occurred because incumbent elites made mistakes that weakened their hold on power (Treisman 2017). For those outside the elite the overthrow of such systems in the name of “modernity” often seemed a prerequisite for growth and development. In that limited sense American and French revolutionaries overthrowing monarchy and aristocracy, Lenin’s execution of the Tsar and attacks on the bourgeoisie, and Maoist revolutionaries undermining Confucianism and the Manchukuo dynasty were all on the same page. All also seriously risked oversimplifying (sometimes murderously) the problematic transition to modernity. We set the scene with a survey of economic and political institutions in 1870 and the concentration of wealth in Western Europe and North America. We go on to consider the experience and institutional features of the first non-Western moderniser after 1870, Japan. The third section summarises the non-market institutions and state development from 1917 of the Communist
  • 75. alternative states. This is followed by a brief account of the key characteristics of the hybrid state-driven capitalist economies that begin to appear after 1945. In each section we rely heavily, but not uncritically, on the NWW framework to interpret the relationships between economic development and political and economic institutions. I Economic and Political Institutions in 1870 In 1870 political economists - as institutional economists were then called - had strong views on the characteristics of desirable institutions and were confident they were the cause, not merely the happy result, of prosperity. They used Christianity and “civilisation” as synonyms: “Christendom” meant the developed world (Mulhall 1881). A leading sociologist, Max Weber, and many historians agreed that religion - and especially the Protestant variety - had promoted capitalist prosperity (Weber 1904, Butterfield 1931, Tawney 1964) and there remain today some exponents of the view that “good” or “poor” institutions are rooted in deep national cultural traits such as religion (Landes 1999; Stulz and Williamson 2003; McCloskey 2010; Djankov and Hauck 2016).[footnoteRef:5] Most Islamic countries have experienced difficulties in growing rich (except on oil) and generally have had autocratic governments (Kuran 2011). Yet economic growth is now more widely shared by non-Protestant countries and rich countries have become more agnostic. Religious institutions as causes of national economic growth are accordingly less prominent in today’s institutional economics than they were in the past. [5: For a broader discussion of the interactions between culture (generally learned informally from parents, civil society or churches) and institutions (which are more deliberate -and often political – creations), see Alesina and Giuliano 2015.] One obvious feature of the world of 1870 was how distant the bulk of humanity were from the NWW ideal of ‘open access’ or
  • 76. ‘inclusive’ institutions. Living standards were already high in much of western Europe, north America and Australasia, where governments fostered widespread (if imperfectly democratic) participation in both dispersed capitalist corporations and representative political assemblies. It was still a matter of heated debate whether some institutions – like limited liability, patents, or democracy - were aids to, or barriers to, economic progress. Not until the early twentieth century did three rich countries – Finland, Australia and New Zealand – introduce a franchise close to that considered democratic today (including women). Some, like France and Switzerland, did not do so until after World War Two. One near approach to a more generous definition of democracy - universal adult male franchise - in the French Second Republic only demonstrated its dangers: it had led in 1852 to the endorseement of the autocratic Napoleon III. In the richest countries, statesmen either judged a wider franchise undesirable, or, accepting it was inevitable, fretted about ensuring broader commitment to the existing polity and social hierarchy. They pressed for wider education, modest social protections, or for restricting radicals, labour unions and (within empires) native independence movements. Most of the world’s population lived under absolute hereditary rulers, subject to few formal restraints (Russia, China, Japan, Brazil, the Ottomans) or direct rule by a controlling power (British India, French Indo-China, American Alaska). In the developed world, most states (including the UK, Germany, Italy) were monarchies, though with some representative government and serious restraints on the arbitrary exercise of regal power. Only in America (north and south) did republics predominate. Nation states were the basic institutional framework for political and economic development: their governments were the authors of legislation and incubators of formal institutions. People, capital, goods and ideas moved across national borders, but they travelled more easily within those borders, especially borders that enclosed linguistic or culturally homogeneous communities. Newspapers, political
  • 77. activities, social interactions, education systems, transport improvements and laws increasingly reinforced national links. Mill (1861) argued that representative government “was next to impossible in a country made up of different nationalities.” The Hapsburg monarchy, though opting not to merge its nine million German-speakers into the new German confederation of 1870- 71, did separate the government of its constituent Austrian and Hungarian kingdoms. Mill’s point was important, as nation states consolidated, but also raised as many questions as it answered: were the Irish British? were Poles and Alsatians German? were Muslims or Buddhists Indian? could one really create a nation out of US polyglot immigrants, when the north disagreed with the south on as fundamental an issue as slavery? The number of sovereigns had declined as states consolidated and major sovereigns annexed weaker ones and was to decline further, notably with the European “scramble for Africa,” to 54 by 1914.[footnoteRef:6] European empires, which had administered a third of the world’s land surface in 1800, controlled over 84% by 1914 (Fieldhouse 1973). Rich nation states (excluding their empires) in 1870 were about equal in size: populations were 40m (US), 39m (Germany), 38m (France) and 31m (UK). Many more people lived in recognizably poorer countries with autocratic governments (Russia with 83m, the Indian subcontinent with 300m and China with 358m together accounted for 58% of the world’s population). [6: War-induced break-ups were to increase that to 76 by 1949 and later de- colonizations resulted in today’s level of around 200 nation states (Gancia et al 2016, p. 1). ] International institutions - European empires apart - were almost non-existent. Bodies such as the International Commission on the Danube worked well for riparian states, the International Office of Telegraphy was set up 1869 and the International Bureau of Weights and Measures in 1870. The Hague Tribunal (another forerunner of today’s United Nations
  • 78. for resolving international disputes) had to wait until 1899. Nonetheless international trade (the increasingly protectionist US excepted) was relatively free, facilitated by tariff reduction agreements and acceptance of the “most favoured nation” clause. Communications were improving: the French opened the Suez Canal (speeding communication between Europe and Asia) in 1869 and in the same year the US completed north America’s first transcontinental railway, both expanding trade opportunities. The Victorian “worldwide web” was almost complete, with a working cable across the Atlantic by 1866, India and Singapore connected by 1870 and Australia and major cities on Asia’s Pacific coastline following in 1871 (Foreman- Peck 1995). These achievements left sub-Saharan Africa as the only major region not then linked to rapid telegraphic communication. The connection that North et al hypothesised between open access in the political and economic spheres might be expected to show up earliest and most clearly in the US, a self-consciously new and different country whose many constituent states were experimenting with open access both politically and economically: extending the franchise and general incorporation laws. The number of corporations per capita in the US was already high by European standards by the middle decades of the nineteenth century (Wright 2014, Hannah 2014). However, there was considerable variation between US states in allowing incorporation with limited liability by simple registration and political open access, with long lags both ways; the changes were slow, difficult and contingent (Hilt 2017). Few believed that opening access to organizations of all kinds could both spark sustained economic growth and enhance the workings of democratic politics (Lamoreaux and Wallis 2017). A more sharply mixed pattern can be seen globally. China, Japan, many un-colonized Asian and African states, the Russian and Ottoman Empires and much of south eastern Europe lacked general incorporation statutes in 1870 and for several more decades. On the other hand, most rich countries with some