
Recommended
Recommended
More Related Content
Similar to Contents lists available at ScienceDirectJournal of Destin.docx
Similar to Contents lists available at ScienceDirectJournal of Destin.docx (20)
More from donnajames55
More from donnajames55 (20)
Recently uploaded
Recently uploaded (20)
Contents lists available at ScienceDirectJournal of Destin.docx
- 1. Contents lists available at ScienceDirect Journal of Destination Marketing & Management journal homepage: www.elsevier.com/locate/jdmm Research Paper The 2014 FIFA World Cup™: Tourists’ satisfaction levels and likelihood of repeat visitation to Rio de Janeiro Kamilla Swarta,⁎, Richard Georgeb, Julia Cassarc, Chesney Sneydc a Department of Tourism and Event Management, Faculty of Business and Management Sciences, Cape Peninsula University of Technology, PO Box 652, Cape Town 8000, South Africa b School of Business and Enterprise, London Campus, University of West Scotland, London SE1 GNP, UK c Department of Strategic Applied Management Studies, University of Cape Town, Private Bag X3, Rondebosch, 7701, South Africa A R T I C L E I N F O Keywords: FIFA World Cup™ Rio de Janeiro Information search Destination image
- 2. Crime-risk perceptions Satisfaction Repeat visitation A B S T R A C T High-profile mega-sporting events have progressively been positioned in marketing, decision-making and strategy development of tourism destinations, especially as platforms for showcasing host destinations. This study conceptualizes a model of interlinked constructs in order to predict sports tourists’ likelihood of repeat visitation to Rio de Janeiro after the 2014 Fédération Internationale de Football Association (FIFA) World Cup™. This conceptual model includes the effects of tourists’ information search, destination image and perceptions of crime risk on satisfaction and ultimately, repeat visitation to Rio de Janeiro. The results provide support for the proposed model and confirm that information search negatively influences tourists’ image of Rio de Janeiro and that destination image, reduced crime-risk perceptions and satisfaction positively influence the likelihood of repeat visitation to Rio de Janeiro. These findings can assist destination marketers in managing the destination brand and changing existing perceptions and misconceptions about Rio de Janeiro, in order to positively influence tourist satisfaction and repeat visitation. 1. Introduction High-profile sport mega-events are increasingly the focus of the marketing, decision-making and strategy development of tourism destinations (Gibson, 2010; Knott, Fyall et al., 2015). More specifically, the strength and compatibility of the relationship between sport
- 3. and tourism has increased dramatically in recent years, with an overlapping of these industries at a global level (Gibson, 2010; Hinch, Higham, & Sant, 2014). Gibson (2010) proposes that sport tourism is one of the fastest-growing sectors within the tourism industry. Sport tourism refers to people who travel outside of their residential environment involve themselves to actively or passively in either competitive or recreational sport (Gammon & Robinson, 2003; Hinch & Higham, 2001). Sport tourism has been identified to have three domains namely: participatory, celebratory and event-based, the last of which includes mega-events (Gibson, 2010; Hinch et al., 2014). Event-based sport tourism has received the most attention within the field of sport tourism literature. Cornelissen and Swart (2006, p.108) define mega-events as ‘complex affairs which originate from a specific set of economic objectives, but which have potential and social outcomes that extend far beyond’. Additionally, sport mega- events are large-scale competitions such as the Olympic Games and Fédération Internationale de Football Association (FIFA) World Cup™ appeal to a significant number of participants and
- 4. spectators (Knott & Swart, 2015). In recent years, developing countries such as Brazil, Russia, India, China and South Africa (BRICS) have increasingly used mega- events to promote socio-economic development and image enhancement (Grix, Brannagan, & Houlihan, 2015; Knott & Swart, 2015). The importance of clarifying the relationship that exists between perceived crime- risk and the future travel behavior of tourists to these destinations is under- scored (George & Swart, 2012). Although Brazil hosted the 2014 FIFA World Cup™ relatively successfully, substantial concerns were raised prior to the event regarding the safety and security of the host nation (Watts, 2014). These concerns stemmed primarily from elevated local crime rates rather than terrorist attacks that are often associated with high-profile mega-events such as the Olympic Games and FIFA World Cup™ (Taylor & Toohey, 2007). Prior to the 2013 FIFA Confederations Cup™, which served as a precursor to the 2014 FIFA World Cup™, mass violent protests involving over 5000 residents in Rio de Janeiro tainted the host country's reputation (Barchfield, 2013). As a result, safety and security concerns were heightened in the lead up to the 2014
- 5. FIFA http://dx.doi.org/10.1016/j.jdmm.2017.01.001 Received 1 August 2016; Received in revised form 9 January 2017; Accepted 9 January 2017 ⁎ Corresponding author. E-mail addresses: [email protected] (K. Swart), [email protected], [email protected] (R. George), [email protected] (J. Cassar), [email protected] (C. Sneyd). Journal of Destination Marketing & Management xxx (xxxx) xxx–xxx 2212-571X/ © 2017 Elsevier Ltd. All rights reserved. Please cite this article as: Swart, K., Journal of Destination Marketing & Management (2017), http://dx.doi.org/10.1016/j.jdmm.2017.01.001 http://www.sciencedirect.com/science/journal/2212571X http://www.elsevier.com/locate/jdmm http://dx.doi.org/10.1016/j.jdmm.2017.01.001 http://dx.doi.org/10.1016/j.jdmm.2017.01.001 http://dx.doi.org/10.1016/j.jdmm.2017.01.001 World Cup™. This research aims to better understand how 2014 FIFA World Cup™ tourists’ information search, perceived crime risk and satisfaction influenced their likelihood of repeat visitation to Rio de
- 6. Janeiro. Previous literature on the topic has dealt extensively with crime-risk perception (Pizam & Mansfeld, 2006; Maser & Weiermair, 1998), satis- faction (Cadotte, Woodruff, & Jenkins, 1987; Kozak & Rimmington, 2000; Oliver & Swan, 1989) and repeat visitation (Baloglu & Erickson, 1998; Niininen & Riley, 1998; Oppermann, 1996) of tourists to a destination. However, there is a dearth of research that covers the influence of tourists’ information search on their perceptions of crime risk at sport mega-events and destination image, and how these constructs influence satisfaction and tourists’ likelihood of repeat visitation. 2. Literature review 2.1. Tourism and crime-safety Extensive research has been conducted on the nature of the relationship between tourism and criminal activity. There are two main areas of research on the topic, namely whether crime at a destination impacts on tourism demand, and whether the tourism industry possibly encourages criminal activity. One of the primary concerns tourists have when deciding upon a travel destination is the potential of experiencing crime (Levantis & Gani, 2000). Travelling to developing nations poses an even bigger
- 7. crime risk, as there is often more incentive for locals to commit crimes against tourists (Levantis & Gani, 2000). Research conducted on the relationship between tourist victimization and crime shows that high crime rates have a negative effect on tourist demand (Barker, Page, & Meyer, 2002; Chesney-Lind & Lind, 1986). When there is an excessive potential threat to their wellbeing, tourists are likely to cancel, postpone or consider substitute destinations that are less risky (Pizam, 1999; Pizam, Tarlow, & Bloom, 1997; Richter & Waugh, 1986). Levantis and Gani (2000) specifically looked at developing nations and found this proposition to be correct. However, contrasting evidence suggests that there is no general relationship (Tarlow, 2000). Despite there being conflicting evidence concerning the relationship between crime levels and tourism demand, there is no doubt that crimes committed against tourists are highly publicized, thus attracting negative attention to the destination in question (George & Swart, 2012) as was the case for both South Africa and Brazil in their respective hosting of the FIFA World Cup. Tourism research also examines crime and tourist activity from another perspective. Several researchers propose that the development of the tourism industry encourages criminal activity (Walmsley, Boskovic, & Pigram, 1983; Fujii & Mak, 1980). It has been suggested
- 8. that tourists are more likely to be victimized as they are likely to find themselves in unfamiliar settings (Chesney-Lind & Lind, 1986; Barker et al., 2002; Boakye, 2010). Harper (2001) identified three character- istics that make a tourist susceptible to crime victimization: having the status of a tourist, being non-permanent and being transient at the destination. Given the fact that sport mega-events attract large numbers of domestic and foreign tourists, they become prime criminal hotspots due to heightened opportunity for local criminals (Barker, Page, & Meyer, 2003). Transient crowds allow for a greater number of unidentified people at any one time and, therefore, an increased pool of potential victims and more difficult identification of criminals (Jarrel & Howsen, 1990). 2.2. Information search Consumer decision-making is the process of obtaining information and integrating information into related purchase decisions (Moutinho, 1987). Consumers have very few opportunities to rate the quality of a product or service before consumption. In order to minimize potential risk, consumers require information before deciding on a purchase. The decision-making of
- 9. tourists with regards to destinations is no different. Gathering information through a search is an effective method of reducing potential risk (Bieger & Laesser, 2004; Gursoy & McClearly, 2004), and consequently uncertainty or dissatisfaction (Mitchell, 1999). Sheth and Venkatesan (1968) propose that information search to reduce risk is more prevalent among tourists with little prior travel experience. Tourists use a number of information sources to form perceptions of a destination and to reduce perceived risk (Fodness & Murray, 1999). These sources are categorized as internal or external information sources (Money & Crotts, 2003). The internal information search is the process of retrieving decision-relevant information that has been stored in the tourist's memory. This may include previous experience or past information searches. External information search is classified into four categories (Beatty & Smith, 1987): personal (word-of- mouth advice from friends and family), marketer-dominated (advertisements in print and electronic media), neutral sources (third-party sources such as travel agents and tourist guides) and, lastly, experiential sources such as direct contact with the destination. In recent years, the Internet has
- 10. come to be considered a fifth shared source of external information (Buhalis & Law, 2008; Money & Crotts, 2003). Categorizing information provided by destination marketing organizations (DMOs), such as government, state or city tourist offices, is also contentious, as it could be categorized as either a neutral source (acting as an intermediary between the tourist activities and tourists) or a marketer- dominated information source (exclusively promoting destinations generating overnight stays and income) (Money & Crotts, 2003). Baloglu and McClearly (1999) conclude that information sources, both internal and external, play a major role in the formation of the tourist's cognitive image of a destination. Organic images are created from non-tourism information sources. Potential tourists, who wish to travel, may then involve themselves in an active information search thus engaging with tourism-related information sources. In this way, induced images are created. These induced images may be different from the original organic images (Gunn, 1972). It is also suggested that the type, quality and quantity of information would determine the nature of the image formed (Burgess, 1978). Thus, the following hypothesis was proposed:
- 11. H1: A greater information search is positively related to their destination image of Rio de Janeiro at the 2014 FIFA World Cup™. 2.3. Destination image Tourist destinations are becoming increasingly competitive; there- fore it is important to understand what motivates tourists to choose particular destinations. Like any business, creating a favorable and attractive image in customers’ minds, is important to the success of the business. The same applies to tourist destinations. Destination image is accepted as a vital aspect of successful tourism and destination market- ing, due to its influence on supply and demand sides of tourism marketing (Tasci & Gartner, 2007). DMOs recognize the important role that the hosting of events may have on the formation of the destination's image, despite major costs, investments and other social problems related to preparing for the event (Getz, 2008). Associations arising from an event can be used to inform strong and unique associations for the destination (Cai, 2002; Waller, Trendafilova, & Daniell, 2015). The value of events lies in the benefits of image transfer which refers to the assignment of abstract
- 12. event associations to the destination's image (Deng & Li, 2013). Deng and Li (2013) conclude that event image has a strong positive effect on destination image. The theory of image transfer has been widely accepted in event sponsorship literature; especially for the sponsorship of sport events (Deng & Li, 2013; Xing & Chalip, 2006). Perceptions of safety and security are salient purchase criteria for K. Swart et al. Journal of Destination Marketing & Management xxx (xxxx) xxx–xxx 2 leisure travel; especially in relation to developing nations with im- mature tourism development (Donaldson & Ferreira, 2007). Numerous researchers have argued that perceptions of crime risk at tourist destinations have a negative impact on the destination's image and on tourism demand (Pizam & Mansfeld, 2006; Dimanche & Leptic, 1999; Levantis & Gani, 2000). Given this relationship, the associated hypoth- esis is as follows: H2: Destination image is positively related to crime-risk perceptions of tourists in Rio de Janeiro during the 2014 FIFA World Cup™.
- 13. Destination image is considered to be the most important aspect when it comes to tourists’ decisions (Castro, Amario & Ruiz, 2007; Chen & Tsai, 2007). When tourists have positive perceptions and impressions of a destination they are more likely to visit the destination in the future (Alhemoud & Armstrong, 1996). Furthermore, a favorable destination image can positively affect satisfaction and future travel behavior (Bigne, Sánchez, & Sánchez, 2001; Lin, Chen, & Liu, 2003). Satisfaction is seen as a tourist's post-purchase evaluation of the destination (Wang & Hsu, 2010). Previous research has concluded that destination image is a vital factor in influencing tourists’ satisfaction with the destination (Castro, Amario & Ruiz, 2007). The more positive the destination image, the higher tourist satisfaction will be. Past findings conclude that destination image is, therefore, a direct ante- cedent of satisfaction where there is a positive relationship (Court & Lupton, 1997; Yang, Hu, & Yuan, 2009). From this, the following hypothesis can be deduced. H3: Destination image is positively related to tourists’ satisfaction at the 2014 FIFA World Cup™. 2.4. Perceived risk and mega-events
- 14. Perceived risk in consumer behavior refers to a customer's percep- tion of uncertainty and unfavorable consequences when performing a purchase (Dowling & Staelin, 1994; Maser & Weiermair, 1998). When risk and safety concerns are experienced within a tourist's decision- making process, there is a substantial likelihood of these aspects becoming overruling factors resulting in the alteration or cancellation of travel itinerary (Sӧnmez & Graefe, 1998). Encounters with negative perceptions of a destination could potentially result in negative destination images (George, 2003; Goodrich, 2002). This could have the potential effect of reducing the influx of foreign tourists to the area, through negative publicity and word-of-mouth (George, 2003; Gibson & Lepp, 2003). The tourism literature indicates that travel risks are associated with terrorism (Arana & Leon, 2008; Taylor & Toohey, 2007), crime (Pizam & Mansfeld, 2006; Maser & Weiermair, 1998), natural disas- ters (Faulkner & Vikulov, 2001; Maser & Weiermair, 1998), hygiene, transportation, culture/language barriers, uncertainty related to destination-specific laws and regulations (Maser & Weiermair, 1998), tourist type (Lepp & Gibson, 2003; Roehl & Fesenmaier, 1992), and previous travel experience (Boo & Gu, 2010; Lepp & Gibson, 2003; Sӧnmez & Graefe, 1998). Previous literature suggests
- 15. that a tourist's propensity to participate in risk-taking is related to personality attributes and personal characteristics (Carr, 2001; Plog, 1974) and that a tourist's risk perception is uniquely for- mulated for each situation (Roehl & Fesenmaier, 1992). These personal characteristics include age and life stage (George, 2010; Gibson, Attle & Yiannakis, 1998). A further personal influencing factor, which is important in terms of mega-events, is nationality, as tourists attending the event from different destinations interpret and perceive the same risk differently (George & Swart, 2012; Seddighi, Nuttall, & Theocharous, 2001). Studies have also focused on the behavioral predictors of a tourist's perception of risk regarding the desired destination, these include: past travel experience (Gibson & Lepp, 2003), intention of visit (George & Swart, 2012), period of visit (George, 2003), and travel information search (Pizam et al., 2004). Tourists who have travelled abroad are less likely to perceive high levels of risk, as they are able to draw perceptions from previous encounters as opposed to inexperienced travels who would perceive risk more highly (Lepp & Gibson, 2003; Sӧnmez & Graefe, 1998). To favorably influence a tourist's decision regarding travel plans, it is essential to understand the nature of these potential risk incidents, to be able to predict the likelihood of
- 16. them occurring and finally, project the prospective impacts on the industry and economy in an attempt to reduce them (George, 2010). There is a paucity of research that has been conducted regarding the association that exists between a tourist's risk perception and attending a sporting event (Qi, Gibson, & Zhang, 2009). Within this research, it has been identified that the most influential risk factors associated with major sporting events are terrorism and crime (George, 2010). Terrorists have found sport mega-events to be ideal as they can target participating athletes, spectators of the event and corporate sponsors of the event (Atkinson & Young, 2002). The more prestigious and large scale the sporting event, the greater the chance of a terrorist attack; thus, there is considerable concern for sport mega-events such as the Olympic Games and FIFA World Cup™ (Toohey, Taylor, & Lee, 2003). Since the 1960s, these mega-events have been prime targets for terrorism given the advances in mass media coverage and broadcasting (Toohey et al., 2003). The first notorious instance of terrorism at a sport mega-event took place at the 1972 Munich Olympic Games (Toohey et al., 2003), with subsequent incidences at 1996 Atlanta Games as well as the 2000 Sydney Olympic Games. In a study conducted by
- 17. Neirotti and Hilliard (2006) on the 2004 Athens Olympic Games, it was suggested that tourists’ perceptions of risk influenced their attendance to the event, with a considerable number of tourists avoiding the event as a result of the safety and security concerns. In support of this finding, Kim and Chalip (2004) identified that a tourist's perception of increased risk surrounding safety and security could potentially influence their future decision-making to attend or travel to a mega-event. Thus the following hypothesis is proposed: H4: Increased crime-risk perception is positively related to tourists’ satisfaction at the 2014 FIFA World Cup™. 2.5. Satisfaction Advances in international tourism have increased the competition between tourist destinations (Kozak & Rimmington, 2000; Yoon & Uysal, 2005). Furthermore, it has been suggested that tourist satisfac- tion regarding a destination may create repeat visitation (Kozak & Rimmington, 2000). There are numerous models used to assess customer satisfaction. Yoon and Uysal (2005) identified three main common components
- 18. within models. These components are adapted to analyze tourist satisfaction. Expectation satisfaction occurs when tourists develop expectations about a destination before purchasing the trip (Oliver, 1997). Therefore, actual performance is compared with prior expecta- tions. If actual performance trumps expectations, positive disconfirma- tion is attained. The tourist is, therefore, satisfied and is willing to revisit the destination. Should the opposite occur, expectations exceed actual performance, negative disconfirmation occurs. Should a tourist experience this, it is likely that alternative destinations will prevail. Simply put, expectation satisfaction is the result of a comparison between the tourist's prior image of the destination and what the tourist actually sees, feels, and achieves at the destination (Chon, 1989). Equity satisfaction, proposed by Oliver and Swan (1989), compares the relationship between the tourist's costs and the benefits they anticipate. Costs may include price of transportation, the time it takes to arrive at the destination and general effort (Heskett, Sasser, & Schlesinger, 1997). Therefore, if a tourist perceives the benefits thereof to outweigh the costs, the destination is worthwhile. The third component of satisfaction is relative satisfaction (LaTour & Peat, K. Swart et al. Journal of Destination Marketing & Management
- 19. xxx (xxxx) xxx–xxx 3 1979; Oliver & Swan, 1989). Standards operate as a reference for assessing the destination. Dissatisfaction occurs when a destination outperforms the assessed destination based on ideal standards (Yoon & Uysal, 2005). H5: High levels of satisfaction at the 2014 FIFA World Cup™ positively influences the likelihood of repeat visitation to Rio de Janeiro. Satisfaction derived from a destination is likely to affect the tourist's post-visit behavior, which in turn is most likely to affect the tourist's likelihood of repeat visitation. 2.6. Repeat visitation Repeat visitation is referred to as the decision made by a tourist to return to a certain destination after having visited it (Rittichainuwat, Qu, & Leong, 2003) and accounts for more than half of the total arrivals at many destinations (Wang, 2004). Sporting events are particularly useful vehicles to promote sustainable tourism, with the type of event
- 20. determining the overall effect on destination branding (Taks, Chalip, Green, Kesenne, & Martyn, 2009). Tourists attending these events not only experience the original attractions of the destination but are also exposed to an additional desirable atmosphere (Gratton & Taylor, 2000). Mega-events, given the international scope and excessive media exposure, tend to result in longer-term effects on the tourism industry, through repeat visitation (Desbordes & Richelieu, 2012; Taks et al., 2009). Literature has investigated repeat visitation from three perspectives. First, Baloglu and Erickson (1998), and Niininen and Riley (1998) analyzed this construct surrounding destination loyalty, where repeat visitation is a critical factor. Second, Gitelson and Crompton (1984); Gyte and Phelps (1989); Oppermann (1996) and Niininen and Riley (1998) conducted research on the characterizations of the division of tourists that exercise repeat visitations to certain destinations and how a tourist's behavior and motivations are influenced by familiarity. Third, the influencing factors of repeat visitation by analyzing the impact that tourist characteristics, perception of destination quality,
- 21. level of satisfaction and image have on a tourist's future travel arrangements (Court & Lupton, 1997; Fakeye & Crompton, 1991; Juaneda, 1996; Mazursky, 1989; Moutinho & Trimble, 1991). Previous literature on this topic suggests that repeat visitation can materialize as a result of different tourists’ attitudes towards the destination such as the feeling of inertia (Woodside & McDonald, 1994): the attitude of indifference between similar destinations, thus resorting to a previous destination; risk of aversion/ avoiding uncer- tainty (Mitchell & Greatorex, 1993); a compensatory attitude (where a tourist returns to a destination as it satisfies their travel motivations, while avoiding any costs of substitution) (Jones, Mothersbaugh, & Beatty, 2002); an attitude of place attachment (where a tourist decides on the destination based on their emotional ties) (Gitelson & Crompton, 1984; Lee & Allen, 1999); and, finally, the most prominent attitude given the ability to alter it is the utilitarian attitude established in the criteria of cost, quality and satisfaction (Baker & Crompton, 2000; Appiah-Adu, Fyall, & Singh, 2000; Petrick, 2004; Gursoy & McCleary, 2004). A tourist's previous experience of the destination also influences
- 22. repeat visitation (Bowen, 2001; Gyte & Phelps, 1989; Kozak, 2001; Mazursky, 1989). Oppermann (1998) found that if a tourist is satisfied with their experience at a destination, then it is likely that, in the future, when making travel decisions, they may not even consider additional information relating to other destinations. Further insight into the characteristics of repeat visitors and the likelihood of returning to a destination, shows that the probability of returning to a destination is significantly greater with repeat visitors than tourists visiting the destination for the first time (Court & Lupton, 1997; Kozak & Rimmington, 2000). One would assume that perceptions of crime risk would undoubt- edly deter tourists from visiting a particular destination again. However, academic literature is divided in this regard. A study conducted by Sönmez and Graefe (1998) concluded that perceptions of crime risk affect travel decisions, especially with regards to repeat visitation. In addition, the researchers found that tourists’ perceptions of crime risk have a greater effect on future travel decisions than actual safety and risk might have. George (2003), however, investigated tourists’ perceptions of crime risk while visiting Cape Town, South
- 23. Africa, and found that 54% of tourists who encountered a crime would still return to the destination. Therefore, given the indecisive literature, this relationship between crime-risk perceptions and repeat visitation needs to be re-evaluated. The hypothesis testing this relationship is given below. H6: Increased crime risk perception is positively related to a tourist's likelihood of return to Rio de Janeiro after the 2014 FIFA World Cup™. The link between destination image and behavioral intentions, in the form of word-of-mouth and repeat visitation, has been well researched (Bigne et al., 2001; Fakeye & Crompton, 1991; Wang & Hsu, 2010). Court and Lupton (1997), as well as Yang et al. (2009), suggest that there is a direct relationship between destination image and repeat visitation. Castro, Amario and Ruiz (2007) claim that repeat visitation is both directly and indirectly affected by destination image. This literature leads to the following hypothesis: H7: Destination image is positively related to tourists’ likelihood of repeat visitation to Rio de Janeiro. 3. Conceptual model
- 24. After reviewing the literature, the following conceptual model has been constructed, in order to gain a sound understanding of the factors influencing likelihood of repeat visitation to Rio de Janeiro post the event, and word-of-mouth surrounding the host destination. 4. Methodology Due to the quantitative nature of this study, this research took the form of a conclusive descriptive research design in order to test the influences of the independent variables of information search, per- ceived crime-risk, destination image and satisfaction on the dependent variable of repeat visitation. The study made use of a single cross- sectional design. This involved the researchers collecting information from one chosen sample population only once (Malhotra, 2010). This research process was conducted through event-intercept, personal face- to-face interviews with the targeted respondents. The target population for this research comprised international tourists situated in Rio de Janeiro attending the 2014 FIFA World Cup™ from 12 June 2014 to 13 July 2014. Given the international attraction and nature of the study ultimately measuring the likelihood of repeat visitation to Rio de Janeiro,
- 25. the researchers restricted the target population to international sports tourists. For the purposes of this research, international sports tourists refer to those tourists travelling outside the boundaries of their residential country to attend this event. Prior to data collection in Rio de Janeiro, a pre-test was carried out in South Africa. The pre-test process consisted of two stages. First, the questionnaire was tested on a non-probability convenience sample attending a Stormers vs. Force Super Rugby (an ‘international domestic’ tournament featuring the strongest teams in Australia, New Zealand and South Africa) match on 17 May 2014 at the Newlands Rugby Stadium in Cape Town. This event was chosen as these attendees resemble the closest possible similarity to those of the FIFA World Cup™ K. Swart et al. Journal of Destination Marketing & Management xxx (xxxx) xxx–xxx 4 within a local context of the research. Second, in order to test the translated versions of the questionnaire (Portuguese, Italian, French,
- 26. German, Latin American Spanish and Korean), language teachers known to the researchers were approached to ensure that the results obtained through the translated versions were consistent with those of the English questionnaire in order to eliminate any translation bias. A non-probability sampling technique was used since there was no accurate sampling frame available of international tourists attending the 2014 FIFA World Cup™ in Brazil, specifically in Rio de Janeiro. Convenience sampling was used to gather the data, as this is the most effective method when large quantities of completed questionnaires are required, with cost constraints (Malhotra, 2010). Due to the nature of spectator events, interviews were conducted as quickly and efficiently as possible. In order to account for sampling frame error, potential respondents were screened before commencing the questionnaire to ensure that they fit the targeted population. The data collection process took place at the FIFA Fan Fest on Copacabana Beach in Rio de Janeiro during the period between 17 June and 8 July 2014. English questionnaires were issued to the respondents using iSurvey software on Apple iPod touch devices, thus enabling the
- 27. automation of the process. Other language questionnaires were admi- nistered in hard copy when respondents requested a version of the questionnaire in their home language. The researchers of this study were able to recover 270 usable surveys out of a targeted sample size of 300. This is in keeping with previous studies (George & Swart, 2012; Gibson & Lepp, 2003; Taylor & Toohey, 2007) in order to ensure an accurate representation of the population who attended the 2014 FIFA World Cup™. The questionnaire consisted of a filter question to ensure that only international tourists completed the questionnaire. The remainder of the questionnaire comprised the following sections: (1) Satisfaction; (2) Crime-risk perception; (3) Destination Image; (4) Repeat visitation; and (5) Information search. Following this, respondents were asked whether they had been to Rio de Janeiro previously, and, if so, how many times. The respondents were also asked if they had attended a FIFA World Cup™ before and how long they had been in Rio de Janeiro during this visit. The last section of the questionnaire consisted of demographic questions used to complete the descriptive statistics regarding the
- 28. sample population. The questionnaire comprised fixed- alternative questions and respondents chose from a set of predetermined answers. This was intended so that respondents required only a short period of time and little effort to complete the questionnaire, while still providing accurate responses. Once the raw data was collected, the data preparation process was conducted where the data was cleaned and coded by the researchers in Microsoft Excel. This organized data was then exported into the statistical analysis programs SPSS and Smart PLS. Smart PLS was used to validate the constructed conceptual model (Fig. 1) by performing structural equation modeling and path analysis on the predetermined hypotheses. The structural equation modeling approach also allowed testing for expected mediating and moderating relationships between constructs. SPSS was used to determine the descriptive and additional statistics for analysis. 5. Findings 5.1. Test for normality A number of the statistical techniques used in this study assume normality of the data. An overall test for normality was thus
- 29. conducted (see Table A1, Appendix A). The Kolmogorov-Smirnov test was used as the sample was greater than 50 respondents. The significant levels for all items were below .05 and, therefore, we reject the null hypothesis and concluded that the data was not normally distributed. Given the rejection, we tested for normality in relation to the skewness within a range of (−1 and 1) and kurtosis within a range of (−1.5 and 1.5) (see Table A2, Appendix A). In this case, all the items in the scale were normally distributed with the exception of items: Satisfaction 2 and Crime-risk Perception 6, which were approached with caution. 5.2. Descriptive statistics The sample of 270 study respondents consisted of 77% male and 23% female. The majority of respondents recruited were male given the fact that tourists travelling to Brazil for the World Cup were predomi- nantly men. Of the total number of respondents, 56% were between the age of 21 and 30, 28% were between 31 and 40, 11% were between 41 and 50, 3% were older than 51 years of age, and 2% were below the age of 20. These demographic statistics are in line with previous studies conducted by George and Swart (2012), as well as Kim and Chalip
- 30. (2004). The respondents came from 29 different countries; with almost a quarter (22.6%) originating from the United Kingdom, 21.1% from the United States of America, 10% from Australia, 6.7% from Germany, 4.1% from Chile, 4.1% from France, 4.1% from Mexico, 3.7% from Canada, 2.2% from Spain and 2.6% from South Africa. These results are fairly consistent with previous research conducted by South African Tourism (2011) at the 2010 FIFA World Cup™. Of these respondents, 20.4% had previously been to Rio de Janeiro, with 7.4% of these return visitors having travelled to this destination once before, 5.2% twice, 4.4% three times, and 3.7% four or more times. Eighty per cent of respondents were first-time tourists to the destination. This finding is consistent with the FIFA World Cup™ Global Fans Survey, and it is therefore assumed that tourists traveling to FIFA World Cups have little experience within the host destinations (Gabara, 2010). Twenty-six per cent of the respondents had previously attended a FIFA World Cup™ while, the majority (74%) of the study respondents were experiencing the event for the first time. Of those who had been to a FIFA World Cup™, 42.9% had attended the World Cup in Germany,
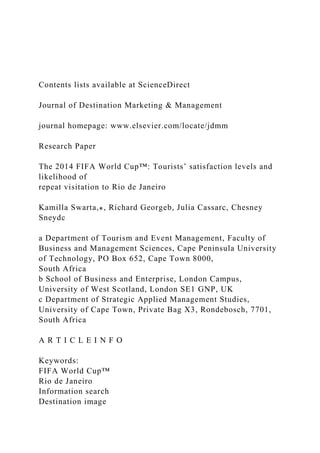
- 31. 40% the World Cup in South Africa, 25.7% the World Cup in the USA, 11.4% the World Cup in Japan, 2.8% the World Cup in Italy, and 1.4% the World Cup in Argentina and Mexico respectively. The duration that the sample respondents had been in Rio de Janeiro varied with 5.6% having been there for a day, 45.8% having been there for between 2 and 5 days, 18.9% between 6 and 9 days, 15.6% between 10 and 13 days and 13.8% had been there for over two weeks. Given the respondents’ duration of time in Rio de Janeiro, 82.6% had not experienced crime with 17.4% experiencing crime during this period. This research aims to determine the impact that information search, crime-risk perception, destination image and satisfaction have on a tourist's repeat visitation to the host destination of Rio de Janeiro. Therefore, these factors make up the constructs of the study. As seen in Table 1, the mean for information search, crime-risk perception, destination image, Satisfaction and Repeat visitation are 3.6, 3.68, 3.00, 3.96 and 1.97 and the standard deviations .84, .76, .64, .67 and .80 respectively. This implies that on average, respondents were slightly above neutral, as to whether they made use of InformationFig. 1. Proposed structural model.
- 32. K. Swart et al. Journal of Destination Marketing & Management xxx (xxxx) xxx–xxx 5 search prior to their trip, suggesting that on average, respondents were likely to make use of information search. In terms of crime-risk perception, on average, respondents felt average to fairly safe while in Rio de Janeiro for the World Cup. Furthermore, on average, respondents had a neutral destination image of Rio de Janeiro, which includes infrastructure, accommodation, hygiene and cleanliness and expense. In relation to satisfaction, respondents were on average satisfied with the host destination and felt it was worth their while. Lastly, on average, respondents were disinclined to return to Rio de Janeiro. This may, however, be due to the multidimensional scale used to measure this construct. Respondents were asked whether they would return to Rio de Janeiro, as well as whether crime would deter them from returning, given this, the mean may be negatively skewed and should be interpreted with caution. 5.3. Path modeling statistics
- 33. This section discusses the results obtained from the PLS output, including the measurement model and then the structural model. 5.3.1. Measurement model In relation to the measurement model, the reliability and validity were measured. First, the reliability of the model was analyzed through internal consistency reliability and indicator reliability. Following this, the validity was analyzed through convergent and discriminant valid- ity. 5.3.1.1. Reliability. Internal consistency reliability was used to assess the reliability of the summated scale and the items measuring it, where a Cronbach alpha of greater than .6 and a composite reliability of greater than .7 indicate satisfactory reliability (Malhotra, 2010). Therefore, all the latent constructs within this model exhibit internal consistency reliability, except information search, as the Cronbach alpha falls below the benchmark (see Table 2). However, information search exhibits satisfactory composite reliability and is approaching internal consistency with a Cronbach alpha of .59. In order to obtain this Cronbach alpha score, the item measuring the use of the foreign office website as a form of Information search, was deleted, as the
- 34. Cronbach alpha, when all four items were included, was only .46. In relation to repeat visitation, the item measuring the return for the tourists to the 2016 Olympic Games was deleted, due to the fact that the Cronbach alpha prior was .49. The indicator reliability of the model assesses the item loadings, which are sufficiently reliable when greater than .7. All the items in the model loaded on the corresponding latent variables and most of these loadings, exceeded the benchmark except for Information Search item 2 and Destination Image item 4. Nonetheless, these items were retained as Information search 2 (.55) exceeds the minimal threshold of .5 and Destination Image 4 (.34) was approaching this acceptable threshold. As a result of this output, the scales used to measure the latent constructs within the model were deemed reliable. 5.3.1.2. Validity. To assess the robustness of fit of the measurement model, both convergent validity and discriminant validity were performed. For convergent validity, all items loaded significantly at the 5% significance level on the latent constructs and every latent constructs exhibited an AVE greater than the .5 threshold as seen in
- 35. Table 2 (Fornell & Larcker, 1981). In measuring the discriminant validity the Fornell-Larcker criterion was used. In order for the model to exhibit discriminant validity the squared root of the AVE of a latent variable should be higher than the correlations between the latent variable itself and the other latent variable constructs within the model. In addition to this, discriminant validity was confirmed by ensuring that the factor loadings of the indicators on their assigned latent variables were higher than the cross loadings on all the other latent variables. As seen in Table 3, the square root AVEs were significantly greater than the correlations between the other latent variables. Furthermore, all the loadings of the indicators on their assigned latent variables exceeded the cross loadings on the other latent variables and the Fornell- Larcker criterion was sufficiently met. The proposed model is, therefore, deemed valid and the structural model can be examined. 5.3.2. Structural model As illustrated in Fig. 2, the model explains 24% of the variation that exists within the repeat visitation construct. This implies that the variance explained by the model is moderate (Chin, 1998). In addition to this, all the hypothesized paths were found to be significant
- 36. at a 5% significance level with a t-statistic greater than 1.96. First, the model suggests that there is a significant negative relationship between Information search and Destination image, how- ever this contradicts H1, which suggests a positive relationship between information search and destination image. Second, there is a significant positive relationship between destination image and crime-risk percep- tion, validating H2. Third, there is a significant positive relationship between destination image and satisfaction, which validates H3. Following this, there is a significant positive relationship between crime-risk perception and satisfaction, validating H4. Fourth, there is a significant positive relationship between satisfaction and repeat visita- tion, validating H5. Fifth, within the model there is also a significant positive relationship between crime-risk perception and repeat visita- tion, validating H6. Finally, it was found that there was a significant positive relationship between destination image and repeat visitation, validating H7. In addition to this, given that the beta value of the relationship between crime-risk perception and repeat visitation decreases from .392 to .165 when satisfaction is included in the model and that the
- 37. relationships between crime-risk perception and satisfaction, as well as the relationship between satisfaction and repeat visitation are signifi- cant, it is concluded that satisfaction partially mediates the relationship between crime-risk perception and repeat visitation. The effect size of this mediation (.12), however, is weak. Satisfaction also partially mediates the relationship between desti- nation image and repeat visitation as the beta value of the relationship between destination image and repeat visitation decreases from .127 to .097 when satisfaction is included in the model. This can be concluded as the relationships between destination image and satisfaction, as well as satisfaction and repeat visitation, are significant. The effect size of this mediation of .10 is, however, weak. Crime-risk perception also partially mediates the relationship Table 1 Descriptive statistics for the summated constructs. N Mean Std. Deviation Information search Crime-risk- perception 270
- 38. 270 3.60 3.68 .84 .76 Destination image Satisfaction 270 270 3.00 3.96 .64 .67 Repeat visitation 270 1.97 .80 Table 2 Reliability indicators for measurement model. Latent construct AVE Composite Reliability Cronbach's Alpha Crime-risk perception 0,57 0,89 0,85 Destination image 0,54 0,81 0,70 Information search 0,55 0,78 0,59 Repeat visitation 0,73 0,84 0,63 Satisfaction 0,60 0,82 0,66 K. Swart et al. Journal of Destination Marketing & Management xxx (xxxx) xxx–xxx
- 39. 6 between destination image and satisfaction, as when crime-risk percep- tion is included in the model, the beta value of this relationship decreases from .302 to .101, while the relationships between destina- tion image and crime-risk perception, as well as the between crime-risk perception and satisfaction, are both significant. The effect size of this mediation of .159 is moderate. 6. Discussion Overall, the results of the conceptual model show that the more information search conducted by tourists prior to their travels to Rio de Janeiro for the 2014 FIFA World Cup™, the less favorable their destination image. In contrast to this, literature suggests tourists conduct information search to form favorable perceptions of destina- tions and to ultimately reduce perceived risk (Fodness & Murray, 1999). However, given the mass protests that took place prior to the World Cup, which were the largest and most significant protests in Brazil for a generation, shaking the country's entire political system, the informa- tion search conducted by tourists was likely to be negatively influenced by the mass media coverage of these violent events, creating an
- 40. unfavorable image of Rio de Janeiro (Saad-Filho, 2013). It was also found that the more favorable the destination image of Rio de Janeiro, the more satisfied the tourists were with their travels to the host destination. This relationship is well supported by previous research conducted by Castro, Amario and Ruiz (2007), Court and Lupton (1997), as well as Yang et al. (2009) all reporting a positive relationship between destination image and satisfaction. In relation to this, this research concludes that those tourists with a more favorable destination image felt safer within Rio de Janeiro. It was also found that the more favorable the destination image, the more likely they are to return to the host destination. Lepp and Gibson (2003) support this finding as they concluded that the safer a tourist feels, the more favorable their image of the destination, which, in turn, made them feel even safer, leading to positive touristic behavior of repeat visitation. The positive relationship between destination image and repeat visita- tion supports previous studies by Fakeye and Crompton (1992), Court and Lupton (1997) as well as Castro, Amario and Ruiz (2007). Unsurprisingly, given the heavy security presence in stadium precincts, tourists felt safer at the event venues such as the stadiums and
- 41. fan parks and general event atmosphere, as opposed to when in general public areas in the day, within Rio de Janeiro at night, and when using public transport (Table A3, Appendix A). Furthermore, it was found that the tourists who perceived Rio de Janeiro to be safer were more satisfied with their decision to travel to the host destination. This finding is in line with extensive mega-event research, which finds a significant relationship between crime- risk perception indicating that a more positive perception of crime increases satisfaction levels drastically (Boo & Gu, 2010; George, Swart, & Jenkins, 2013). This study also found that those tourists who felt safer within the host city during this event, exhibited a greater intention to return to the destination. This relationship is endorsed by previous mega-event research (Boo & Gu, 2010; George et al., 2013; George, 2010; Qi et al., 2009). The final core relationship finding of this study indicates that the more satisfied tourists were during their stay in Rio de Janeiro during the 2014 FIFA World Cup™, the stronger their intention of returning to this destination. This finding is also in line with previous
- 42. literature surrounding mega-events, which illustrate a positive relationship between satisfaction and repeat visitation, as the increased satisfaction instils a greater desire to re-experience these satisfying occasions (Baker & Crompton, 2000; Boo & Gu, 2010; George & Swart, 2012, George et al., 2013). In addition to the conceptual model, it was found that gender does not influence the crime-risk perception of tourists (Table A4, at a p- value of .112 (p > .05)), supporting earlier studies by Sӧnmez and Graefe (1998), George (2003) and Lepp and Gibson (2003). Previous FIFA World Cup™ attendance, however, did influence a tourist's crime- risk perception, with those who had previously attended feeling more unsafe (Table A5, at a p-value of .029 (p < .05)). A possible explanation for this is that 42.9% of the 25.9% of tourists who had previously attended a World Cup, attended the World Cup in Germany, which is perceived to be safer than Rio de Janeiro, Brazil, while those who had not attended had no point of reference of crime at an event of this nature. It was also found that previous experience within Rio de Janeiro had no influence on the tourist’s information search. It can be
- 43. concluded that both first-time tourists to the host destination, as well Table 3 Latent variable cross correlation matrix. Crime-risk perception Destination image Information search Repeat visitation Satisfaction Crime-risk perception .75 0 0 0 0 Destination image 0,4595 .74 0 0 0 Information search −0,1193 −0,2093 .74 0 0 Repeat visitation 0,386 0,2801 −0,1077 .85 0 Satisfaction 0,5329 0,3242 0,0201 0,4502 .77 Fig. 2. Structural model. K. Swart et al. Journal of Destination Marketing & Management xxx (xxxx) xxx–xxx 7 as repeat visitors, did a fair amount of information search prior to their travels (Table A6, at a p-value of .695 (p > .05)). This can be explained through the hosting of the 2014 FIFA World Cup™ within this city, thus even those who had previously experienced Rio de Janeiro did extensive information search surrounding the event within the city. While Teigen, Brun, and Slovic (1988) as well as Reisinger and Mavondo (2006) suggest that international tourists’ perceptions
- 44. of crime risk vary between different nationalities, this study found that there was no difference between different nationality's crime- risk perceptions (p-value of .242 (p > .05) in Table A7, Appendix A) albeit the unequal quota of nationalities in the study. 7. Conclusion This research aimed to test the influence of an information search, destination image and perceived crime risk on satisfaction, and ultimately the likelihood of repeat visitation to Rio de Janeiro after attending the 2014 FIFA World Cup™ in the city. This study adds to previous literature surrounding tourists’ perceptions of crime risk and their future travel intentions during a sporting mega-event by devel- oping a conceptual model (Fig. 1), which included information search and destination image as constructs to improve the explanation of variance in repeat visitation. This conceptual model proved to be both reliable and valid with 24% variance explained. Overall, the results of the conceptual model showed that the more information search conducted by tourists prior to their travels to Rio de Janeiro for the 2014 FIFA World Cup™, the less favorable was their
- 45. destination image. This could have been influenced by the significant protests in the lead-up to the event, creating an unfavorable image of Rio de Janeiro. Additionally, the more favorable the destination image of Rio de Janeiro, the more satisfied were the tourists with their travels to the host destination and the more likely they are to return to the host destination. This study also concludes that those tourists who felt safer within the host city during this event, exhibited a greater intention to return to the destination. Although gender does not influence the crime-risk perception of tourists, previous FIFA World Cup™ attendance did influence a tourist's crime-risk perception, with those who had previously attended feeling more unsafe possibly as a result of a 'safer' World Cup experience in Germany. However, previous visitation to Rio de Janeiro had no influence on the tourists’ information search, which is likely linked to the hosting of the mega-event itself as opposed to experience with the destination. Finally, it was found that nationality did not influence a tourist's crime-risk perception; given the unequal quota of nationalities, however, this finding cannot be accurately concluded. 8. Managerial implications
- 46. This study's main contribution to the sport tourism literature is the formation of a valid model, illustrating that a positive destination image and a perception of safety is likely to create repeat visitation through heightened satisfaction. The formation of this destination image and crime-risk perception is influenced by the tourist's information search. Hence, this study's main suggestion is that destination marketers must ensure that information available to tourists through various media forms is positive and accurate. This research suggests that the destination marketer's role is to attract potential first-time tourists to Rio de Janeiro. This is done by the creation and marketing of a positive destination image through information sources and by allaying tourists’ concerns about safety. Destination marketers do little to directly influence repeat visitation, since satisfaction and crime-risk perception are positively related to repeat visitation. Hence, the focus of destination marketers should be to attract first-time tourists to Rio de Janeiro. Mega-events, such as the 2014 FIFA World Cup™, are useful tools in attracting first-time visitors. This is illustrated by the fact that 80% of respondents during the 2014 FIFA World Cup™ had never previously been to Rio de Janeiro.
- 47. Destination marketers, in conjunction with security officials, should aim to identify crime-risk factors associated with Rio de Janeiro in order to better understand destination image in terms of crime risk and safety. As tourists felt safer when at the 2014 FIFA World Cup™ venues, perceptions of safety in the host city need more attention than perceptions of safety at the event specifically. Destination specific measures, such as visible policing and surveillance cameras beyond the stadium precincts, should be strictly enforced by officials and communicated effectively by destination marketers. 9. Limitations This study's primary limitation is that the model constructed, explains only 24% of the variance within the model. This means that there are additional factors that influence a tourist's likelihood of repeat visitation that were not included in this study's model. Secondary to this, the sample size of 270 is small in comparison to the 1 million foreign tourists who visited Brazil during the 2014 FIFA World Cup™ (Marcopoto, 2014). This was due to financial, time and human resource constraints. Although this sample size is an improve- ment from studies highlighted previously, it may not be entirely
- 48. representative of the tourist population. In order for more accurate results and possibly a better explanation of the variation in repeat visitation, a more robust sample is required. This study focused on foreign tourists visiting Rio de Janeiro to attend the FIFA World Cup™. However, these tourists very likely visited other cities in Brazil as well. The differences in social and geographic factors between cities, especially São Paolo and Rio de Janeiro are underscored (Arantes & Tanaka, 2014). Many respondents stated how different Rio de Janeiro was compared to other cities, such as São Paolo, with regards to their perceptions of crime risk. Hence, tourists who had travelled to São Paulo and experienced crime, could have allowed this experience to subconsciously influence their perceptions of Rio de Janeiro. Based on the findings of the study, managerial implications and the study's limitations, further research is needed to discover more about interactions within the constructed model as well as to overcome some of the limitations experienced within this study. 10. Future research One possible research avenue could be to further explore the
- 49. effect of event image on destination image and vice versa. This inter- relationship needs to be scrutinized within the theoretical framework, so as to determine their mutual dependence and their impact on tourist behavior. Limited research into image transfer has been conducted in relation to sports mega-events (Kaplanidou & Vogt, 2007). For success- ful destination and event marketing, marketers need to better under- stand how event images impact upon the image of the destination. In order to gain a better understanding of the repeat-visitation construct, it may be valuable to adapt it to explore repeat visitation to the World Cup and not necessarily to the destination. In adapting the repeat-visitation construct, destination marketers can determine where a tourist's behavioral intentions lie and, therefore, how to best persuade the tourist to visit the destination again rather than following the World Cup. An additional construct exploring safety measures implemented at sporting mega-events, and the effect thereof, could assist in explaining more of the variance within the repeat visitation construct, especially in relation to safety at event venues versus the destination itself.
- 50. K. Swart et al. Journal of Destination Marketing & Management xxx (xxxx) xxx–xxx 8 Appendix A. Statistical tables See Tables A1–A7. Table A1 Test for normality: Kolmogorov-Smirnov. Kolmogorov-Smirnova Statistic Sig. Satisfaction How does Rio de Janeiro, as a tourist destination, rate compared to what you expected? .269 .000 Was this visit worth your time and effort? .271 .000 How would you rate Rio de Janeiro as a holiday destination compared to similar places you have visited|? Crime Risk Perception .279 .000 Perceive Rio de Janeiro to be .211 .000 Feel in public (i.e. restaurants and shopping malls) in Rio de Janeiro during the day .262 .000
- 51. Feel in public in Rio de Janeiro at night .192 .000 The event atmosphere in Rio de Janeiro makes you feel .248 .000 Feel using public transport in Rio de Janeiro .198 .000 Feel when at 2014 FIFA World Cup venues (i.e. stadiums, fan parks) Destination Image .293 .000 Rio de Janeiro has quality infrastructure (roads & airports) .244 .000 Rio de Janeiro has suitable accommodation .246 .000 Rio de Janeiro has a good standard of hygiene and cleanliness .210 .000 Rio de Janeiro is not an expensive place to visit .242 .000 Repeat Visitation I do not plan to return to Rio de Janeiro in the future .258 .000 I will not return to Rio de Janeiro for the 2016 Olympics .257 .000 I will not return to Rio de Janeiro for fear of crime .264 .000 Information Search I made use of news reports and media before arriving in Rio de Janeiro .245 .000 I made use of the official FIFA website before arriving in Rio de Janeiro .270 .000 I spoke to friends and family about Rio de Janeiro .255 .000 I made use of the foreign office website before arriving in Rio de Janeiro .250 .000 Table A2 Test for normality. Mean Standard Deviation Skewness Kurtosis
- 52. Satisfaction How does Rio de Janerio, as a tourist destination, rate compared to what you expected? Was the visit worth your time and effort? How would you rate Rio de Janerio as a holiday destination compared to similar places you have visited? 3.86 4.25 3.78 .831 .921 .837 -.403 -1.461 -.442 -.328 2.253 -.067 Crime Risk Perception Perceived Rio de Janerio to be Feel safe in public (i.e. restaurants and shopping malls) in Rio de Janerio during the day Feel safe in public in Rio de Janerio at night The event atmosphere in Rio de Janerio makes you feel Feel using public transport in Rio de Janerio Feel when at 2014 FIFA World Cup Venues (i.e. stadiums and
- 53. fan parks) 3.24 4.01 3.10 3.93 3.50 4.26 1.073 .860 1.144 .956 1.086 .945 -.319 -.693 -.107 -.786 -.421 -1.399 -.545 .135 -.873 .340 -.360 1.699 Destination image Rio de Janerio has quality infrastructure (roads and airports) Rio de Janerio has quality has suitable accommodation Rio de Janerio has a good standard of hygiene and cleanliness
- 54. 2.68 3.36 2.58 1.138 .879 1.066 .162 -.495 .166 -1.127 .123 -.878 Information search I made use of news reports and media before arriving in Rio de Janerio I made use of the official FIFA website before arriving in Rio de Janerio I spoke to family and friends about Rio de Janerio I made use of the foreign office website before arriving in Rio de Janerio 3.51 3.33 3.97 2.19 1.120 1.273 1.025 1.162
- 55. -.509 -.428 -.990 .728 -.524 -1.01 .558 -.525 Repeat Visitation I do not plan to visit Rio de Janerio in the future I will not return to Rio de Janerio for the 2016 Olympics I will not return to Rio de Janerio for fear of crime 3.82 2.7 1.76 1.049 1.23 .807 −.682 .529 .892 -.331 -.728 .275 K. Swart et al. Journal of Destination Marketing & Management xxx (xxxx) xxx–xxx 9
- 56. References Alhemoud, A., & Armstrong, E. (1996). Image of tourism attraction in Kuwait. Journal of Travel Research, 34(4), 46–80. Appiah-Adu, K., Fyall, A., & Singh, S. (2000). Marketing culture and customer retention in the tourism industry. Service Industries Journal, 20(2), 95–113. Arana, J., & Leon, C. (2008). The impact of terrorism on tourism demand. Annals of Tourism Research, 35(2), 299–315. Table A3 Descriptive statistics of crime-risk perception items. N Minimum (Very Unsafe) Maximum (Very Safe) Mean Std. Deviation Perceive Rio de Janeiro to be 270 1 5 3.24 1.073 Feel in public (i.e. restaurants and shopping malls) in Rio de Janeiro during the day 270 1 5 4.01 .860 Feel in public in Rio de Janeiro at night 270 1 5 3.10 1.144 The event atmosphere in Rio de Janeiro makes you feel 270 1 5 3.93 .956 Feel using public transport in Rio de Janeiro 270 1 5 3.50 1.086 Feel when at 2014 FIFA World Cup venues (i.e. stadiums, fan parks) 270 1 5 4.26 .945 Table A4 Independent sample t-test for gender.
- 57. Levene's Test for Equality of Variances t-test for Equality of Means F Sig. t df Sig. (2- tailed) Mean Difference Std. Error Difference 95% Confidence Interval of the Difference Lower Upper Crime risk perception Equal variances assumed 1.647 .200 1.594 268 .112 .175 .110 −.041 .392 Equal variances not assumed 1.448 87.977 .151 .175 .121 −.065 .416 Table A5 Independent sample t-test for previous World Cup attendance. Levene's Test for Equality of
- 58. Variances t-test for Equality of Means F Sig. t df Sig. (2- tailed) Mean Difference Std. Error Difference 95% Confidence Interval of the Difference Lower Upper Crime risk perception Equal variances assumed 2.947 .087 −2.192 268 .029 −.230 .105 −.437 −.023 Equal variances not assumed −2.067 109.241 .041 −.230 .111 −.451 −.010 Table A6 Independent sample t-test for previous experience. Levene's Test for Equality of
- 59. Variances t-test for Equality of Means F Sig. t df Sig. (2- tailed) Mean Difference Std. Error Difference 95% Confidence Interval of the Difference Lower Upper Information search Equal variances assumed .546 .461 .393 268 .695 .042 .107 −.169 .254 Equal variances not assumed .387 82.351 .699 .042 .109 −.174 .259 Table A7 ANOVA of nationality and crime-risk perception. Sum of Squares df Mean Square F Sig. Between groups 18.948 28 .677 1.189 .242 Within groups 137.143 241 .569 Total 156.091 269
- 60. K. Swart et al. Journal of Destination Marketing & Management xxx (xxxx) xxx–xxx 10 http://refhub.elsevier.com/S2212-571X(16)30168-8/sbref1 http://refhub.elsevier.com/S2212-571X(16)30168-8/sbref1 http://refhub.elsevier.com/S2212-571X(16)30168-8/sbref2 http://refhub.elsevier.com/S2212-571X(16)30168-8/sbref2 http://refhub.elsevier.com/S2212-571X(16)30168-8/sbref3 http://refhub.elsevier.com/S2212-571X(16)30168-8/sbref3 Arantes, M., & Tanaka, G. (2014). The case of São Paulo, Brazil. University of São Paulo, 1–40. Atkinson, M., & Young, K. (2002). Terror games: Media treatment of security issues at the 2002 Winter Olympic Games. Olympika: The International Journal of Olympic Studies, 11(1), 53–78. Baker, D., & Crompton, J. (2000). Quality, satisfaction and behavioral intentions. Annals of Tourism Research, 27(3), 785–804. Baloglu, S., & Erickson, R. (1998). Destination loyalty and switching behavior of travellers: A Markov analysis. Tourism Analysis, 2(1), 119– 127. Baloglu, S., & McClearly, K. (1999). A model of destination image formation. Annals of Tourism Research, 26(4), 868–897.
- 61. Barchfield, J. (2013). Confederation Cup protests target match in Rio [Online]. Available: ⟨ http://www.huffingtonpost.com/2013/06/30/confederation- cup-protests_n_ 3526184.html⟩ (accessed 16.03.14). Barker, M., Page, S., & Meyer, D. (2002). Modeling tourism crime: The 2000 America's Cup. Annals of Tourism Research, 29(2), 762–782. Barker, M., Page, S., & Meyer, D. (2003). Urban visitor perceptions of safety during a special event. Journal of Travel Research, 41(4), 355–361. Beatty, S., & Smith, S. (1987). External search effort: An Investigation across several product categories. Journal of Consumer Research, 14(1), 83– 95. Bieger, T., & Laesser, C. (2004). Information sources for travel decisions: Towards a source process model. Journal of Travel Research, 42(1), 357– 371. Bigne, J., Sánchez, M., & Sánchez, J. (2001). Tourism image, evaluation variables and after purchase behaviour: Interrelationship. Tourism Management, 22(6), 607–616. Boakye, K. (2010). Studying tourists' suitability as crime targets. Annals of Tourism Research, 37(3), 727–743. Boo, S., & Gu, H. (2010). Risk perception of mega-events. Journal of Sport & Tourism,
- 62. 15(2), 139–161. Bowen, D. (2001). Antecedents of consumer satisfaction and dissatisfaction on long-haul inclusive tours: A reality check on theoretical considerations. Tourism Management, 22(1), 49–61. Buhalis, D., & Law, R. (2008). Progress in information technology and tourism management: 20 years on and 10 years after the Internet: The state of eTourism research. Tourism Management, 29(4), 609–623. Burgess, J. A. (1978). Image and Identity. Occasional Papers in Geography. No. 23. University of Hull Publications. Cadotte, E., Woodruff, R., & Jenkins, R. (1987). Expectations and norms in models of consumer satisfaction. Journal of Marketing Research, 24(1), 305–314. Cai, L. (2002). Cooperative branding for rural destinations. Annals of Tourism Research, 29(3), 720–742. Carr, N. (2001). An exploratory study of gendered differences in young tourists' perceptions of danger within London. Tourism Management, 22(1), 565–570. Castro, C., Armario, E., & Ruiz, D. M. (2007). The influence of market heterogeneity on the relationship between a destination's image and tourists' future behavior. Tourism
- 63. Management, 28(1), 175–187. Chen, C., & Tsai, D. (2007). How destination image and evaluative factors affect behavioral intentions?. Tourism Management, 28(1), 1115– 1122. Chesney-Lind, M., & Lind, I. (1986). Visitors as victims: Crimes against tourists in Hawaii. Annals of Tourism Research, 13(1), 167–191. Chin, W. (1998). The partial least squares approach to structural equation modeling. Modern Methods for Business Research, 29(2), 295–336. Chon, K. (1989). Understanding recreational travelers' motivation, attitude and satisfaction. The Tourist Review, 44(1), 3–7. Cornelissen, S., & Swart, K. (2006). The 2010 World Cup as a political construct: The challenge of making good on an African promise. Sociological Review, 54(1), 108–123. Court, B., & Lupton, R. (1997). Customer portfolio development modeling destination adopters, inactives and rejecters. Journal of Travel Research, 36(1), 35–43. Deng, Q., & Li, M. (2013). A model of event-destination image transfer. Journal of Travel Research, 53(1), 69–82. Desbordes, M., & Richelieu, A. (Eds.). (2012). Global sport marketing: Contemporary issues and practice., Oxfordshire: Routledge.
- 64. Dimanche, F., & Leptic, A. (1999). New Orleans tourism and crime: A case study. Journal of Travel Research, 38(1), 19–23. Donaldson, R., & Ferreira, S. (2007). Crime, perceptions and touristic decision-making: Some empirical evidence and prospects for the 2010 World Cup. South African Journal of Political Studies, 34(3), 353–371. Dowling, G., & Staelin, R. (1994). A model of perceived risk and intended risk-handling activity. Journal of Consumer Research, 21(1), 119–134. Fakeye, P., & Crompton, J. (1991). Image differences between prospective, first-time, and repeat visitors to the lower Rio Grande Valley. Journal of Travel Research, 21(1), 10–16. Fakeye, P., & Crompton, J. (1992). Importance of socialization to repeat visitation. Annals of Tourism Research, 19(1), 364–367. Faulkner, B., & Vikulov, S. (2001). Katherine, washed out one day, back on track the next: A post-mortem of a tourism disaster. Tourism Management, 22(1), 331–344. Fodness, D., & Murray, B. (1999). A model of tourist information search behavior. Journal of Travel Research, 37(3), 220–230. Fornell, C., & Larker, D. F. (1981). Evaluating structural equation models with
- 65. unobservable variables and measurement error. Journal of Marketing Research, 18(1), 39–50. Fujii, E., & Mak, J. (1980). Tourism and crime: Implications for regional development policy. Regional Studies, 14(1), 27–36. Gabara, R. (2010). World Cup legacy: World Cup surveys highlight success [Online]. Available: ⟨ http://www.southafrica.info/2010/fifa- surveys.htm#.V5EdJWi7ikr⟩ (accessed 21.07.16). Gammon, S., & Robinson, T. (2003). Sports tourism: A conceptual framework. Journal of Sport Tourism, 8(1), 21–26. George, R. (2003). Tourists' perceptions of safety and security while visiting Cape Town. Tourism Management, 24(5), 575–585. George, R. (2010). Visitor perceptions of crime-safety and attitudes towards risk: The case of Table Mountain National Park, Cape Town. Tourism Management, 31(6), 806–815. George, R., & Swart, K. (2012). International tourists' perceptions of crime-risk and their future travel intentions during the 2010 FIFA World Cup ™ in South Africa. Journal of Sport & Tourism, 17(3), 201–223. George, R., Swart, K., & Jenkins, D. W. (2013). Harnessing the power of football: Safety-
- 66. risk perceptions of sport tourists at the 2013 FIFA Confederations Cup™ in Brazil. Journal of Sport & Tourism, 18(4), 241–263. Getz, D. (2008). Event tourism: Definition, evolution and research. Tourism Management, 29(3), 403–428. Gibson, H. (2010). Active sport tourism: Who participates? Journal of Leisure Studies, 17(2), 155–170. Gibson, H., Attle, S., & Yiannakis, A. (1998). Segmenting the sport tourist market: A lifespan perspective. Journal of Vacation Marketing, 4(1), 52– 64. Gibson, H., & Lepp, A. (2003). Tourist roles, perceived risk and international tourism. Annals of Tourism Research, 30(5), 606–624. Gitelson, R., & Crompton, J. (1984). Insights into the repeat vacation phenomenon. Annals of Tourism Research, 11(1), 199–217. Goodrich, J. (2002). September 11, 2001 Attack on America: A record of the immediate impacts and reactions in the USA travel and tourism industry. Tourism Management, 23(6), 573–580. Gratton, C., & Taylor, P. (2000). The economics of sport and recreation. New York, NY: E & FN Spon. Grix, J., Brannagan, P. M., & Houlihan, B. (2015). Interrogating
- 67. states' soft power strategies: A case study of sports mega-events in Brazil and the UK. Global Society, 29(3), 463–479. Gunn, C. (1972). Vacationscape: Designing tourist regions. Austin: Bureau of Business Research, University of Texas. Gursoy, D., & McCleary, K. (2004). An integrative model of tourists' information search behavior. Annals of Tourism Research, 31(2), 353–373. Gyte, D., & Phelps, A. (1989). Patterns of destination repeat business: British tourists in Mallorca, Spain. Journal of Travel Research, 28(1), 24–28. Harper, D. (2001). Comparing tourists' crime victimization. Annals of Tourism Research, 28(4), 1053–1056. Heskett, J., Sasser, W., & Schlesinger, L. (1997). The service profit chain. New York: The Free Press. Hinch, T., & Higham, J. (2001). Sport Tourism: A framework for research. International Journal of Tourism Research, 3(1), 45–48. Hinch, T., Higham, J., & Sant, S.-L. (2014). Taking stock of sport tourism research. In A. Lew, M. C. Hall, & A. M. Williams (Eds.). The Wiley Blackwell companion to tourism, (pp. 413–424). Oxford: John Wiley & Sons. Jarrel, S., & Howsen, R. (1990). Transient crowding and crime.
- 68. American Journal of Economics and Sociology, 49(4), 483–493. Jones, M. A., Mothersbaugh, D., & Beatty, S. (2002). Why customers stay: Measuring the underlying dimensions of services switching costs and managing their differential strategic outcomes. Journal of Business Research, 55(6), 441– 450. Juaneda, C. (1996). Estimating the probability of return visits using a survey of tourist expenditure in the Balearic Islands. Tourism Economics, 2(4), 339–352. Kaplanidou, K., & Vogt, C. (2007). The interrelationship between sport event and destination image and sport tourists' behaviours. Journal of Sport & Tourism, 12(3), 183–206. Kim, N., & Chalip, L. (2004). Why travel to the FIFA World Cup? Effects of motives, background, interest, and constraints. . Tourism Management, 25(1), 695–707. Knott, B., Fyall, A., & Jones, I. (2015). The nation branding opportunities provided by a sport mega-event: South Africa and the 2010 FIFA World Cup. Journal of Destination Marketing & Management, 4, 45–56. Knott, B., & Swart, K. (2015). Sport tourism. In R. George (Ed.), Managing tourism in South Africa, (pp. 417–437). 2nd ed.Cape Town: Oxford University Press.
- 69. Kozak, M. (2001). Repeaters' behavior at two distinct destinations. Annals of Tourism Research, 28(3), 784–807. Kozak, M., & Rimmington, M. (2000). Tourist satisfaction with Mallorca, Spain, as an off- season holiday destination. Journal of Travel Research, 30(3), 260–269. LaTour, S., & Peat, N. (1979). Conceptual and methodological issues in consumer satisfaction research. In R. Ralph Day, & B. Wilkie (Eds.). Advances in consumer research, (pp. 31–35). Indiana, USA: Indiana University Press. Lee, C., & Allen, L. (1999). Understanding individuals' attachment to selected destinations: An application of place attachment. Tourism Analysis, 4(1), 173–185. Lepp, A., & Gibson, H. (2003). Tourist roles, perceived risk and international tourism. Annals of Tourism Research, 30(3), 606–624. Levantis, T., & Gani, A. (2000). Tourism demand and the nuisance of crime. International Journal of Social Economics, 27(1), 959–967. Lin, J., Chen, T., & Liu, C. (2003). The influence of tourism image on tourists' behavioral intention on Taiwan's coastal scenic area: Testing the mediating variable of tourists' satisfaction. Journal of Outdoor Recreation Study, 16(2), 1–22 (Chinese with English summary).
- 70. Malhotra, N. (2010). Marketing research: An applied orientation (6th ed.). New Jersey, NJ: Pearson Education, Inc. Marcopoto, T. (2014). Brazil claims ‘victory’ in World Cup [Online]. Available: ⟨ http:// edition.cnn.com/2014/07/16/travel/brazil-world-cup-tourism/⟩ (accessed 08. 09.14). Maser, B., & Weiermair, K. (1998). Travel decision-making: From the vantage point of perceived risk and information preferences. Journal of Travel and Tourism Marketing, 7(4), 155–170. K. Swart et al. Journal of Destination Marketing & Management xxx (xxxx) xxx–xxx 11 http://refhub.elsevier.com/S2212-571X(16)30168-8/sbref4 http://refhub.elsevier.com/S2212-571X(16)30168-8/sbref4 http://refhub.elsevier.com/S2212-571X(16)30168-8/sbref5 http://refhub.elsevier.com/S2212-571X(16)30168-8/sbref5 http://refhub.elsevier.com/S2212-571X(16)30168-8/sbref5 http://refhub.elsevier.com/S2212-571X(16)30168-8/sbref6 http://refhub.elsevier.com/S2212-571X(16)30168-8/sbref6 http://refhub.elsevier.com/S2212-571X(16)30168-8/sbref7 http://refhub.elsevier.com/S2212-571X(16)30168-8/sbref7 http://refhub.elsevier.com/S2212-571X(16)30168-8/sbref8 http://refhub.elsevier.com/S2212-571X(16)30168-8/sbref8 http://www.huffingtonpost.com/2013/06/30/confederation-cup- protests_n_3526184.html http://www.huffingtonpost.com/2013/06/30/confederation-cup-
- 75. http://refhub.elsevier.com/S2212-571X(16)30168-8/sbref72 http://refhub.elsevier.com/S2212-571X(16)30168-8/sbref72 http://refhub.elsevier.com/S2212-571X(16)30168-8/sbref73 http://refhub.elsevier.com/S2212-571X(16)30168-8/sbref73 http://refhub.elsevier.com/S2212-571X(16)30168-8/sbref73 http://refhub.elsevier.com/S2212-571X(16)30168-8/sbref73 http://refhub.elsevier.com/S2212-571X(16)30168-8/sbref74 http://refhub.elsevier.com/S2212-571X(16)30168-8/sbref74 http://edition.cnn.com/2014/07/16/travel/brazil-world-cup- tourism/ http://edition.cnn.com/2014/07/16/travel/brazil-world-cup- tourism/ http://refhub.elsevier.com/S2212-571X(16)30168-8/sbref75 http://refhub.elsevier.com/S2212-571X(16)30168-8/sbref75 http://refhub.elsevier.com/S2212-571X(16)30168-8/sbref75 Mazursky, D. (1989). Past experience and future tourism decisions. Annals of Tourism Research, 16(1), 333–344. Mitchell, V. (1999). Consumer perceived risk: Conceptualizations and models. European Journal of Marketing, 33(2), 163–195. Mitchell, V., & Greatorex, M. (1993). Risk perception and reduction in the purchase of consumer services. Service Industries Journal Research, 13(4), 179–200. Money, B., & Crotts, J. (2003). The effect of uncertainty avoidance on information search, planning and purchases of international travel vacations. Tourism Management, 24(1), 191–202.
- 76. Moutinho, L. (1987). Consumer behaviour in tourism. European Journal of Marketing, 21(10), 3–44. Moutinho, L., & Trimble, J. (1991). A Probability of revisitation model: The case of winter visits to the Grand Canyon. Service Industrial Journal, 11(4), 439–457. Neirotti, L., & Hilliard, T. (2006). Impact of Olympic spectator safety perception and security concerns on travel decisions. Tourism Review International, 10(4), 269–284. Niininen, O., & Riley, M. (1998). Towards the conceptualization of tourism destination loyalty. Tourism Analysis, 8(1), 243–246. Oliver, R. (1997). Satisfaction: A behavioural perspective on the consumer (2nd ed.). New York, NY: McGraw-Hill Companies, Inc. Oliver, R., & Swan, J. (1989). Consumer perceptions of interpersonal equity and satisfaction in transactions: A field survey approach. Journal of Marketing, 53(2), 21–35. Oppermann, M. (1996). Visitation of tourism attractions and tourist expenditure patterns: Repeat versus first-time visitors. Asia Pacific Journal of Tourism Research, 1(1), 61–68. Oppermann, M. (1998). Destination threshold potential and the law of repeat visitation. Journal of Travel Research, 37(2), 131–137.
- 77. Petrick, J. (2004). The roles of quality, value and satisfaction in predicting cruise passengers' behavioural intentions. Journal of Travel Research, 42(1), 397–407. Pizam, A. (1999). A comprehensive approach to classifying acts of crime and violence at tourism destinations. Journal of Travel Research, 38(3), 5–12. Pizam, A., Jeong, G., Reichel, A., Van Boemmel, H., Lusson, J., & Steynberg, L. (2004). The relationship between risk taking, sensation seeking and the tourist behavior of young adults: A cross cultural study. Journal of Travel Research, 42, 251–260. Pizam, A., & Mansfeld, Y. (Eds.). (2006). Tourism security and safety: From theory to practice. Butterworth Heinemann., New York, NY: John Wiley. Pizam, A., Tarlow, P., & Bloom, J. (1997). Making tourists feel safe: Whose responsibility is it?. Journal of Travel Research, 36(1), 23–28. Plog, S. (1974). Why destination areas rise and fall in popularity. The Cornell Hotel and Restaurant Administration Quarterly, 14(3), 55–58. Qi, C., Gibson, H., & Zhang, J. (2009). Perceptions of risk and travel intentions: The case of China and the Beijing Olympic Games. Journal of Sport & Tourism, 14(1), 43–67. Reisinger, Y., & Mavondo, F. (2006). Travel anxiety and intentions to travel
- 78. internationally: Implications of travel risk perception. Journal of Travel Research, 43(1), 212–225. Richter, L., & Waugh, W. (1986). Terrorism and tourism as logical companions. Tourism Management, 7(1), 230–238. Rittichainuwat, B., Qu, H., & Leong, J. (2003). The collective impacts of a bundle of travel determinants on repeat visitation. Journal of Hospitality and Tourism Research, 27(1), 217–236. Roehl, W., & Fesenmaier, D. (1992). Risk perception and pleasure travel: An exploratory analysis. Journal of Travel Research, 30(4), 17–26. Saad-Filho, A. (2013). Mass protests under left neoliberalism: Brazil, June–July 2013. Critical Sociology, 39, 657. Seddighi, H., Nuttall, M., & Theocharous, A. (2001). Does cultural background of tourists influence the destination choice: An empirical study with special reference to political instability. Tourism Management, 22(1), 181–191. Sheth, J., & Vankatesan, M. (1968). Risk-reduction processes in repetitive consumer behavior. Journal of Marketing Research, 5(3), 307–310. Sӧnmez, S. & Graefe, A (1998). Influence of terrorism risk on foreign tourism decisions. Annals of Tourism Research, 25(1), 112–144.
- 79. South African Tourism (2011). Highlights of tourism’s performance in 2010. Available: ⟨ http://southafruca.net/sat/action/media/downloadFile?Media_f ielod=116401⟩ . (accessed 15.07.11). Taks, M., Chalip, L., Green, B., Kesenne, S., & Martyn, S. (2009). Factors affecting repeat visitation and flow-on tourism as sources of event strategy sustainability. Journal of Sport & Tourism, 14(2–3), 121–142. Tarlow, P. (2000). Creating safe and secure communities in economically challenging times. Tourism Economics, 6(2), 139–149. Tasci, A., & Gartner, W. (2007). Destination image and its functional relationships. Journal of Travel Research, 45(4), 413–425. Taylor, T., & Toohey, K. (2007). Perceptions of terrorism threats at the 2004 Olympic games: Implications for sport events. Journal of Sport and Tourism, 12(2), 99–114. Teigen, K., Brun, W., & Slovic, P. (1988). Societal risks as seen by a Norwegian public. Journal of Behavioral Decision Making, 1(1), 111–130. Toohey, K., Taylor, T., & Lee, C. (2003). The FIFA World Cup 2002: The effects of terrorism on sport tourists. Journal of Sport Tourism, 8(3), 167– 185. Waller, S., Trendafilova, S., & Daniell, R. (2015). Did the 2012 World Series positively
- 80. impact the image of Detroit?: Sport as a transformative agent in changing images of tourism destinations. Journal of Sport & Tourism, 19(1), 79– 100. Walmsley, D., Boskovic, R., & Pigram, J. (1983). Tourism and crime: An Australian perspective. Journal of Leisure Research, 13(2), 136–155. Wang, D. (2004). Tourist behavior and repeat visitation to Hong Kong. Tourism Geographies, 6(1), 99–118. Wang, C., & Hsu, M. (2010). The relationships of destination image, satisfaction and behavioral intentions: An integrated model. Journal of Travel & Tourism Marketing, 27(1), 829–843. Watts, J. (2014). Brazil’s World Cup courts disaster as delays, protests and deaths mount [Online]. Available: ⟨ http://www.theguardian.com/world/2014/feb/16/brazil- world-cup-disaster-delays-protests-deaths⟩ (accessed 15.03.15). Woodside, A., & McDonald, R. (1994). General systems framework of customer choice processes for tourism services: Spoilt for choice: Decision making processes and preference changes of tourists. Intertemporal and Intercountry Perspectives, 30–59. Xing, X., & Chalip, L. (2006). Effects of hosting a sport event on destination brand: A test of co-branding and match-up models. Sport Management
- 81. Review, 9(1), 49–78. Yang, J., Hu, P., & Yuan, B. (2009). The impact of familiarity of perceptive behavior of tourism image: A case study of Chongqing residents' perception of Shanghai tourism image. Tourism Tribune, 24(4), 56–60. Yoon, Y., & Uysal, M. (2005). An examination of the effects of motivation and satisfaction on destination loyalty: A structural model. Tourism Management, 26(1), 45–56. Kamilla Swart is Full Professor in the Department of Tourism and Event Management in the Faculty of Business and Management Sciences at Cape Peninsula University of Technology. Her research focus is on sport tourism and events, with a particular interest in policies, strategies and evaluation. She has co-edited three special issues on mega- events and the 2010 FIFA World Cup™ and has extended her work in this area to other developing context as well. Richard George is a Principal Lecturer in Business Management at the Department of Business and Enterprise at the University of West Scotland (UWS). His research interests include safety and security issues in tourism and tourism marketing. He is the author of several academic books and journals related to this topic, in particular Marketing Tourism in South Africa 5th edition published by Oxford University Press Southern Africa.
- 82. Julia Cassar and Chesney Sneyd conducted their research on the 2014 FIFA World Cup™ as students in the Department of Strategic and Applied Management at UCT. K. Swart et al. Journal of Destination Marketing & Management xxx (xxxx) xxx–xxx 12 http://refhub.elsevier.com/S2212-571X(16)30168-8/sbref76 http://refhub.elsevier.com/S2212-571X(16)30168-8/sbref76 http://refhub.elsevier.com/S2212-571X(16)30168-8/sbref77 http://refhub.elsevier.com/S2212-571X(16)30168-8/sbref77 http://refhub.elsevier.com/S2212-571X(16)30168-8/sbref78 http://refhub.elsevier.com/S2212-571X(16)30168-8/sbref78 http://refhub.elsevier.com/S2212-571X(16)30168-8/sbref79 http://refhub.elsevier.com/S2212-571X(16)30168-8/sbref79 http://refhub.elsevier.com/S2212-571X(16)30168-8/sbref79 http://refhub.elsevier.com/S2212-571X(16)30168-8/sbref80 http://refhub.elsevier.com/S2212-571X(16)30168-8/sbref80 http://refhub.elsevier.com/S2212-571X(16)30168-8/sbref81 http://refhub.elsevier.com/S2212-571X(16)30168-8/sbref81 http://refhub.elsevier.com/S2212-571X(16)30168-8/sbref82 http://refhub.elsevier.com/S2212-571X(16)30168-8/sbref82 http://refhub.elsevier.com/S2212-571X(16)30168-8/sbref83 http://refhub.elsevier.com/S2212-571X(16)30168-8/sbref83 http://refhub.elsevier.com/S2212-571X(16)30168-8/sbref84 http://refhub.elsevier.com/S2212-571X(16)30168-8/sbref84 http://refhub.elsevier.com/S2212-571X(16)30168-8/sbref85 http://refhub.elsevier.com/S2212-571X(16)30168-8/sbref85 http://refhub.elsevier.com/S2212-571X(16)30168-8/sbref85 http://refhub.elsevier.com/S2212-571X(16)30168-8/sbref86 http://refhub.elsevier.com/S2212-571X(16)30168-8/sbref86 http://refhub.elsevier.com/S2212-571X(16)30168-8/sbref87 http://refhub.elsevier.com/S2212-571X(16)30168-8/sbref87