1. Tableau Public tutorial
Before you start:
Download Tableau Public from: http://www.tableausoftware.com/public/download-steps
Create a Tableau Public account at: https://public.tableausoftware.com/auth/signup
Download the dataset from: http://www.peteraldhous.com/Data/USDA_activity_dataset.xls
The Data:
o Open USDA_activity_dataset.xls and examine the contents.
o The data details physical activity, obesity, and other health data in nearly 100 columns,
for more than 3000 rows, one for each county in the US.
Connect to the data:
o Drag and drop USDA_activity_dataset.xls on top of the Tableau Public icon on your
desktop to open.
o At the dialog box, click OK to connect.
o Tableau automatically recognizes categorical fields, like “State,” and numerical
measures like “Adult obesity rate.”
Create the first view (a map for each state showing obesity rates at the county level):
o Double click on “State” and “County.” Tableau Public recognizes they are geographical
fields and geocodes them accordingly.
o You may get a warning message; if so, check so that you don’t see it again.
o Notice there is a point at 0 degrees latitude and longitude. These are null values. Select
them by clicking to one side of the point, keep the mouse button depressed to draw a
rectangle over it, then release. Right click on the selected null values and select Exclude.
o Right click on the Exclusions in Filter and select Make Global, so that this will apply to all
subsequent views.
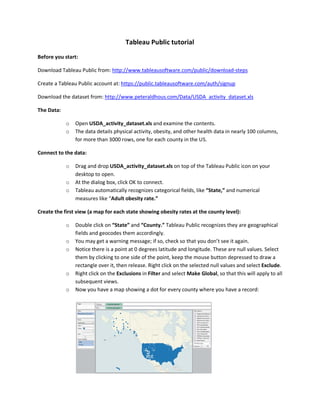
o Now you have a map showing a dot for every county where you have a record:
2. o Drag “Adult obesity rate” from the Measures panel into Color, and copy it into Size
shelf to encode counties by those values.
o Change the Color to Red–White-Green Diverging, and reverse it:
o Now add a filter to enable the selection of individual states. Click and drag “State” into
the Filters shelf, click OK at the dialog box.
o Right click on “State” in the Filters shelf and select Show Quick Filter. Deselect All and
then select Alabama.
o Rename the worksheet “Map View” by right clicking on the tab at the bottom.
o Finished state of first view:
3. Add a second view (scatter plots showing the relationship between obesity and health-related
behaviors at the county level):
o Add new worksheet:
o Drag “Adult obesity rate” onto Rows and “% smokers,” “% eating few fruits and
vegetables” and “% who do not exercise” into Columns.
o Drag “County” and “State” into Level of Detail. Without this step, Tableau’s default
behavior is to sum the values across all the counties and states, which will give you a
single data point for each graph, and not the desired scatter plots.
o The view should now look like this:
o Change Color to purple, open the Drop down menu next to “Automatic” and select
Circle, then move the slider below to the left to increase transparency of the points.
o Select Analysis in the top menu and check Trend Lines.
o Rename the worksheet “Scatterplot View” by right clicking on the tab at the bottom.
o Finished state of second view:
4. Create a Dashboard with both views:
o Add dashboard:
o Double click on each view to bring both out onto the dashboard. Right click on the State
filter, select Compact list.
o Right click on this filter again, and select Make Global. This will ensure that selecting a
state alters both views simultaneously.
o Right click on this filter for a third time, select Customize and uncheck Show “All” Value.
This prevents users from seeing the entire data for all the US.
o Right click on the titles of each view and select Hide Title.
o Rename the dashboard “Obesity by state and county” by right clicking on the tab at the
bottom.
o Double click on Title under Objects
o The dashboard should now look like this:
5. Save to the web:
o Under Size, click Edit and select the size and layout best for your website.
o Click File on the top menu and select Save to Web. You will be asked for your account login
at this point.
Embed on your website/blog:
o In the Save To Web Results window that has opened up, scroll down beneath the
visualization and click on Share.
o Copy and paste the embed code into the html of your web page.
o You should now have this online visualization:
http://www.peteraldhous.com/tableau_demo.html
o You can also download a PDF of this handout from:
http://www.peteraldhous.com/CAR/tableau_demo.pdf