Download as PDF, PPTX
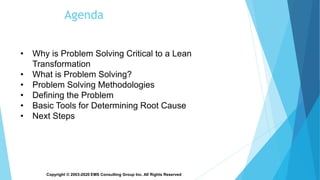
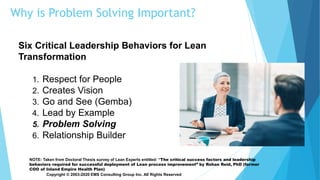
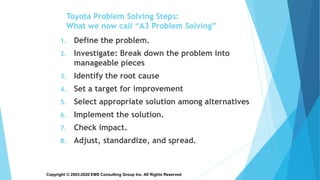
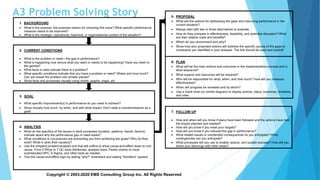
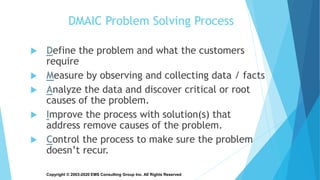
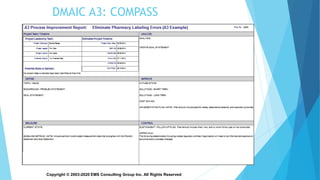
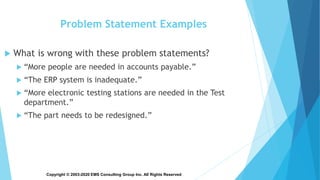
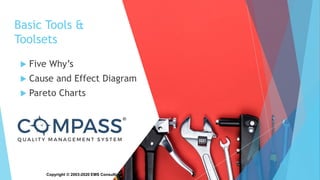

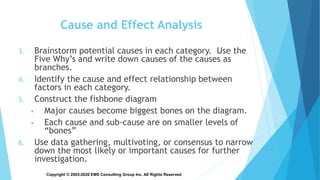
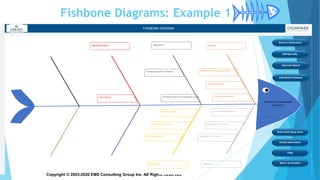
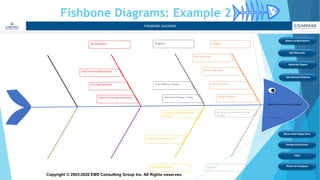
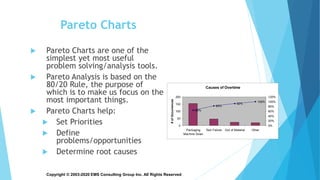
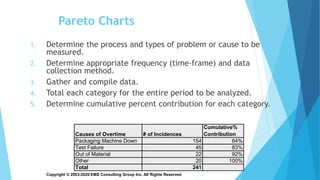


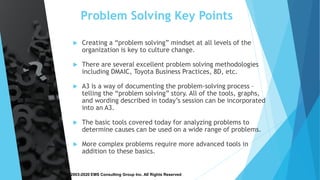

The document provides an overview of problem solving methods and tools, including the A3 problem solving process and DMAIC (Define, Measure, Analyze, Improve, Control). It emphasizes the importance of properly defining the problem through data collection, establishing a clear problem statement, and using tools like the Five Whys, fishbone diagrams, and Pareto charts to analyze the root causes. The document explains that problem solving is a critical leadership behavior for lean transformation and outlines steps for effectively using the A3 problem solving methodology to drive process improvement.