SlideShare a Scribd company logo
1 of 4
A tale of two sectors in a city on the rise
Research &
Forecast Report
HOUSTON | RETAIL
Q2 2018
Lisa Bridges Director of Market Research | Houston
Retail Trends
Commentary by Kelly Hutchinson, Senior Associate
Colliers First Quarter Retail Trends Report, stated that Houston’s
strong economy and steady population growth (2nd fastest growing
metropolitan area in the U.S.) are what have helped maintain
healthy retail occupancy and rent growth.
The Houston retail market remains relatively stable in the second
quarter, however there is a definite tale of two markets within
the retail sector. Houston saw negative absorption in the second
quarter and a statistically significant increase in overall vacancy
for the first time in several years. The continued weakness in the
“big box” retail sector, led by the bankruptcy of Toys R Us (18
closed locations in the Houston MSA), created negative absorption
in Community (two anchors), Power (three or more big boxes)
and Malls (both traditional and outlet). Smaller, neighborhood and
unanchored strip centers on the other hand had healthy positive net
absorption.
Despite this quarterly setback, Tex-X chief economist, Peter Muoio
ranks the city’s retail market the third strongest in the nation,
forecasting rents to rise and vacancy rates to fall across the metro
area by 2020 as demand will continue to outpace supply.
Houston’s projected population and job growth are brisk tailwinds
for retail real estate and are expected to fuel the expansion of
Houston’s retail real estate market for years to come even as the
industry continues to retrench nationwide.
What notable factors are behind this long term positive trend?
Primarily, Houston, the most diverse city in the U.S. and second
fastest growing, is powered by a skilled and well-trained talent
base, with an excellent quality of life and low-cost of doing
business. Forbes says Houston’s “secret sauce” is lower rents, easy
parking, no zoning, housing affordability, diversity, upbeat attitude
and openness to outsiders has made Houston a super city.
Summary Statistics
Houston Retail Market Q2 2017 Q1 2018 Q2 2018
Vacancy Rate 5.3% 5.4% 5.6%
Net Absorption (SF)
(million square feet)
1.4M 0.7M -0.6M
New Construction (SF)
(million square feet)
1.8M 0.8M 0.9M
Under Construction (SF)
(million square feet)
2.3M 2.9M 2.6M
Asking Rents
Per Square Foot Per Year
Average NNN $15.40 $15.35 $15.31
Neighborhood Centers $14.73 $14.58 $14.53
Strip Centers $18.32 $19.23 $19.51
The above asking rents are an average of all property types and classes that are currently listed with
an asking rate. This average does not include properties that are fully leased or that do not list an
asking rate. Please see page 2 of this report for an expanded discussion of retail rental rates.
Market Indicators
Relative to prior period
Annual
Change
Quarterly
Change
Quarterly
Forecast*
VACANCY
NET ABSORPTION
NEW CONSTRUCTION
UNDER CONSTRUCTION
*Projected
2 Houston Research & Forecast Report | Q2 2018 | Retail | Colliers International
Retail Trends - continued
>> POPULATION GROWTH – Ranked #2 fastest growing metro area
in the U.S.
>> JOB GROWTH – After a dip caused by the oil downturn, job
growth is back to a very healthy 60-80k jobs per year pace.
>> AFFORDABLE COST OF LIVING – 5th lowest overall cost of living
among the top 20 metros.
>> THRIVING MILLENNIAL POPULATION – Millennials make up
approximately 28% of Houston’s population vs. a national average
of 13%. Millennials disproportionately drive experiential retail and
restaurant traffic. As Millennials age, their consumption of retail
products and services are anticipated to grow.
>> IMPACT OF THE BABY BOOMERS – Houston has a relatively
smaller population of “Boomers” than most major cities, however
this group continues to drive the healthcare expansion (now a
significant retail use).
>> ETHNIC AND RACIAL DIVERSITY – Houston has the 5th largest
immigrant population among the larger metros and is the most
diverse ethnic mix in the U.S. This population diversity opens
opportunity for niche retail and cross-cultural concept growth.
The long-term curve for Houston retail remains positive. Big box retail
will continue to struggle in the near term as multi-channel retailing
continues to erode the need for these large space concepts. Big boxes
lease up in a significantly shorter time in areas with population density
and high growth. Houston has both, and couple that with a historically
proven track record of redeveloping and leasing up problems, Houston
sustains itself in face of these negative factors. Grocery expansion
following population growth and the associated small space retailers
will remain strong for the foreseeable future. For a more detailed
exploration of these topics, please check out our white paper at
https://knowledge-leader.colliers.com/kelly-hutchinson/houston-
retail-factors-to-success/.
Vacancy & Availability
Houston’s average retail vacancy rate increased 20 basis points
between quarters from 5.4% in Q1 2018 to 5.6% and increased 30
basis points annually from 5.3% in Q2 2017. At the end of the second
quarter, Houston had 15.8M SF of vacant retail space on the market.
Among the major property types, single-tenant retail had the lowest
vacancy rate of 2.0%, lifestyle centers at 2.4%, followed by theme/
entertainment at 2.8% and community centers at 5.0%. Outlet malls
saw the largest increase over the quarter from 2.6 to 12.5% and malls
vacancy rate increased from 4.6% to 5.5%. Neighborhood centers
have the largest amount of vacant space by square feet and are 8.8%
vacant.
There is currently 2.6M SF of retail space under construction of which
69% is pre-leased. The majority of the projects under construction
are located in the outlying suburban submarkets adjacent to rapidly
growing residential developments. The largest project under
construction is the 240,000-SF Metropark Square located north of
Houston in the City of Shenandoah, Montgomery Co, TX. AMC and
Dave and Busters are among the tenants in the new development.
Sales Activity
Source: Real Capital Analytics
Q2 2018
NO. OF PROPERTIES: 50
TOTAL SF: 1.7M
AVERAGE $/SF: $264
AVERAGE CAP RATE: 7.1%
Job Growth & Unemployment
(not seasonally adjusted)
UNEMPLOYMENT 5/17 5/18
HOUSTON 4.8% 4.2%
TEXAS 4.1% 3.7%
U.S. 4.1% 3.6%
JOB GROWTH
Annual
Change
# of Jobs
Added
HOUSTON 2.6% 79.2K
TEXAS 2.8% 344.7K
U.S. 1.6% 2.4M
Change in Sales (Year over Year)
-80.0%
-60.0%
-40.0%
-20.0%
0.0%
20.0%
40.0%
60.0%
80.0%
100.0%
120.0%
Q2 '14 Q2 '15 Q2 '16 Q2 '17 Q2 '18
Average Price Per SF
0
50
100
150
200
250
300
Q2 '14 Q2 '15 Q2 '16 Q2 '17 Q2 '18
Houston U.S.
Average CAP Rate
4.0%
5.0%
6.0%
7.0%
8.0%
9.0%
10.0%
Q2 '14 Q2 '15 Q2 '16 Q2 '17 Q2 '18
Houston U.S.
3 Houston Research & Forecast Report | Q2 2018 | Retail | Colliers International33
Absorption & Demand
Houston’s retail market posted 556,245 SF of negative net absorption in the second quarter, a significant decrease from the 680,964 SF
of positive net absorption posted in the previous quarter. Some of the negative absorption can be attributed to the closing of “Big Box”
stores located in Community Centers, Power Centers and Malls. Houston area Toys R Us stores closed all locations during the second
quarter. The other source of negative absorption was from single tenant or free-standing retail such as branch banks, many closing
branches closing due to a continued shift by consumers to on-line banking. Among the tenants that expanded into new locations during the
second quarter are Kroger, HEB, Marshalls and Pluckers Wing Bar. These expansions are an indication that grocery stores, restaurants and
discount retailers still pull in a healthy amount of foot traffic.
Rental Rates
According to CoStar, our data provider, Houston’s citywide average quoted retail rental rate for all property types decreased slightly
between quarters from $15.35 per SF NNN in Q1 2018 to $15.31 per SF NNN. These average rental rates are typically much lower than
actual deal rates since they include all retail property types and classes, the majority of those properties are not well leased and are listed
with discounted asking rates. According to Colliers’ internal data, Class A in-line retail rental rates can vary widely from $30.00 to $85.00
per SF, depending on location and property type.
Market Summary
Q2 2018 Select Retail Lease Transactions
BUILDING NAME/ADDRESS SUBMARKET SF TENANT LEASE DATE
Deer Park Triangle NASA/Clear Lake 53,300 Joe V’s Smart Shop Apr-18
Four Corners Shopping Center Far South 12,500 Family Dollar Store Apr-18
Pinecroft Center I Montgomery County 12,000 Bassett Furniture Apr-18
Pearland Town Center Far South 7,000 Altar’d Interiors Jun-18
11 Gemini St NASA/Clear Lake 7,000 Nasa Kids Academy Apr-18
23692 Highway 59 N Montgomery County 6,800 The Draft Apr-18
Price Plaza Far Katy North 6,700 Mambo Seafood Jun-18
Pearland Town Center Far South 5,600 Victoria’s Secret/Pink Jun-18
Q2 2018 Retail Market Statistical Summary
PROPERTY TYPE
RENTABLE
AREA
DIRECT
VACANT SF
DIRECT
VACANCY
RATE
SUBLET
VACANT
SF
SUBLET
VACANCY
RATE
TOTAL
VACANT SF
TOTAL
VACANCY
RATE
2Q18 NET
ABSORPTION
CLASS A RENTAL
RATES (IN-LINE*)
Strip Centers (unanchored) 35,834,161 2,895,662 8.1% 10,804 0.0% 2,906,466 8.1% 161,282 $27.00-$45.00
Neighborhood Centers (one anchor) 71,381,645 6,267,332 8.8% 76,390 0.1% 6,343,722 8.9% 268,202 $28.00-$46.00
Community Centers (two anchors) 47,614,673 2,317,313 4.9% 76,160 0.2% 2,393,473 5.0% (198,680) $28.00-$45.00
Power Centers (three or > anchors) 28,392,341 1,454,508 5.1% 11,625 0.0% 1,466,133 5.2% (331,271) $28.00-$45.00
Lifestyle Centers 6,052,121 145,457 2.4% - 0.0% 145,457 2.4% 67,473 $40.00-$85.00
Outlet Centers 1,330,725 165,860 12.5% - 0.0% 165,860 12.5% (131,624) $20.00-$40.00
Theme/Entertainment 499,468 13,859 2.8% - 0.0% 13,859 2.8% 3,879 $25.00-$35.00
Single-Tenant 72,744,169 1,306,412 1.8% 116,705 0.2% 1,423,117 2.0% (187,071) N/A
Malls 23,599,518 1,280,409 5.4% 12,397 0.1% 1,292,806 5.5% (203,456) N/A
GREATER HOUSTON 287,448,821 15,846,812 5.5% 304,081 0.1% 16,150,893 5.6% (551,266)
4 North American Research & Forecast Report | Q4 2014 | Office Market Outlook | Colliers International
Copyright © 2015 Colliers International.
The information contained herein has been obtained from sources deemed reliable. While
every reasonable effort has been made to ensure its accuracy, we cannot guarantee it. No
responsibility is assumed for any inaccuracies. Readers are encouraged to consult their
professional advisors prior to acting on any of the material contained in this report.
Colliers International | Market
000 Address, Suite #
+1 000 000 0000
colliers.com/<<market>>
4 North American Research & Forecast Report | Q4 2014 | Office Market Outlook | Colliers International
Copyright © 2018 Colliers International.
The information contained herein has been obtained from sources deemed reliable. While
every reasonable effort has been made to ensure its accuracy, we cannot guarantee it. No
responsibility is assumed for any inaccuracies. Readers are encouraged to consult their
professional advisors prior to acting on any of the material contained in this report.
Colliers International | Houston
1233 West Loop South, Suite 900
Houston, Texas 77027
+1 713 222 2111
colliers.com/houston
FOR MORE INFORMATION
Lisa Bridges
Director of Market Research | Houston
+1 713 830 2125
lisa.bridges@colliers.com
115.6M SF
15.3M SF
Q2 2018 Houston Retail Highlights
Kelly Hutchinson
Senior Associate | Houston
+1 713 830 2146
kelly.hutchinson@colliers.com

More Related Content

What's hot

Westside Future Fund Retail Market Analysis June 2016
Westside Future Fund Retail Market Analysis June 2016Westside Future Fund Retail Market Analysis June 2016
Westside Future Fund Retail Market Analysis June 2016JBHackk
 
Investment Outlook for Commercial Real Estate June 2015
Investment Outlook for Commercial Real Estate June 2015Investment Outlook for Commercial Real Estate June 2015
Investment Outlook for Commercial Real Estate June 2015Lewei He
 
Karen Hanover - Commercial Real Estate - IRR
Karen Hanover - Commercial Real Estate - IRRKaren Hanover - Commercial Real Estate - IRR
Karen Hanover - Commercial Real Estate - IRRKaren Wagner
 
May Phoenix East Valley Real Estate Market Report
May Phoenix East Valley Real Estate Market ReportMay Phoenix East Valley Real Estate Market Report
May Phoenix East Valley Real Estate Market ReportLen Nevin
 
Northeast Ohio Home Sellers Guide
Northeast Ohio Home Sellers GuideNortheast Ohio Home Sellers Guide
Northeast Ohio Home Sellers GuideLisa Humenik
 
Beverly-Hanks 2016_q1_market_report
Beverly-Hanks 2016_q1_market_reportBeverly-Hanks 2016_q1_market_report
Beverly-Hanks 2016_q1_market_reportWes Morgan
 
Jul 16 Trends Monitor
Jul 16 Trends MonitorJul 16 Trends Monitor
Jul 16 Trends MonitorMspark
 
US Access to China's Consumer Markets
US Access to China's Consumer MarketsUS Access to China's Consumer Markets
US Access to China's Consumer MarketsDr Dev Kambhampati
 
US Access to China's Consumer Market
US Access to China's Consumer MarketUS Access to China's Consumer Market
US Access to China's Consumer MarketDr Dev Kambhampati
 
ProsperChina™ Q1 2011 Quarterly Report of 19,000+ Chinese Consumers
ProsperChina™ Q1 2011 Quarterly Report of 19,000+ Chinese ConsumersProsperChina™ Q1 2011 Quarterly Report of 19,000+ Chinese Consumers
ProsperChina™ Q1 2011 Quarterly Report of 19,000+ Chinese ConsumersProsper Business Development
 
C&W MARKETBEAT- RETAIL Q4 2016 – #CRE #REALESTATE #CCIM #SIOR @YOURTENANTREP
C&W MARKETBEAT- RETAIL Q4 2016 – #CRE #REALESTATE #CCIM #SIOR @YOURTENANTREPC&W MARKETBEAT- RETAIL Q4 2016 – #CRE #REALESTATE #CCIM #SIOR @YOURTENANTREP
C&W MARKETBEAT- RETAIL Q4 2016 – #CRE #REALESTATE #CCIM #SIOR @YOURTENANTREPGuy Masse
 
An Analysis of Residential Market Potential for Westside Atlanta
An Analysis of Residential Market Potential for Westside AtlantaAn Analysis of Residential Market Potential for Westside Atlanta
An Analysis of Residential Market Potential for Westside AtlantaJBHackk
 
TRREB MARKET WATCH - JANUARY 2020
TRREB MARKET WATCH - JANUARY 2020TRREB MARKET WATCH - JANUARY 2020
TRREB MARKET WATCH - JANUARY 2020Shawn Venasse
 
Canada Retail sales continue to expand in March 2017
Canada Retail sales continue to expand in March 2017Canada Retail sales continue to expand in March 2017
Canada Retail sales continue to expand in March 2017paul young cpa, cga
 
China GDP exceeds expectaton for February 2017
China GDP exceeds expectaton for February 2017 China GDP exceeds expectaton for February 2017
China GDP exceeds expectaton for February 2017 paul young cpa, cga
 

What's hot (20)

Westside Future Fund Retail Market Analysis June 2016
Westside Future Fund Retail Market Analysis June 2016Westside Future Fund Retail Market Analysis June 2016
Westside Future Fund Retail Market Analysis June 2016
 
Investment Outlook for Commercial Real Estate June 2015
Investment Outlook for Commercial Real Estate June 2015Investment Outlook for Commercial Real Estate June 2015
Investment Outlook for Commercial Real Estate June 2015
 
Karen Hanover - Commercial Real Estate - IRR
Karen Hanover - Commercial Real Estate - IRRKaren Hanover - Commercial Real Estate - IRR
Karen Hanover - Commercial Real Estate - IRR
 
May Phoenix East Valley Real Estate Market Report
May Phoenix East Valley Real Estate Market ReportMay Phoenix East Valley Real Estate Market Report
May Phoenix East Valley Real Estate Market Report
 
Northeast Ohio Home Sellers Guide
Northeast Ohio Home Sellers GuideNortheast Ohio Home Sellers Guide
Northeast Ohio Home Sellers Guide
 
Beverly-Hanks 2016_q1_market_report
Beverly-Hanks 2016_q1_market_reportBeverly-Hanks 2016_q1_market_report
Beverly-Hanks 2016_q1_market_report
 
Jul 16 Trends Monitor
Jul 16 Trends MonitorJul 16 Trends Monitor
Jul 16 Trends Monitor
 
Q1 2020 | Houston Retail | Research & Forecast Report
Q1 2020 | Houston Retail | Research & Forecast ReportQ1 2020 | Houston Retail | Research & Forecast Report
Q1 2020 | Houston Retail | Research & Forecast Report
 
US Access to China's Consumer Markets
US Access to China's Consumer MarketsUS Access to China's Consumer Markets
US Access to China's Consumer Markets
 
Q3 2014 Houston Retail Market Research & Forecast Report
Q3 2014 Houston Retail Market Research & Forecast ReportQ3 2014 Houston Retail Market Research & Forecast Report
Q3 2014 Houston Retail Market Research & Forecast Report
 
US Access to China's Consumer Market
US Access to China's Consumer MarketUS Access to China's Consumer Market
US Access to China's Consumer Market
 
ProsperChina™ Q1 2011 Quarterly Report of 19,000+ Chinese Consumers
ProsperChina™ Q1 2011 Quarterly Report of 19,000+ Chinese ConsumersProsperChina™ Q1 2011 Quarterly Report of 19,000+ Chinese Consumers
ProsperChina™ Q1 2011 Quarterly Report of 19,000+ Chinese Consumers
 
C&W MARKETBEAT- RETAIL Q4 2016 – #CRE #REALESTATE #CCIM #SIOR @YOURTENANTREP
C&W MARKETBEAT- RETAIL Q4 2016 – #CRE #REALESTATE #CCIM #SIOR @YOURTENANTREPC&W MARKETBEAT- RETAIL Q4 2016 – #CRE #REALESTATE #CCIM #SIOR @YOURTENANTREP
C&W MARKETBEAT- RETAIL Q4 2016 – #CRE #REALESTATE #CCIM #SIOR @YOURTENANTREP
 
An Analysis of Residential Market Potential for Westside Atlanta
An Analysis of Residential Market Potential for Westside AtlantaAn Analysis of Residential Market Potential for Westside Atlanta
An Analysis of Residential Market Potential for Westside Atlanta
 
TRREB MARKET WATCH - JANUARY 2020
TRREB MARKET WATCH - JANUARY 2020TRREB MARKET WATCH - JANUARY 2020
TRREB MARKET WATCH - JANUARY 2020
 
Presidential_Elections
Presidential_ElectionsPresidential_Elections
Presidential_Elections
 
Canada Retail sales continue to expand in March 2017
Canada Retail sales continue to expand in March 2017Canada Retail sales continue to expand in March 2017
Canada Retail sales continue to expand in March 2017
 
Holiday Retail Report
Holiday Retail Report Holiday Retail Report
Holiday Retail Report
 
China GDP exceeds expectaton for February 2017
China GDP exceeds expectaton for February 2017 China GDP exceeds expectaton for February 2017
China GDP exceeds expectaton for February 2017
 
Q2 2016 Houston Retail Market Research Report
Q2 2016 Houston Retail Market Research ReportQ2 2016 Houston Retail Market Research Report
Q2 2016 Houston Retail Market Research Report
 

Similar to Q2 2018 | Houston Retail | Research & Forecast Report

Houston Market Retail Report (2Q15)
Houston Market Retail Report (2Q15)Houston Market Retail Report (2Q15)
Houston Market Retail Report (2Q15)Monik Hernandez
 
BoyarMiller Breakfast Forum: The Houston Commercial Real Estate Markets – Wha...
BoyarMiller Breakfast Forum: The Houston Commercial Real Estate Markets – Wha...BoyarMiller Breakfast Forum: The Houston Commercial Real Estate Markets – Wha...
BoyarMiller Breakfast Forum: The Houston Commercial Real Estate Markets – Wha...BoyarMiller
 
2019 top us-markets-for-large-multifamily-investment-report
2019 top us-markets-for-large-multifamily-investment-report2019 top us-markets-for-large-multifamily-investment-report
2019 top us-markets-for-large-multifamily-investment-reportLane Kawaoka, PE
 
C&W-Marketbeat-U.S.Shopping Center-Q3-2018 #CRE #REALESTATE #RETAIL
C&W-Marketbeat-U.S.Shopping Center-Q3-2018 #CRE #REALESTATE #RETAILC&W-Marketbeat-U.S.Shopping Center-Q3-2018 #CRE #REALESTATE #RETAIL
C&W-Marketbeat-U.S.Shopping Center-Q3-2018 #CRE #REALESTATE #RETAILGuy Masse
 
BoyarMiller Breakfast Forum: The Houston Commercial Real Estate Markets - Wha...
BoyarMiller Breakfast Forum: The Houston Commercial Real Estate Markets - Wha...BoyarMiller Breakfast Forum: The Houston Commercial Real Estate Markets - Wha...
BoyarMiller Breakfast Forum: The Houston Commercial Real Estate Markets - Wha...BoyarMiller
 
BoyarMiller Real Estate eBook August 2013 State of the Industry
BoyarMiller Real Estate eBook August 2013 State of the IndustryBoyarMiller Real Estate eBook August 2013 State of the Industry
BoyarMiller Real Estate eBook August 2013 State of the IndustryBoyarMiller
 
Houston Economy at a Glance November 2013
Houston Economy at a Glance November 2013Houston Economy at a Glance November 2013
Houston Economy at a Glance November 2013Coy Davidson
 
BoyarMiller Breakfast Forum: The Houston Commercial Real Estate Markets – Wha...
BoyarMiller Breakfast Forum: The Houston Commercial Real Estate Markets – Wha...BoyarMiller Breakfast Forum: The Houston Commercial Real Estate Markets – Wha...
BoyarMiller Breakfast Forum: The Houston Commercial Real Estate Markets – Wha...BoyarMiller
 
Life Settlement Industry Report - Magna Life Settlements
Life Settlement Industry Report - Magna Life SettlementsLife Settlement Industry Report - Magna Life Settlements
Life Settlement Industry Report - Magna Life SettlementsMagna Life Settlements
 
HCAD News Release 2017
HCAD News Release 2017HCAD News Release 2017
HCAD News Release 2017cutmytaxes
 
BoyarMiller Breakfast Forum: The Houston Commercial Real Estate Markets – Wha...
BoyarMiller Breakfast Forum: The Houston Commercial Real Estate Markets – Wha...BoyarMiller Breakfast Forum: The Houston Commercial Real Estate Markets – Wha...
BoyarMiller Breakfast Forum: The Houston Commercial Real Estate Markets – Wha...BoyarMiller
 
Mercer Capital's Value Focus: Real Estate Industry | Q1 2018 | Segment Focus:...
Mercer Capital's Value Focus: Real Estate Industry | Q1 2018 | Segment Focus:...Mercer Capital's Value Focus: Real Estate Industry | Q1 2018 | Segment Focus:...
Mercer Capital's Value Focus: Real Estate Industry | Q1 2018 | Segment Focus:...Mercer Capital
 
Luxury Market Report 2020
Luxury Market Report 2020Luxury Market Report 2020
Luxury Market Report 2020FRANKLIN KNOTTS
 
Feb 2014 San Francisco article
Feb 2014 San Francisco articleFeb 2014 San Francisco article
Feb 2014 San Francisco articleKamil Homsi
 
Cycle monitor-18 q3
Cycle monitor-18 q3Cycle monitor-18 q3
Cycle monitor-18 q3Clayton Jew
 

Similar to Q2 2018 | Houston Retail | Research & Forecast Report (20)

Houston Market Retail Report (2Q15)
Houston Market Retail Report (2Q15)Houston Market Retail Report (2Q15)
Houston Market Retail Report (2Q15)
 
BoyarMiller Breakfast Forum: The Houston Commercial Real Estate Markets – Wha...
BoyarMiller Breakfast Forum: The Houston Commercial Real Estate Markets – Wha...BoyarMiller Breakfast Forum: The Houston Commercial Real Estate Markets – Wha...
BoyarMiller Breakfast Forum: The Houston Commercial Real Estate Markets – Wha...
 
Q4 2019 | Houston Industrial | Research & Forecast Report
Q4 2019 | Houston Industrial  | Research & Forecast ReportQ4 2019 | Houston Industrial  | Research & Forecast Report
Q4 2019 | Houston Industrial | Research & Forecast Report
 
2019 top us-markets-for-large-multifamily-investment-report
2019 top us-markets-for-large-multifamily-investment-report2019 top us-markets-for-large-multifamily-investment-report
2019 top us-markets-for-large-multifamily-investment-report
 
C&W-Marketbeat-U.S.Shopping Center-Q3-2018 #CRE #REALESTATE #RETAIL
C&W-Marketbeat-U.S.Shopping Center-Q3-2018 #CRE #REALESTATE #RETAILC&W-Marketbeat-U.S.Shopping Center-Q3-2018 #CRE #REALESTATE #RETAIL
C&W-Marketbeat-U.S.Shopping Center-Q3-2018 #CRE #REALESTATE #RETAIL
 
Q3 2017 | Houston Retail | Research & Forecast Report
Q3 2017 | Houston Retail | Research & Forecast ReportQ3 2017 | Houston Retail | Research & Forecast Report
Q3 2017 | Houston Retail | Research & Forecast Report
 
BoyarMiller Breakfast Forum: The Houston Commercial Real Estate Markets - Wha...
BoyarMiller Breakfast Forum: The Houston Commercial Real Estate Markets - Wha...BoyarMiller Breakfast Forum: The Houston Commercial Real Estate Markets - Wha...
BoyarMiller Breakfast Forum: The Houston Commercial Real Estate Markets - Wha...
 
BoyarMiller Real Estate eBook August 2013 State of the Industry
BoyarMiller Real Estate eBook August 2013 State of the IndustryBoyarMiller Real Estate eBook August 2013 State of the Industry
BoyarMiller Real Estate eBook August 2013 State of the Industry
 
Houston Economy at a Glance November 2013
Houston Economy at a Glance November 2013Houston Economy at a Glance November 2013
Houston Economy at a Glance November 2013
 
BoyarMiller Breakfast Forum: The Houston Commercial Real Estate Markets – Wha...
BoyarMiller Breakfast Forum: The Houston Commercial Real Estate Markets – Wha...BoyarMiller Breakfast Forum: The Houston Commercial Real Estate Markets – Wha...
BoyarMiller Breakfast Forum: The Houston Commercial Real Estate Markets – Wha...
 
Life Settlement Industry Report - Magna Life Settlements
Life Settlement Industry Report - Magna Life SettlementsLife Settlement Industry Report - Magna Life Settlements
Life Settlement Industry Report - Magna Life Settlements
 
HCAD News Release 2017
HCAD News Release 2017HCAD News Release 2017
HCAD News Release 2017
 
BoyarMiller Breakfast Forum: The Houston Commercial Real Estate Markets – Wha...
BoyarMiller Breakfast Forum: The Houston Commercial Real Estate Markets – Wha...BoyarMiller Breakfast Forum: The Houston Commercial Real Estate Markets – Wha...
BoyarMiller Breakfast Forum: The Houston Commercial Real Estate Markets – Wha...
 
HAR Chair Margie Dorrance Speaks to the Houston Jaycees
HAR Chair Margie Dorrance Speaks to the Houston JayceesHAR Chair Margie Dorrance Speaks to the Houston Jaycees
HAR Chair Margie Dorrance Speaks to the Houston Jaycees
 
Mercer Capital's Value Focus: Real Estate Industry | Q1 2018 | Segment Focus:...
Mercer Capital's Value Focus: Real Estate Industry | Q1 2018 | Segment Focus:...Mercer Capital's Value Focus: Real Estate Industry | Q1 2018 | Segment Focus:...
Mercer Capital's Value Focus: Real Estate Industry | Q1 2018 | Segment Focus:...
 
Q4 2016 Houston Retail Research & Forecast Report
Q4 2016 Houston Retail Research & Forecast ReportQ4 2016 Houston Retail Research & Forecast Report
Q4 2016 Houston Retail Research & Forecast Report
 
Luxury Market Report 2020
Luxury Market Report 2020Luxury Market Report 2020
Luxury Market Report 2020
 
Feb 2014 San Francisco article
Feb 2014 San Francisco articleFeb 2014 San Francisco article
Feb 2014 San Francisco article
 
National 1Q15
National 1Q15National 1Q15
National 1Q15
 
Cycle monitor-18 q3
Cycle monitor-18 q3Cycle monitor-18 q3
Cycle monitor-18 q3
 

More from Colliers International | Houston

Q1 2021 | Austin Industrial | Research & Forecast Commericial Real Estate Report
Q1 2021 | Austin Industrial | Research & Forecast Commericial Real Estate ReportQ1 2021 | Austin Industrial | Research & Forecast Commericial Real Estate Report
Q1 2021 | Austin Industrial | Research & Forecast Commericial Real Estate ReportColliers International | Houston
 

More from Colliers International | Houston (20)

Q1 2022 Austin Industrial Report
Q1 2022 Austin Industrial ReportQ1 2022 Austin Industrial Report
Q1 2022 Austin Industrial Report
 
Q1 2022 Austin Office Market Report
Q1 2022 Austin Office Market ReportQ1 2022 Austin Office Market Report
Q1 2022 Austin Office Market Report
 
2021 Q3 Office Austin Report
2021 Q3 Office Austin Report2021 Q3 Office Austin Report
2021 Q3 Office Austin Report
 
Q2 2021 Austin Industrial Report
Q2 2021 Austin Industrial ReportQ2 2021 Austin Industrial Report
Q2 2021 Austin Industrial Report
 
Q2 2021 Austin Office Report
Q2 2021 Austin Office ReportQ2 2021 Austin Office Report
Q2 2021 Austin Office Report
 
Q1 2021 | Austin Industrial | Research & Forecast Commericial Real Estate Report
Q1 2021 | Austin Industrial | Research & Forecast Commericial Real Estate ReportQ1 2021 | Austin Industrial | Research & Forecast Commericial Real Estate Report
Q1 2021 | Austin Industrial | Research & Forecast Commericial Real Estate Report
 
Q1 2021 Austin Office Report
Q1 2021 Austin Office ReportQ1 2021 Austin Office Report
Q1 2021 Austin Office Report
 
Colliers Q4 2020 Austin Industrial Report
Colliers Q4 2020 Austin Industrial ReportColliers Q4 2020 Austin Industrial Report
Colliers Q4 2020 Austin Industrial Report
 
Q4 2020 Austin Office Report
Q4 2020 Austin Office ReportQ4 2020 Austin Office Report
Q4 2020 Austin Office Report
 
Q4 2020 | Houston Office | Research & Forecast Report
Q4 2020 | Houston Office | Research & Forecast ReportQ4 2020 | Houston Office | Research & Forecast Report
Q4 2020 | Houston Office | Research & Forecast Report
 
Q3 2020 | Austin Industrial | Research & Forecast Report
Q3 2020 | Austin Industrial | Research & Forecast ReportQ3 2020 | Austin Industrial | Research & Forecast Report
Q3 2020 | Austin Industrial | Research & Forecast Report
 
Q3 2020 | The Woodlands Office | Research Snapshot
Q3 2020 | The Woodlands Office | Research SnapshotQ3 2020 | The Woodlands Office | Research Snapshot
Q3 2020 | The Woodlands Office | Research Snapshot
 
Q3 2020 | Fort Bend | Submarket Snapshot
Q3 2020 | Fort Bend | Submarket SnapshotQ3 2020 | Fort Bend | Submarket Snapshot
Q3 2020 | Fort Bend | Submarket Snapshot
 
Q3 2020 | Austin Office | Research & Forecast Report
Q3 2020 | Austin Office | Research & Forecast ReportQ3 2020 | Austin Office | Research & Forecast Report
Q3 2020 | Austin Office | Research & Forecast Report
 
Q3 2020 | Houston Office | Research & Forecast Report
Q3 2020 | Houston Office | Research & Forecast ReportQ3 2020 | Houston Office | Research & Forecast Report
Q3 2020 | Houston Office | Research & Forecast Report
 
Q2 2020 | The Woodlands Office | Research Snapshot
Q2 2020 | The Woodlands Office | Research SnapshotQ2 2020 | The Woodlands Office | Research Snapshot
Q2 2020 | The Woodlands Office | Research Snapshot
 
Q2 2020 | E Fort Bend Commercial Real Estate Trends
Q2 2020 | E Fort Bend Commercial Real Estate TrendsQ2 2020 | E Fort Bend Commercial Real Estate Trends
Q2 2020 | E Fort Bend Commercial Real Estate Trends
 
Mid-Year 2020 | Houston Healthcare | Market Report
Mid-Year 2020 | Houston Healthcare | Market ReportMid-Year 2020 | Houston Healthcare | Market Report
Mid-Year 2020 | Houston Healthcare | Market Report
 
Q2 2020 | Austin Office | Research & Forecast Report
Q2 2020 | Austin Office | Research & Forecast ReportQ2 2020 | Austin Office | Research & Forecast Report
Q2 2020 | Austin Office | Research & Forecast Report
 
Q1 2020 | Austin Industrial | Research & Forecast Report
Q1 2020 | Austin Industrial | Research & Forecast ReportQ1 2020 | Austin Industrial | Research & Forecast Report
Q1 2020 | Austin Industrial | Research & Forecast Report
 

Recently uploaded

Call Girls in Khan Market 9654467111 ESCORTS SERVICE
Call Girls in Khan Market 9654467111 ESCORTS SERVICECall Girls in Khan Market 9654467111 ESCORTS SERVICE
Call Girls in Khan Market 9654467111 ESCORTS SERVICESapana Sha
 
Puravankara Mundhwa Pune E-Brochure.pdf
Puravankara Mundhwa Pune  E-Brochure.pdfPuravankara Mundhwa Pune  E-Brochure.pdf
Puravankara Mundhwa Pune E-Brochure.pdfManishSaxena95
 
SSPL The Strand Abodes Kharadi Pune Brochure.pdf
SSPL The Strand Abodes Kharadi Pune Brochure.pdfSSPL The Strand Abodes Kharadi Pune Brochure.pdf
SSPL The Strand Abodes Kharadi Pune Brochure.pdfabbu831446
 
9990771857 Call Girls in Noida Sector 11 Noida (Call Girls) Delhi
9990771857 Call Girls in Noida Sector 11 Noida (Call Girls) Delhi9990771857 Call Girls in Noida Sector 11 Noida (Call Girls) Delhi
9990771857 Call Girls in Noida Sector 11 Noida (Call Girls) Delhidelhimodel235
 
Nanke Area Estate commercial ( Dir. Kat Kuo)
Nanke Area Estate commercial ( Dir. Kat Kuo)Nanke Area Estate commercial ( Dir. Kat Kuo)
Nanke Area Estate commercial ( Dir. Kat Kuo)jessica288382
 
SVN Live 4.22.24 Weekly Property Broadcast
SVN Live 4.22.24 Weekly Property BroadcastSVN Live 4.22.24 Weekly Property Broadcast
SVN Live 4.22.24 Weekly Property BroadcastSVN International Corp.
 
The Omaxe State Dwarka Delhi-broucher.pdf.pdf
The Omaxe State Dwarka Delhi-broucher.pdf.pdfThe Omaxe State Dwarka Delhi-broucher.pdf.pdf
The Omaxe State Dwarka Delhi-broucher.pdf.pdfkratirudram
 
Namrata 7 Plumeria Drive Pimpri Chinchwad Pune Brochure.pdf
Namrata 7 Plumeria Drive Pimpri Chinchwad Pune Brochure.pdfNamrata 7 Plumeria Drive Pimpri Chinchwad Pune Brochure.pdf
Namrata 7 Plumeria Drive Pimpri Chinchwad Pune Brochure.pdfPrachiRudram
 
Call Girls in Inderpuri Delhi 💯Call Us 🔝8264348440🔝
Call Girls in Inderpuri Delhi 💯Call Us 🔝8264348440🔝Call Girls in Inderpuri Delhi 💯Call Us 🔝8264348440🔝
Call Girls in Inderpuri Delhi 💯Call Us 🔝8264348440🔝soniya singh
 
9990771857 Call Girls in Noida Sector 10 Noida (Call Girls) Delhi
9990771857 Call Girls in Noida Sector 10 Noida (Call Girls) Delhi9990771857 Call Girls in Noida Sector 10 Noida (Call Girls) Delhi
9990771857 Call Girls in Noida Sector 10 Noida (Call Girls) Delhidelhimodel235
 
8 Key Elements for Comfortable Farmland Living
8 Key Elements for Comfortable Farmland Living 8 Key Elements for Comfortable Farmland Living
8 Key Elements for Comfortable Farmland Living Farmland Bazaar
 
9990771857 Call Girls in Noida Sector 06 Noida (Call Girls) Delhi
9990771857 Call Girls in Noida Sector 06 Noida (Call Girls) Delhi9990771857 Call Girls in Noida Sector 06 Noida (Call Girls) Delhi
9990771857 Call Girls in Noida Sector 06 Noida (Call Girls) Delhidelhimodel235
 
Listing Turkey Sylvana Istanbul - Bahcesehir
Listing Turkey Sylvana Istanbul - BahcesehirListing Turkey Sylvana Istanbul - Bahcesehir
Listing Turkey Sylvana Istanbul - BahcesehirListing Turkey
 
call girls in Shahdara (DELHI) 🔝 >༒9953330565🔝 genuine Escort Service 🔝✔️✔️
call girls in Shahdara (DELHI) 🔝 >༒9953330565🔝 genuine Escort Service 🔝✔️✔️call girls in Shahdara (DELHI) 🔝 >༒9953330565🔝 genuine Escort Service 🔝✔️✔️
call girls in Shahdara (DELHI) 🔝 >༒9953330565🔝 genuine Escort Service 🔝✔️✔️9953056974 Low Rate Call Girls In Saket, Delhi NCR
 
Sobha Aranya Sector 80 Gurgaon E- Brochure.pdf
Sobha Aranya Sector 80 Gurgaon E- Brochure.pdfSobha Aranya Sector 80 Gurgaon E- Brochure.pdf
Sobha Aranya Sector 80 Gurgaon E- Brochure.pdffaheemali990101
 
Call Girls In Mayur Vihar-1 Delhi ❤️8860477959 Good Looking Escorts In 24/7 D...
Call Girls In Mayur Vihar-1 Delhi ❤️8860477959 Good Looking Escorts In 24/7 D...Call Girls In Mayur Vihar-1 Delhi ❤️8860477959 Good Looking Escorts In 24/7 D...
Call Girls In Mayur Vihar-1 Delhi ❤️8860477959 Good Looking Escorts In 24/7 D...lizamodels9
 
Call Girls in Nehru Place Delhi 💯Call Us 🔝8264348440🔝
Call Girls in Nehru Place Delhi 💯Call Us 🔝8264348440🔝Call Girls in Nehru Place Delhi 💯Call Us 🔝8264348440🔝
Call Girls in Nehru Place Delhi 💯Call Us 🔝8264348440🔝soniya singh
 
Call Girls In Vasundhara Ghaziabad ❤️8860477959 Low Rate Escorts Service In 2...
Call Girls In Vasundhara Ghaziabad ❤️8860477959 Low Rate Escorts Service In 2...Call Girls In Vasundhara Ghaziabad ❤️8860477959 Low Rate Escorts Service In 2...
Call Girls In Vasundhara Ghaziabad ❤️8860477959 Low Rate Escorts Service In 2...lizamodels9
 

Recently uploaded (20)

Call Girls in Khan Market 9654467111 ESCORTS SERVICE
Call Girls in Khan Market 9654467111 ESCORTS SERVICECall Girls in Khan Market 9654467111 ESCORTS SERVICE
Call Girls in Khan Market 9654467111 ESCORTS SERVICE
 
Puravankara Mundhwa Pune E-Brochure.pdf
Puravankara Mundhwa Pune  E-Brochure.pdfPuravankara Mundhwa Pune  E-Brochure.pdf
Puravankara Mundhwa Pune E-Brochure.pdf
 
SSPL The Strand Abodes Kharadi Pune Brochure.pdf
SSPL The Strand Abodes Kharadi Pune Brochure.pdfSSPL The Strand Abodes Kharadi Pune Brochure.pdf
SSPL The Strand Abodes Kharadi Pune Brochure.pdf
 
9990771857 Call Girls in Noida Sector 11 Noida (Call Girls) Delhi
9990771857 Call Girls in Noida Sector 11 Noida (Call Girls) Delhi9990771857 Call Girls in Noida Sector 11 Noida (Call Girls) Delhi
9990771857 Call Girls in Noida Sector 11 Noida (Call Girls) Delhi
 
Nanke Area Estate commercial ( Dir. Kat Kuo)
Nanke Area Estate commercial ( Dir. Kat Kuo)Nanke Area Estate commercial ( Dir. Kat Kuo)
Nanke Area Estate commercial ( Dir. Kat Kuo)
 
SVN Live 4.22.24 Weekly Property Broadcast
SVN Live 4.22.24 Weekly Property BroadcastSVN Live 4.22.24 Weekly Property Broadcast
SVN Live 4.22.24 Weekly Property Broadcast
 
The Omaxe State Dwarka Delhi-broucher.pdf.pdf
The Omaxe State Dwarka Delhi-broucher.pdf.pdfThe Omaxe State Dwarka Delhi-broucher.pdf.pdf
The Omaxe State Dwarka Delhi-broucher.pdf.pdf
 
Namrata 7 Plumeria Drive Pimpri Chinchwad Pune Brochure.pdf
Namrata 7 Plumeria Drive Pimpri Chinchwad Pune Brochure.pdfNamrata 7 Plumeria Drive Pimpri Chinchwad Pune Brochure.pdf
Namrata 7 Plumeria Drive Pimpri Chinchwad Pune Brochure.pdf
 
young call girls in Lajpat Nagar,🔝 9953056974 🔝 escort Service
young call girls in Lajpat Nagar,🔝 9953056974 🔝 escort Serviceyoung call girls in Lajpat Nagar,🔝 9953056974 🔝 escort Service
young call girls in Lajpat Nagar,🔝 9953056974 🔝 escort Service
 
Call Girls in Inderpuri Delhi 💯Call Us 🔝8264348440🔝
Call Girls in Inderpuri Delhi 💯Call Us 🔝8264348440🔝Call Girls in Inderpuri Delhi 💯Call Us 🔝8264348440🔝
Call Girls in Inderpuri Delhi 💯Call Us 🔝8264348440🔝
 
9990771857 Call Girls in Noida Sector 10 Noida (Call Girls) Delhi
9990771857 Call Girls in Noida Sector 10 Noida (Call Girls) Delhi9990771857 Call Girls in Noida Sector 10 Noida (Call Girls) Delhi
9990771857 Call Girls in Noida Sector 10 Noida (Call Girls) Delhi
 
8 Key Elements for Comfortable Farmland Living
8 Key Elements for Comfortable Farmland Living 8 Key Elements for Comfortable Farmland Living
8 Key Elements for Comfortable Farmland Living
 
9990771857 Call Girls in Noida Sector 06 Noida (Call Girls) Delhi
9990771857 Call Girls in Noida Sector 06 Noida (Call Girls) Delhi9990771857 Call Girls in Noida Sector 06 Noida (Call Girls) Delhi
9990771857 Call Girls in Noida Sector 06 Noida (Call Girls) Delhi
 
Listing Turkey Sylvana Istanbul - Bahcesehir
Listing Turkey Sylvana Istanbul - BahcesehirListing Turkey Sylvana Istanbul - Bahcesehir
Listing Turkey Sylvana Istanbul - Bahcesehir
 
call girls in Shahdara (DELHI) 🔝 >༒9953330565🔝 genuine Escort Service 🔝✔️✔️
call girls in Shahdara (DELHI) 🔝 >༒9953330565🔝 genuine Escort Service 🔝✔️✔️call girls in Shahdara (DELHI) 🔝 >༒9953330565🔝 genuine Escort Service 🔝✔️✔️
call girls in Shahdara (DELHI) 🔝 >༒9953330565🔝 genuine Escort Service 🔝✔️✔️
 
Sobha Aranya Sector 80 Gurgaon E- Brochure.pdf
Sobha Aranya Sector 80 Gurgaon E- Brochure.pdfSobha Aranya Sector 80 Gurgaon E- Brochure.pdf
Sobha Aranya Sector 80 Gurgaon E- Brochure.pdf
 
Call Girls In Mayur Vihar-1 Delhi ❤️8860477959 Good Looking Escorts In 24/7 D...
Call Girls In Mayur Vihar-1 Delhi ❤️8860477959 Good Looking Escorts In 24/7 D...Call Girls In Mayur Vihar-1 Delhi ❤️8860477959 Good Looking Escorts In 24/7 D...
Call Girls In Mayur Vihar-1 Delhi ❤️8860477959 Good Looking Escorts In 24/7 D...
 
Call Girls in Nehru Place Delhi 💯Call Us 🔝8264348440🔝
Call Girls in Nehru Place Delhi 💯Call Us 🔝8264348440🔝Call Girls in Nehru Place Delhi 💯Call Us 🔝8264348440🔝
Call Girls in Nehru Place Delhi 💯Call Us 🔝8264348440🔝
 
Call Girls In Vasundhara Ghaziabad ❤️8860477959 Low Rate Escorts Service In 2...
Call Girls In Vasundhara Ghaziabad ❤️8860477959 Low Rate Escorts Service In 2...Call Girls In Vasundhara Ghaziabad ❤️8860477959 Low Rate Escorts Service In 2...
Call Girls In Vasundhara Ghaziabad ❤️8860477959 Low Rate Escorts Service In 2...
 
Hot call girls in Moti Bagh🔝 9953056974 🔝 escort Service
Hot call girls in Moti Bagh🔝 9953056974 🔝 escort ServiceHot call girls in Moti Bagh🔝 9953056974 🔝 escort Service
Hot call girls in Moti Bagh🔝 9953056974 🔝 escort Service
 

Q2 2018 | Houston Retail | Research & Forecast Report

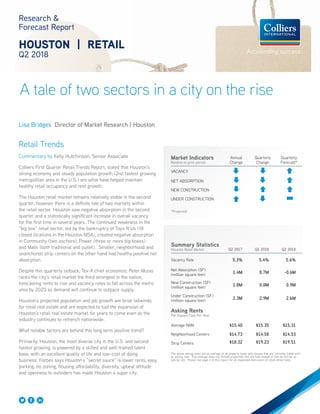
  • 1. A tale of two sectors in a city on the rise Research & Forecast Report HOUSTON | RETAIL Q2 2018 Lisa Bridges Director of Market Research | Houston Retail Trends Commentary by Kelly Hutchinson, Senior Associate Colliers First Quarter Retail Trends Report, stated that Houston’s strong economy and steady population growth (2nd fastest growing metropolitan area in the U.S.) are what have helped maintain healthy retail occupancy and rent growth. The Houston retail market remains relatively stable in the second quarter, however there is a definite tale of two markets within the retail sector. Houston saw negative absorption in the second quarter and a statistically significant increase in overall vacancy for the first time in several years. The continued weakness in the “big box” retail sector, led by the bankruptcy of Toys R Us (18 closed locations in the Houston MSA), created negative absorption in Community (two anchors), Power (three or more big boxes) and Malls (both traditional and outlet). Smaller, neighborhood and unanchored strip centers on the other hand had healthy positive net absorption. Despite this quarterly setback, Tex-X chief economist, Peter Muoio ranks the city’s retail market the third strongest in the nation, forecasting rents to rise and vacancy rates to fall across the metro area by 2020 as demand will continue to outpace supply. Houston’s projected population and job growth are brisk tailwinds for retail real estate and are expected to fuel the expansion of Houston’s retail real estate market for years to come even as the industry continues to retrench nationwide. What notable factors are behind this long term positive trend? Primarily, Houston, the most diverse city in the U.S. and second fastest growing, is powered by a skilled and well-trained talent base, with an excellent quality of life and low-cost of doing business. Forbes says Houston’s “secret sauce” is lower rents, easy parking, no zoning, housing affordability, diversity, upbeat attitude and openness to outsiders has made Houston a super city. Summary Statistics Houston Retail Market Q2 2017 Q1 2018 Q2 2018 Vacancy Rate 5.3% 5.4% 5.6% Net Absorption (SF) (million square feet) 1.4M 0.7M -0.6M New Construction (SF) (million square feet) 1.8M 0.8M 0.9M Under Construction (SF) (million square feet) 2.3M 2.9M 2.6M Asking Rents Per Square Foot Per Year Average NNN $15.40 $15.35 $15.31 Neighborhood Centers $14.73 $14.58 $14.53 Strip Centers $18.32 $19.23 $19.51 The above asking rents are an average of all property types and classes that are currently listed with an asking rate. This average does not include properties that are fully leased or that do not list an asking rate. Please see page 2 of this report for an expanded discussion of retail rental rates. Market Indicators Relative to prior period Annual Change Quarterly Change Quarterly Forecast* VACANCY NET ABSORPTION NEW CONSTRUCTION UNDER CONSTRUCTION *Projected
  • 2. 2 Houston Research & Forecast Report | Q2 2018 | Retail | Colliers International Retail Trends - continued >> POPULATION GROWTH – Ranked #2 fastest growing metro area in the U.S. >> JOB GROWTH – After a dip caused by the oil downturn, job growth is back to a very healthy 60-80k jobs per year pace. >> AFFORDABLE COST OF LIVING – 5th lowest overall cost of living among the top 20 metros. >> THRIVING MILLENNIAL POPULATION – Millennials make up approximately 28% of Houston’s population vs. a national average of 13%. Millennials disproportionately drive experiential retail and restaurant traffic. As Millennials age, their consumption of retail products and services are anticipated to grow. >> IMPACT OF THE BABY BOOMERS – Houston has a relatively smaller population of “Boomers” than most major cities, however this group continues to drive the healthcare expansion (now a significant retail use). >> ETHNIC AND RACIAL DIVERSITY – Houston has the 5th largest immigrant population among the larger metros and is the most diverse ethnic mix in the U.S. This population diversity opens opportunity for niche retail and cross-cultural concept growth. The long-term curve for Houston retail remains positive. Big box retail will continue to struggle in the near term as multi-channel retailing continues to erode the need for these large space concepts. Big boxes lease up in a significantly shorter time in areas with population density and high growth. Houston has both, and couple that with a historically proven track record of redeveloping and leasing up problems, Houston sustains itself in face of these negative factors. Grocery expansion following population growth and the associated small space retailers will remain strong for the foreseeable future. For a more detailed exploration of these topics, please check out our white paper at https://knowledge-leader.colliers.com/kelly-hutchinson/houston- retail-factors-to-success/. Vacancy & Availability Houston’s average retail vacancy rate increased 20 basis points between quarters from 5.4% in Q1 2018 to 5.6% and increased 30 basis points annually from 5.3% in Q2 2017. At the end of the second quarter, Houston had 15.8M SF of vacant retail space on the market. Among the major property types, single-tenant retail had the lowest vacancy rate of 2.0%, lifestyle centers at 2.4%, followed by theme/ entertainment at 2.8% and community centers at 5.0%. Outlet malls saw the largest increase over the quarter from 2.6 to 12.5% and malls vacancy rate increased from 4.6% to 5.5%. Neighborhood centers have the largest amount of vacant space by square feet and are 8.8% vacant. There is currently 2.6M SF of retail space under construction of which 69% is pre-leased. The majority of the projects under construction are located in the outlying suburban submarkets adjacent to rapidly growing residential developments. The largest project under construction is the 240,000-SF Metropark Square located north of Houston in the City of Shenandoah, Montgomery Co, TX. AMC and Dave and Busters are among the tenants in the new development. Sales Activity Source: Real Capital Analytics Q2 2018 NO. OF PROPERTIES: 50 TOTAL SF: 1.7M AVERAGE $/SF: $264 AVERAGE CAP RATE: 7.1% Job Growth & Unemployment (not seasonally adjusted) UNEMPLOYMENT 5/17 5/18 HOUSTON 4.8% 4.2% TEXAS 4.1% 3.7% U.S. 4.1% 3.6% JOB GROWTH Annual Change # of Jobs Added HOUSTON 2.6% 79.2K TEXAS 2.8% 344.7K U.S. 1.6% 2.4M Change in Sales (Year over Year) -80.0% -60.0% -40.0% -20.0% 0.0% 20.0% 40.0% 60.0% 80.0% 100.0% 120.0% Q2 '14 Q2 '15 Q2 '16 Q2 '17 Q2 '18 Average Price Per SF 0 50 100 150 200 250 300 Q2 '14 Q2 '15 Q2 '16 Q2 '17 Q2 '18 Houston U.S. Average CAP Rate 4.0% 5.0% 6.0% 7.0% 8.0% 9.0% 10.0% Q2 '14 Q2 '15 Q2 '16 Q2 '17 Q2 '18 Houston U.S.
  • 3. 3 Houston Research & Forecast Report | Q2 2018 | Retail | Colliers International33 Absorption & Demand Houston’s retail market posted 556,245 SF of negative net absorption in the second quarter, a significant decrease from the 680,964 SF of positive net absorption posted in the previous quarter. Some of the negative absorption can be attributed to the closing of “Big Box” stores located in Community Centers, Power Centers and Malls. Houston area Toys R Us stores closed all locations during the second quarter. The other source of negative absorption was from single tenant or free-standing retail such as branch banks, many closing branches closing due to a continued shift by consumers to on-line banking. Among the tenants that expanded into new locations during the second quarter are Kroger, HEB, Marshalls and Pluckers Wing Bar. These expansions are an indication that grocery stores, restaurants and discount retailers still pull in a healthy amount of foot traffic. Rental Rates According to CoStar, our data provider, Houston’s citywide average quoted retail rental rate for all property types decreased slightly between quarters from $15.35 per SF NNN in Q1 2018 to $15.31 per SF NNN. These average rental rates are typically much lower than actual deal rates since they include all retail property types and classes, the majority of those properties are not well leased and are listed with discounted asking rates. According to Colliers’ internal data, Class A in-line retail rental rates can vary widely from $30.00 to $85.00 per SF, depending on location and property type. Market Summary Q2 2018 Select Retail Lease Transactions BUILDING NAME/ADDRESS SUBMARKET SF TENANT LEASE DATE Deer Park Triangle NASA/Clear Lake 53,300 Joe V’s Smart Shop Apr-18 Four Corners Shopping Center Far South 12,500 Family Dollar Store Apr-18 Pinecroft Center I Montgomery County 12,000 Bassett Furniture Apr-18 Pearland Town Center Far South 7,000 Altar’d Interiors Jun-18 11 Gemini St NASA/Clear Lake 7,000 Nasa Kids Academy Apr-18 23692 Highway 59 N Montgomery County 6,800 The Draft Apr-18 Price Plaza Far Katy North 6,700 Mambo Seafood Jun-18 Pearland Town Center Far South 5,600 Victoria’s Secret/Pink Jun-18 Q2 2018 Retail Market Statistical Summary PROPERTY TYPE RENTABLE AREA DIRECT VACANT SF DIRECT VACANCY RATE SUBLET VACANT SF SUBLET VACANCY RATE TOTAL VACANT SF TOTAL VACANCY RATE 2Q18 NET ABSORPTION CLASS A RENTAL RATES (IN-LINE*) Strip Centers (unanchored) 35,834,161 2,895,662 8.1% 10,804 0.0% 2,906,466 8.1% 161,282 $27.00-$45.00 Neighborhood Centers (one anchor) 71,381,645 6,267,332 8.8% 76,390 0.1% 6,343,722 8.9% 268,202 $28.00-$46.00 Community Centers (two anchors) 47,614,673 2,317,313 4.9% 76,160 0.2% 2,393,473 5.0% (198,680) $28.00-$45.00 Power Centers (three or > anchors) 28,392,341 1,454,508 5.1% 11,625 0.0% 1,466,133 5.2% (331,271) $28.00-$45.00 Lifestyle Centers 6,052,121 145,457 2.4% - 0.0% 145,457 2.4% 67,473 $40.00-$85.00 Outlet Centers 1,330,725 165,860 12.5% - 0.0% 165,860 12.5% (131,624) $20.00-$40.00 Theme/Entertainment 499,468 13,859 2.8% - 0.0% 13,859 2.8% 3,879 $25.00-$35.00 Single-Tenant 72,744,169 1,306,412 1.8% 116,705 0.2% 1,423,117 2.0% (187,071) N/A Malls 23,599,518 1,280,409 5.4% 12,397 0.1% 1,292,806 5.5% (203,456) N/A GREATER HOUSTON 287,448,821 15,846,812 5.5% 304,081 0.1% 16,150,893 5.6% (551,266)
  • 4. 4 North American Research & Forecast Report | Q4 2014 | Office Market Outlook | Colliers International Copyright © 2015 Colliers International. The information contained herein has been obtained from sources deemed reliable. While every reasonable effort has been made to ensure its accuracy, we cannot guarantee it. No responsibility is assumed for any inaccuracies. Readers are encouraged to consult their professional advisors prior to acting on any of the material contained in this report. Colliers International | Market 000 Address, Suite # 000 Address, Suite # +1 000 000 0000 colliers.com/<<market>> 4 North American Research & Forecast Report | Q4 2014 | Office Market Outlook | Colliers International Copyright © 2018 Colliers International. The information contained herein has been obtained from sources deemed reliable. While every reasonable effort has been made to ensure its accuracy, we cannot guarantee it. No responsibility is assumed for any inaccuracies. Readers are encouraged to consult their professional advisors prior to acting on any of the material contained in this report. Colliers International | Houston 1233 West Loop South, Suite 900 Houston, Texas 77027 +1 713 222 2111 colliers.com/houston FOR MORE INFORMATION Lisa Bridges Director of Market Research | Houston +1 713 830 2125 lisa.bridges@colliers.com 115.6M SF 15.3M SF Q2 2018 Houston Retail Highlights Kelly Hutchinson Senior Associate | Houston +1 713 830 2146 kelly.hutchinson@colliers.com