Q3 2018 Houston Retail Research & Forecast Report
•
1 like•30 views

E-commerce continues to change the landscape of traditional retail

Recommended
Recommended
More Related Content
What's hot
Similar to Q3 2018 Houston Retail Research & Forecast Report
Similar to Q3 2018 Houston Retail Research & Forecast Report (20)
More from Colliers International | Houston
More from Colliers International | Houston (20)
Recently uploaded
Recently uploaded (20)
Q3 2018 Houston Retail Research & Forecast Report
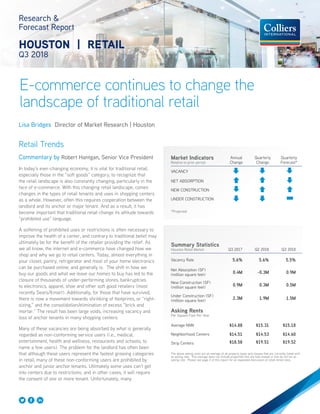
- 1. E-commerce continues to change the landscape of traditional retail Research & Forecast Report HOUSTON | RETAIL Q3 2018 Lisa Bridges Director of Market Research | Houston Retail Trends Commentary by Robert Hantgan, Senior Vice President In today’s ever-changing economy, it is vital for traditional retail, especially those in the “soft goods” category, to recognize that the retail landscape is also constantly changing, particularly in the face of e-commerce. With this changing retail landscape, comes changes in the types of retail tenants and uses in shopping centers as a whole. However, often this requires cooperation between the landlord and its anchor or major tenant. And as a result, it has become important that traditional retail change its attitude towards “prohibited use” language. A softening of prohibited uses or restrictions is often necessary to improve the health of a center, and contrary to traditional belief may ultimately be for the benefit of the retailer providing the relief. As we all know, the internet and e-commerce have changed how we shop and why we go to retail centers. Today, almost everything in your closet, pantry, refrigerator and most of your home electronics can be purchased online, and generally is. The shift in how we buy our goods and what we leave our homes to buy has led to the closure of thousands of under-performing stores, bankruptcies to electronics, apparel, shoe and other soft good retailers (most recently Sears/Kmart). Additionally, for those that have survived, there is now a movement towards shrinking of footprints, or “right- sizing,” and the consolidation/elimination of excess “brick and mortar.” The result has been large voids, increasing vacancy and loss of anchor tenants in many shopping centers. Many of these vacancies are being absorbed by what is generally regarded as non-conforming service users (i.e., medical, entertainment, health and wellness, restaurants and schools, to name a few users). The problem for the landlord has often been that although these users represent the fastest growing categories in retail, many of these non-conforming users are prohibited by anchor and junior anchor tenants. Ultimately some uses can’t get into centers due to restrictions, and in other cases, it will require the consent of one or more tenant. Unfortunately, many Summary Statistics Houston Retail Market Q3 2017 Q2 2018 Q3 2018 Vacancy Rate 5.6% 5.6% 5.5% Net Absorption (SF) (million square feet) 0.4M -0.3M 0.9M New Construction (SF) (million square feet) 0.9M 0.3M 0.5M Under Construction (SF) (million square feet) 2.3M 1.9M 1.5M Asking Rents Per Square Foot Per Year Average NNN $14.88 $15.31 $15.18 Neighborhood Centers $14.51 $14.53 $14.60 Strip Centers $18.58 $19.51 $19.52 The above asking rents are an average of all property types and classes that are currently listed with an asking rate. This average does not include properties that are fully leased or that do not list an asking rate. Please see page 2 of this report for an expanded discussion of retail rental rates. Market Indicators Relative to prior period Annual Change Quarterly Change Quarterly Forecast* VACANCY NET ABSORPTION NEW CONSTRUCTION UNDER CONSTRUCTION *Projected
- 2. 2 Houston Research & Forecast Report | Q3 2018 | Retail | Colliers International Retail Trends - continued retailers (some of them very significant major tenants in lots of centers) are looking at the “prohibitive use” language as a means of capitalizing on antiquated provisions that most have little to no adverse effect on their business and are profiting by providing their consent. Many retailers are layering non-essential or inconsequential prohibitive use language in their leases, not in an effort to keep out competitors or undesirable uses, but in an effort really to control the character of the shopping center. As landlords chase the “best” tenants, they often had to or continue to acquiesce to the demands of majors, and this subsequently forces the landlord to negotiate a waiver or consent at a later date. The waiver process can be as simple as a conversation followed up by an email acknowledgment- “sure we like the use and think its good for business”, or more often than not, a negotiation for compensation to grant the waiver (regardless of whether the new user will enhance the center as a whole and ultimately benefit the party providing the waiver). The list of demands might be as simple as a nominal one-time payment or granting additional term, or more likely a more significant payment or tenant allowance, or rent reduction for the balance of the term (both in base rent and NNN’s). In other instances, the tenant may seek to shift responsibilities or obligations under the lease from the tenant to the landlord- either way, the cost of obtaining a waiver or consent has been raised. Sometimes the demands are so egregious the landlord can’t move forward, and the landlord loses out, but often these demands are negotiated, and the non-conforming use is permitted to lease space in the center. When the waiver demands cannot be met, this is not only detrimental to the landlord, but it also hurts the vitality of the retailer(s) that are making the demands. Vacancies are bad for everybody’s business. Fewer tenants equate to less traffic which generally equates to stores with diminishing volume in the center. The simple solution for higher occupancy and strong store profits is for tenants to relax some of their “prohibitive use” language and allow for a new breed of retailers, which are e-commerce resistant, to fill vacancies and drive traffic back to what has become an outdated and dormant Center. Landlord’s need to concentrate on the correct tenant mix and how best to drive traffic to their center and tenant’s need to get back to focusing on their core business and what ultimately drives profits and shareholder value and less on profiting on legal loopholes. Vacancy & Availability Houston’s average retail vacancy rate fell 10 basis points between quarters from 5.6% in Q2 2018 to 5.5%. At the end of the second quarter, Houston had 15.7M SF of vacant retail space on the market. Among the major property types, single-tenant retail had the lowest vacancy rate of 1.9%, theme/entertainment at 2.8%, followed by lifestyle centers at 3.6% and malls at 5.0%. Outlet centers have the highest vacancy rate of 12.1%, followed by neighborhood centers with a vacancy rate of 8.2% and then strip centers at 8.1%. There is currently 1.5M SF of retail space under construction of which 66% is pre-leased. The majority of the projects under construction are located in the outlying suburban submarkets adjacent to rapidly growing Sales Activity Source: Real Capital Analytics Q3 2018 NO. OF PROPERTIES: 46 TOTAL SF: 4.9M AVERAGE $/SF: $251 AVERAGE CAP RATE: 7.0% Job Growth & Unemployment (not seasonally adjusted) UNEMPLOYMENT 8/17 8/18 HOUSTON 5.1% 4.3% TEXAS 4.4% 3.9% U.S. 4.5% 3.9% JOB GROWTH Annual Change # of Jobs Added HOUSTON 3.7% 101.2K TEXAS 3.2% 386.9K U.S. 1.7% 2.4M Average Price Per SF $100 $120 $140 $160 $180 $200 $220 $240 $260 $280 Q3 '14 Q3 '15 Q3 '16 Q3 '17 Q3 '18 Houston, TX U.S. Average CAP Rate 4.0% 5.0% 6.0% 7.0% 8.0% 9.0% 10.0% Q3 '14 Q3 '15 Q3 '16 Q3 '17 Q3 '18 Houston, TX U.S.
- 3. 3 Houston Research & Forecast Report | Q3 2018 | Retail | Colliers International33 residential developments. The largest project under construction is the 533,200-SF Waterview Town Center located in southwest Houston in Fort Bend Co, TX. Academy, Studio Movie Grill, LA Fitness and At Home are among the tenants that will occupy space in the center. Absorption & Demand Houston’s retail market posted 812,127 SF of negative net absorption in the third quarter, a significant increase from the 437,397 SF of negative net absorption posted in the previous quarter. Some of the positive absorption can be attributed to new concepts opening in “Big Box” stores located in Community Centers, Power Centers and Malls. Among the tenants that expanded into new locations during the third quarter are The Play Space, Conn’s Home Plus, Easy Mart, H-E-B and Total Wine & More. Rental Rates According to CoStar, our data provider, Houston’s citywide average quoted retail rental rate for all property types decreased slightly between quarters from $15.31 per SF NNN in Q2 2018 to $15.18 per SF NNN. These average rental rates are typically much lower than actual deal rates since they include all retail property types and classes, the majority of those properties are not well leased and are listed with discounted asking rates. According to Colliers’ internal data, Class A in-line retail rental rates can vary widely from $30.00 to $85.00 per SF, depending on location and property type. Leasing Activity Houston’s retail leasing activity, which includes renewals, decreased quarterly from 1.4M SF in Q2 2018 to 1.2M square feet in Q3 2018. Some of the tenants that signed leases during the third quarter are listed in the table below. Q3 2018 Select Retail Lease Transactions BUILDING NAME/ADDRESS SUBMARKET SF TENANT LEASE DATE Fountains on the Lake Sugar Land 25,000 Conn’s Home Plus Jul-18 Fountains on the Lake Sugar Land 20,000 Burke’s Outlet Jul-18 Kirby Collection Greenway Plaza 11.100 The Dakota Sept-18 Bender Square Lake Houston 9,500 BPL Plasam Jul-18 Fountains on the Lake Sugar Land 8,000 El Tiempo Jul-18 Grand Parkway Marketplace II Far North 7,552 Spec’s Wine and Spirits Jul-18 MARQ*E Entertainment Center Near NW Spring Valley 7,278 Warehouse 72 Jul-18 Q3 2018 Retail Market Statistical Summary PROPERTY TYPE RENTABLE AREA DIRECT VACANT SF DIRECT VACANCY RATE SUBLET VACANT SF SUBLET VACANCY RATE TOTAL VACANT SF TOTAL VACANCY RATE 3Q18 NET ABSORPTION CLASS A RENTAL RATES (IN-LINE*) Strip Centers (unanchored) 36,303,219 2,908,282 8.0% 16,696 0.0% 2,924,978 8.1% 45,129 $27.00-$45.00 Neighborhood Centers (one anchor) 71,015,263 5,790,822 8.2% 47,736 0.1% 5,838,558 8.2% 310,827 $28.00-$46.00 Community Centers (two anchors) 46,914,044 2,432,240 5.2% 82,100 0.2% 2,514,340 5.4% (113,016) $28.00-$45.00 Power Centers (three or > anchors) 29,170,442 1,510,848 5.2% 7,200 0.0% 1,518,048 5.2% 30,018 $28.00-$45.00 Lifestyle Centers 6,236,420 225,195 3.6% - 0.0% 225,195 3.6% 21,153 $40.00-$85.00 Outlet Centers 1,408,137 170,360 12.1% - 0.0% 170,360 12.1% (4,500) $20.00-$40.00 Theme/Entertainment 499,468 13,859 2.8% - 0.0% 13,859 2.8% - $25.00-$35.00 Single-Tenant 73,071,757 1,342,588 1.8% 73,380 0.1% 1,415,968 1.9% 358,059 N/A Malls 22,399,338 1,111,904 5.0% 12,397 0.1% 1,124,301 5.0% 164,457 N/A GREATER HOUSTON 287,018,088 15,506,098 5.4% 239,509 0.1% 15,745,607 5.5% 812,127 Market Summary
- 4. 4 North American Research & Forecast Report | Q4 2014 | Office Market Outlook | Colliers International Copyright © 2015 Colliers International. The information contained herein has been obtained from sources deemed reliable. While every reasonable effort has been made to ensure its accuracy, we cannot guarantee it. No responsibility is assumed for any inaccuracies. Readers are encouraged to consult their professional advisors prior to acting on any of the material contained in this report. Colliers International | Market 000 Address, Suite # 000 Address, Suite # +1 000 000 0000 colliers.com/<<market>> 4 North American Research & Forecast Report | Q4 2014 | Office Market Outlook | Colliers International Copyright © 2018 Colliers International. The information contained herein has been obtained from sources deemed reliable. While every reasonable effort has been made to ensure its accuracy, we cannot guarantee it. No responsibility is assumed for any inaccuracies. Readers are encouraged to consult their professional advisors prior to acting on any of the material contained in this report. Colliers International | Houston 1233 West Loop South, Suite 900 Houston, Texas 77027 +1 713 222 2111 colliers.com/houston FOR MORE INFORMATION Lisa Bridges Director of Market Research | Houston +1 713 830 2125 lisa.bridges@colliers.com 115.6M SF 15.3M SF Q3 2018 Houston Retail Highlights Robert Hantgan Senior Vice President | Houston +1 713 830 2178 robert.hantgan@colliers.com