Experion Elements Sector 45 Noida_Brochure.pdf.pdf
Houston Retail Market Vacancy Holds Steady at 6.8
1. www.colliers.com/houston
Q3 2013 | RETAIL MARKET
HOUSTON RETAIL
MARKET INDICATORS
Q3 2012 Q3 2013
CITYWIDE NET
ABSORPTION (SF) -127K 120K
CITYWIDE AVERAGE
VACANCY 7.2% 6.8%
CITYWIDE AVERAGE
RENTAL RATE $14.49 $14.89
DELIVERIES (SF) 120K 196K
UNDER
CONSTRUCTION (SF) 1.1M 870K
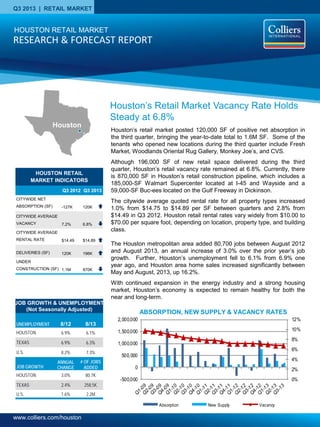
Houston’s retail market posted 120,000 SF of positive net absorption in
the third quarter, bringing the year-to-date total to 1.6M SF. Some of the
tenants who opened new locations during the third quarter include Fresh
Market, Woodlands Oriental Rug Gallery, Monkey Joe’s, and CVS.
Although 196,000 SF of new retail space delivered during the third
quarter, Houston’s retail vacancy rate remained at 6.8%. Currently, there
is 870,000 SF in Houston’s retail construction pipeline, which includes a
185,000-SF Walmart Supercenter located at I-45 and Wayside and a
59,000-SF Buc-ees located on the Gulf Freeway in Dickinson.
The citywide average quoted rental rate for all property types increased
1.0% from $14.75 to $14.89 per SF between quarters and 2.8% from
$14.49 in Q3 2012. Houston retail rental rates vary widely from $10.00 to
$70.00 per square foot, depending on location, property type, and building
class.
The Houston metropolitan area added 80,700 jobs between August 2012
and August 2013, an annual increase of 3.0% over the prior year’s job
growth. Further, Houston’s unemployment fell to 6.1% from 6.9% one
year ago, and Houston area home sales increased significantly between
May and August, 2013, up 16.2%.
With continued expansion in the energy industry and a strong housing
market, Houston’s economy is expected to remain healthy for both the
near and long-term.
ABSORPTION, NEW SUPPLY & VACANCY RATES
0%
2%
4%
6%
8%
10%
12%
-500,000
0
500,000
1,000,000
1,500,000
2,000,000
Absorption New Supply Vacancy
Houston’s Retail Market Vacancy Rate Holds
Steady at 6.8%
HOUSTON RETAIL MARKET
RESEARCH & FORECAST REPORT
Houston
UNEMPLOYMENT 8/12 8/13
HOUSTON 6.9% 6.1%
TEXAS 6.9% 6.3%
U.S. 8.2% 7.3%
JOB GROWTH
ANNUAL
CHANGE
# OF JOBS
ADDED
HOUSTON 3.0% 80.7K
TEXAS 2.4% 258.5K
U.S. 1.6% 2.2M
JOB GROWTH & UNEMPLOYMENT
(Not Seasonally Adjusted)
2. RESEARCH & FORECAST REPORT | Q3 2013 | HOUSTON RETAIL MARKET
SALES ACTIVITY
Houston retail investment sales
activity increased between
quarters with 228 sales
transactions recorded in the
third quarter compared to 205 in
the second quarter. Total sales
transaction volume totaled
$181M and the average price
per SF was $180. The average
cap rate was 6.7%.
Several of the more significant
transactions that closed during
the third quarter are highlighted
at left.
LEASING ACTIVITY
Houston retail leasing activity in
the third quarter reached 1.1M
SF, bringing the year-to-date
total to 3.1M SF, mostly due to
renewals. Overall, transactions
under 10,000 SF comprised the
largest group of retail leases,
with the market recording eleven
leases over 10,000 SF and only
five over 20,000 SF in the third
quarter.
A partial list of the leases signed
during the third quarter are listed
in the table below.
COLLIERS INTERNATIONAL | P. 2
Woodlake Square Shopping Center
9600-9660 Westheimer, Houston, TX
West Submarket
RBA: 161,081 SF
Built: 1970/2011
Buyer: AmREIT, Inc.
Seller: AEW Capital Management
Date: September 24, 2013
Price: $41.6M or $258/SF
Cap: 5.7%
1
Renewal 2
Expansion 3
Sublease
Grand Lakes Marketplace
6565 S Fry Rd, Katy, TX
West Submarket
RBA: 131,195 SF
Built: 2013
Buyer: JLL Income PT
Seller: Fidelis Realty
Date: September 30, 2013
Price: $48.5M or $370/SF
Cap: 5.3%
League City Towne Center
Gulf Freeway & FM 646, League City, TX
NASA/Clear Lake Submarket
RBA: 194,867 SF
Built: 2008
Buyer: Excel Trust, Inc.
Seller: Property Commerce
Date: July 31, 2013
Price: $39.5M or $203/SF
Cap: 7.15%
RETAIL SALE TRANSACTIONS
Park Plaza Centre
406 &414 W Grand Parkway, Katy, TX
West Submarket
RBA: 68,990 SF
Built: 2005
Buyer: Texas Pacific Properties
Seller: Thompson National Properties
Date: July 29, 2013
Price: $5.7M or $83/SF
Cap: 9.2%
Building Name or Address Submarket SF Tenant Lease Date
Pasadena Town Square Near Southeast 122,526 Ventech Sep-13
Pecan Park Plaza NASA/Clear Lake 37,800 Jumping World Aug-13
Corum Village FM 1960/I-45 20,579 Northwest Assistance Ministries Jul-13
3743-3747 Westheimer Rd. Inner Loop/ River Oaks 20,000 The Fresh Market Jul-13
3111 N Fry Rd Far Katy North 18,700 99 Cents Only Jul-13
610 W. Cavalcade St. Inner Loop/Heights 12,000 A-Z Nothing Over Dollar One1
Jul-13
Market at First Colony Stafford 8,646 Kee Mat Grocers Jul-13
Terramont Village Montgomery County 8,600 Woodlands Oriental Rug Gallery Jul-13
Missouri City Corners Stafford 7,954 Super 6 Buffet Aug-13
Village Plaza at Bunker Hill Near NW Spring Valley 7,803 Olive Garden Aug-13
Fairmont Kroger Center NASA/Clear Lake 6,650 First Choice ER Jul-13
Westchase Shopping Center Westchase 6,342 Mattress One Jul-13
Cypresswood Center Far North 5,439 Doghouse Pub1
Aug-13
Q3 2013 Retail Leases
3. RESEARCH & FORECAST REPORT | Q3 2013 | HOUSTON RETAIL MARKET
RENTAL RATES
The citywide average quoted
rental rate for all property types
increased 1.0% from $14.75 to
$14.89 per SF between quarters
and 2.8% from $14.49 in Q3
2012.
Class A in-line retail rental rates
vary widely due to location and
center type. Recent quoted rates
for neighborhood centers, power
centers and unanchored strip
centers, range from $20.00 -
$35.00 per SF (Class B and
below can rent for $12.00 to
$20.00 per SF) while
theme/entertainment centers
range from $25.00 - $35.00 per
SF. Lifestyle centers and newly
constructed strip centers in Class
A locations such as High Street,
Uptown Park and The Vintage
range from $40.00 - $70.00 per
SF.
VACANCY & AVAILABILITY
Houston’s retail vacancy held
steady between quarters at
6.8%. By product type on a
quarterly basis, power centers
posted the largest decrease in
vacancy, 40 basis points,
followed by neighborhood
centers decreasing 10 basis
points. Community centers,
outlet centers, and theme/
entertainment centers vacancy
rates remained unchanged at
6.3%, 8.3%, and 33.8%,
respectively. Strip centers
vacancy rate increased 30 basis
points, followed by lifestyle
centers and single tenant
properties, both increasing 20
basis points between quarters.
Mall vacancy rates saw the
smallest increase between
quarters, 10 basis points.
Houston’s retail construction
pipeline contains 870,000 SF and
third quarter deliveries totaled
196,000 SF.
ABSORPTION & DEMAND
Houston’s retail market posted
120,000 SF of positive net
absorption in the third quarter,
bringing the year-to-date positive
net absorption to 1.6M SF. Some
of the tenants that moved into
space during the third quarter are
listed in the table below.
HOUSTON RETAIL MARKET STATISTICAL SUMMARY
Q3 2013 ABSORPTION
Tenant/
Submarket
SF
Occupied
HEB
Near North 25,106
The Fresh Market
Inner Loop/River Oaks 20,000
Monkey Joes
Sugar Land 16,800
Stepping Stone Charter
School
Sugar Land 11,000
CVS
Near NW/Spring Valley 11,000
Pearland Primary Care
Far South 8,762
Kee Mat Grocers
Stafford 8,646
Woodlands Oriental
Rug Gallery
Montgomery County 8,600
Carrabba’s Italian Grill
Near West 7,124
COLLIERS INTERNATIONAL | P. 3
Rentable
Area
Direct
Vacant SF
Direct
Vacancy
Rate
Sublet
Vacant SF
Sublet
Vacancy
Rate
Total
Vacant SF
Total
Vacancy
Rate
Q3 2013
Net
Absorption
YTD 2013
Net
Absorption
Class A
Rental Rates
(in-line)*
Strip Centers (unanchored) 32,379,938 3,383,044 10.4% 3,866 0.0% 3,386,910 10.5% (15,086) 134,905 $20.00-$35.00
Neighborhood Centers (one anchor) 68,563,764 7,198,019 10.5% 158,054 0.2% 7,356,073 10.7% 19,563 349,632 $20.00-$35.00
CommunityCenters (two anchors) 42,764,386 2,595,267 6.1% 94,012 0.2% 2,689,279 6.3% (6,990) 370,394 $18.00-$30.00
Power Centers (3 or more anchors) 19,919,325 1,005,410 5.0% 24,982 0.1% 1,030,392 5.2% 86,951 133,298 $20.00-$35.00
Lifestyle Centers 2,921,008 140,406 4.8% - 0.0% 140,406 4.8% (4,758) (7,479) $40.00-$70.00
Outlet Centers 1,593,814 132,724 8.3% - 0.0% 132,724 8.3% 0 (6,418) N/A
Theme/Entertainment 676,840 228,813 33.8% - 0.0% 228,813 33.8% - - $25.00-$35.00
Single-Tenant 66,291,944 1,405,446 2.1% 51,816 0.1% 1,457,262 2.2% 46,058 502,729 N/A
Malls 30,197,454 1,653,173 5.5% 58,539 0.2% 1,711,712 5.7% (5,725) 87,355 N/A
Greater Houston 265,308,473 17,742,302 6.7% 391,269 0.1% 18,133,571 6.8% 120,013 1,564,416
4. RESEARCH & FORECAST REPORT | Q3 2013 | HOUSTON RETAIL MARKET
Accelerating success.
COLLIERS INTERNATIONAL
1223 W. Loop South
Suite 900
Houston, Texas 77027
Main +1 713 222 2111
LISA R. BRIDGES
Director of Market Research | Houston
Direct +1 713 830 2125
Fax +1 713 830 2118
lisa.bridges@colliers.com
The Colliers Advantage
Enterprising Culture
Colliers International is a leader in global real estate services,
defined by our spirit of enterprise. Through a culture of service
excellence and a shared sense of initiative, we integrate the
resources of real estate specialists worldwide to accelerate
the success of our partners.
When you choose to work with Colliers, you choose to work
with the best. In addition to being highly skilled experts in their
field, our people are passionate about what they do. And they
know we are invested in their success just as much as we are
in our clients’ success.
This is evident throughout our platform—from Colliers University, our proprietary education and professional development platform, to our
client engagement strategy that encourages cross-functional service integration, to our culture of caring.
We connect through a shared set of values that shape a collaborative environment throughout our organization that is unsurpassed in the
industry. That’s why we attract top recruits and have one of the highest retention rates in the industry. Colliers International has also been
recognized as one of the “best places to work” by top business organizations in many of our markets across the globe.
Colliers International offers a comprehensive portfolio of real estate services to occupiers, owners and investors on a local, regional,
national and international basis.
COLLIERS INTERNATIONAL | P. 4