More Related Content
Similar to Investment Outlook for Commercial Real Estate June 2015
Similar to Investment Outlook for Commercial Real Estate June 2015 (20)
Investment Outlook for Commercial Real Estate June 2015
- 1. Following the approximate 30% run-up in the strength of the dollar in the second half
of 2014, exchange rates have generally stabilized in 2015. Foreign capital flows into
U.S. commercial real estate reached an all-time high of $22.1 billion dollars in the first
quarter, far surpassing the prior record of $15.8 billion in 2007 Q2. The labor force
has added an average of 228,000 jobs per month over the past two years but the trend
has slowed to 194,000 jobs per month so far in 2015. For the near term, real estate
fundamentalsgenerallycontinuetolookhealthy. Hindrancesweremainfocusedonare
Fed policy decisions, spikes in construction activity and the consumer.
Apartment cap rates have continued to compress in recent years and prices are now
21% above the peak reached in 2007. Although demographically driven apartment
demand will push rents higher in most California and Florida markets, many U.S. mar-
ketshavepeakedinoccupancyandpossiblyevenrentlevels. Investorsshouldconsider
economicsubstitution(costnewversuspriceofacquisition),populationdemographics,
and rate of return sensitivity to interest rate movements on new acquisitions. Markets
that have likely reached peak rent and occupancy levels include Houston,Washington
DC, Milwaukee, and Philadelphia.
Industrialindicators,suchasindustrialproduction,PMI,andmanufacturer’sneworders,
indicate moderate expansion for the sector in 2015. Improving consumer confidence,
increasingresidentialinvestment,andrisinglaborcostsinAsiamaycontributetoanup-
side surprise. Internet retail spending has provided a consistent source of demand for
warehouse and distribution facilities in recent years and this trend will continue. The
PanamaCanalexpansionprojectmaytemperwestcoastdemandandincreasedistribu-
tion needs in the Gulf Coast and East Coast regions. Two year NOI forecast suggest
non-traditional distribution markets like Austin, New York and Richmond will outper-
form major traditional distribution centers like Atlanta and Chicago.
Office net absorption was lower than net completions in the first quarter. The inverse
had been true every prior quarter over the past five years. Net absorption is projected
to be 67 million SF for the remainder of the year while net completions are expected
to be slightly less at 52 million SF. Houston’s vacancy rate, which increased 70 bps
in the first quarter, will continue to deteriorate if oil prices remain in the $60 per bar-
rel range during 2015. Favorable markets include San Francisco, Austin, and Denver
mainly because of favorable forecasts in the tech sector. Forecasts for declining rents
and rising vacancy levels are indicating some concern for properties in Northern New
Jersey, Washington DC and Houston.
Retail sales volume for the first quarter was $24 billion, a level unchanged from a year
ago. Cap rate were close to 6.4%, the lowest rate on record (prior low was 6.5% in
2007). Although the retail vacancy rate is 6.5%, most malls are either much below that
figure or much above that figure. The number of malls with a vacancy rate above 40%
is more than double what it was in 2006 and 2007, despite the average retail vacancy
rate being approximately the same now as in 2007. Online shopping is transform-
ing retail real estate, with department stores and consumer electronics stores strug-
glingthemostinrecentyears. Groceryanchoredcenters,showrooms,restaurants,and
warehouse/club categories will stay resistant to internet poaching in the near term,
but careful consideration should be given to tenant viability. We look to Miami, New
OrleansandNashvilletooutperformandSacramento,PhoenixandLasVegastounder-
perform given the future forecast for rents and occupancy levels.
Applied ResearchUSA Realty Advisors, LLC
June 4, 2015
For questions or comments, contact Will Pattison at wpattison@aegonusa.com or 319-355-5432
Copyright © 2015 AEGON USA Realty Advisors, LLC
www.aegonrealty.com
InvestmentOutlookForCommercialRealEstate
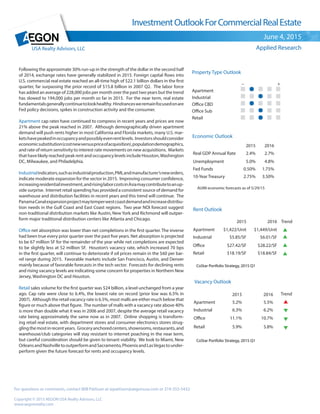
Property Type Outlook
_ +
Apartment
Industrial
Office CBD
Office Sub
Retail
2015 2016 Trend
Apartment $1,422/Unit $1,449/Unit
Industrial $5.85/SF $6.01/SF
Office $27.42/SF $28.22/SF
Retail $18.19/SF $18.84/SF
2015 2016
Apartment 5.2% 5.5%
Industrial 6.3% 6.2%
Office 11.1% 10.7%
Retail 5.9% 5.8%
Rent Outlook
Vacancy Outlook
Economic Outlook
AUIM economic forecasts as of 5/29/15
2015 2016
Real GDP Annual Rate 2.4% 2.7%
Unemployment 5.0% 4.8%
Fed Funds 0.50% 1.75%
10-Year Treasury 2.75% 3.50%
CoStar Portfolio Strategy, 2015 Q1
CoStar Portfolio Strategy, 2015 Q1
Trend