Business at a Glance: September 2023 Monthly Economic Report
•
0 likes•3 views

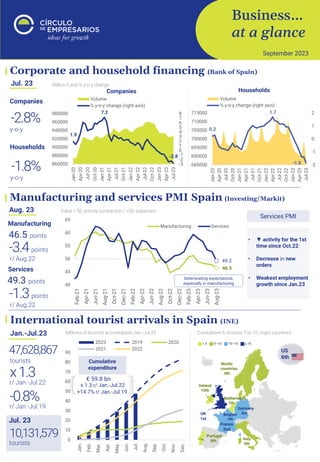
- Manufacturing and services PMIs in Spain and the Eurozone fell in August, indicating a contraction in activity, with declines in new orders and employment growth. - International tourist arrivals in Spain increased by 14.7% compared to January-July 2019 but fell 0.8% compared to the same period in 2022. - Eurozone industrial production prices declined 7.6% year-on-year in July, while the trade deficit with Russia narrowed due to lower energy imports.

Recommended
Recommended
More Related Content
Similar to Business at a Glance: September 2023 Monthly Economic Report
Similar to Business at a Glance: September 2023 Monthly Economic Report (20)
More from Círculo de Empresarios
More from Círculo de Empresarios (20)
Recently uploaded
Recently uploaded (20)
Business at a Glance: September 2023 Monthly Economic Report
- 1. Business… at a glance September 2023 46.5 49.3 40 45 50 55 60 65 Feb-21 Apr-21 Jun-21 Aug-21 Oct-21 Dec-21 Feb-22 Apr-22 Jun-22 Aug-22 Oct-22 Dec-22 Feb-23 Apr-23 Jun-23 Aug-23 Manufacturing Services 0.2 1.7 -1.8 -2 -1 0 1 2 685000 690000 695000 700000 705000 710000 715000 Jan-20 Apr-20 Jul-20 Oct-20 Jan-21 Apr-21 Jul-21 Oct-21 Jan-22 Apr-22 Jul-22 Oct-22 Jan-23 Apr-23 Jul-23 Volume % y-o-y change (right axis) 1.9 7.2 -2.8 -3 -2 -1 0 1 2 3 4 5 6 7 8 860000 880000 900000 920000 940000 960000 980000 Jan-20 Apr-20 Jul-20 Oct-20 Jan-21 Apr-21 Jul-21 Oct-21 Jan-22 Apr-22 Jul-22 Oct-22 Jan-23 Apr-23 Jul-23 Volume % y-o-y change (right axis) International tourist arrivals in Spain (INE) tourists x1.3 Jan.-Jul.23 Jul. 23 47,628,867 r/ Jan.-Jul.22 -0.8% r/ Jan.-Jul.19 Millions of tourists accumulated Jan.-Jul.23 10,131,579 tourists Cumulative expenditure +14.7% r/ Jan.-Jul.19 € 59.8 bn x 1.3 r/ Jan.-Jul.22 Cumulative % tourists Top 10 origin countries US 6th 46.5 points r/ Aug.22 -3.4points Manufacturing Manufacturing and services PMI Spain (Investing/Markit) Value < 50: activity contraction / >50: expansion Aug. 23 Services PMI 49.3 points r/ Aug.22 -1.3points Services • ▼ activity for the 1st time since Oct.22 • Decrease in new orders • Weakest employment growth since Jan.23 Deteriorating expectations, especially in manufacturing Corporate and household financing (Bank of Spain) Million € and % y-o-y change Jul. 23 -2.8% Companies Households y-o-y -1.8% y-o-y Companies Households 0 10 20 30 40 50 60 70 80 90 Jan. Feb. Mar. Apr. May. Jun. Jul. Aug. Sep. Oct. Nov. Dec. 2023 2019 2020 2021 2022
- 2. Business… at a glance. a publication of the “Círculo de Empresarios” produced by its Department of Economy. contains information and opinion from reliable sources. However. the “Círculo de Empresarios” does not guarantee its accuracy and does not take responsibility for any errors or omissions. This document is merely informative. As a result. the “Círculo de Empresarios” is not responsible for any uses that may be made of the publication. The opinions and estimates of the Department can be modified without prior warning. 63.4 43.5 63.4 47.9 Feb-21 May-21 Aug-21 Nov-21 Feb-22 May-22 Aug-22 Nov-22 Feb-23 May-23 Aug-23 Eurozone US Industrial production prices in Europe (Eurostat) Jul. 23 monthly -0.5% y-o-y -7.6% Eurozone % y-o-y change Major economies in the Eurozone 0.4 43.4 -7.6 Jan-21 Mar-21 May-21 Jul-21 Sep-21 Nov-21 Jan-22 Mar-22 May-22 Jul-22 Sep-22 Nov-22 Jan-23 Mar-23 May-23 Jul-23 Jul.23 EU-Russia trade (Eurostat) Jun. 23 Destabilized data Imports extra-EU Russia's share in 1.7% Exports extra-EU 1.4% Bn € ▼ deficit mainly due to ▼ energy imports Trade balance. Bn € Manufacturing Manufacturing and services PMIs Eurozone and US (Markit) Aug. 23 -6.1p. -3.6p. y-o-y 43.5 points 47.9 points y-o-y Services -1.9p. +6.8p. y-o-y 47.9 points 50.5 points y-o-y Value < 50: activity contraction / >50: expansion % y-o-y change Jan-21 – Jul-23 2 7 12 17 22 Feb-21 Apr-21 Jun-21 Aug-21 Oct-21 Dec-21 Feb-22 Apr-22 Jun-22 Aug-22 Oct-22 Dec-22 Feb-23 Apr-23 Jun-23 Imports Exports -40.4 -5.7 -45.0 -1.6 -50 -40 -30 -20 -10 0 Q121Q221Q321Q421Q122Q222Q322Q422Q123Q223 Energy Total 47.9 70.4 59.9 50.5 Feb-21 May-21 Aug-21 Nov-21 Feb-22 May-22 Aug-22 Nov-22 Feb-23 May-23 Aug-23 Eurozone US