Stoxx 600 Index - Dividends and Implied Volatility Surface Parameters
•
1 like•793 views

Stoxx 600 Index - Dividends and Implied Volatility Surface Parameters

Recommended
Recommended
More Related Content
What's hot
What's hot (20)
Similar to Stoxx 600 Index - Dividends and Implied Volatility Surface Parameters
Similar to Stoxx 600 Index - Dividends and Implied Volatility Surface Parameters (20)
More from BCV
More from BCV (20)
Recently uploaded
Recently uploaded (20)
Stoxx 600 Index - Dividends and Implied Volatility Surface Parameters
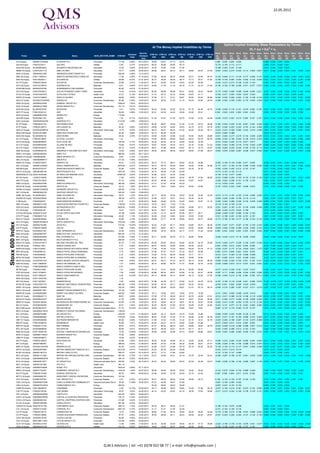
- 1. 22.05.2012 Option Implied Volatility Skew Parameters by Terms: At The Money Implied Volatilities by Terms 2 IVt = atx + btx + ct Next Ex- Skew Skew Skew Skew Skew Skew Skew Skew Skew Skew Skew Skew Skew Skew Dividend ATM Vol - ATM Vol - ATM Vol - ATM Vol - ATM Vol - ATM Vol - ATM Vol - Ticker ISIN Name GICS_SECTOR_NAME ATM Ref Dividend (a) - (a) - (a) - (a) - (a) - (a) - (a) - (b) - (b) - (b) - (b) - (b) - (b) - (b) - Yield 30D 60D 90D 6M 12M 18M 24M Date 30D 60D 90D 6M 12M 18M 24M 30D 60D 90D 6M 12M 18M 24M III LN Equity GB00B1YW4409 3I GROUP PLC Financials 171.90 5.06% 05.12.2012 30.99 29.07 27.15 25.75 0.083 0.055 0.026 -0.025 0.006 0.005 0.003 0.000 A2A IM Equity IT0001233417 A2A SPA Utilities 0.55 2.37% 24.06.2013 58.23 49.86 45.65 45.15 -0.175 -0.155 -0.112 -0.171 0.009 0.001 0.000 0.001 AALB NA Equity NL0000852564 AALBERTS INDUSTRIES NV Industrials 13.00 2.69% 29.04.2013 34.35 32.60 31.84 31.94 -0.188 -0.262 -0.241 -0.189 0.013 0.005 0.003 0.003 ABBN VX Equity CH0012221716 ABB LTD-REG Industrials 15.71 5.09% 29.04.2013 29.08 28.07 29.12 29.17 29.60 29.27 27.54 -0.257 -0.203 -0.210 -0.232 -0.113 -0.020 0.007 0.017 0.006 0.004 0.003 0.001 -0.001 -0.001 ADN LN Equity GB0000031285 ABERDEEN ASSET MGMT PLC Financials 239.00 4.48% 12.12.2012 ABE SQ Equity ES0111845014 ABERTIS INFRAESTRUCTURAS SA Industrials 11.06 3.26% 31.10.2012 27.69 26.64 26.23 25.88 25.21 24.94 24.75 -0.152 -0.094 -0.111 -0.124 -0.177 -0.049 -0.101 0.003 -0.001 0.000 -0.002 -0.001 -0.001 0.001 ANA SQ Equity ES0125220311 ACCIONA SA Utilities 46.68 6.43% 21.01.2013 40.31 39.26 39.38 38.17 31.71 35.31 31.52 -0.158 -0.100 -0.087 -0.202 -0.002 -0.123 -0.045 0.001 0.003 0.001 0.000 0.005 0.004 0.005 AC FP Equity FR0000120404 ACCOR SA Consumer Discretionary 25.89 2.51% 11.06.2013 44.31 43.85 43.04 42.83 40.26 40.09 -0.230 -0.213 -0.213 -0.196 -0.163 -0.144 0.005 0.001 0.001 0.002 0.002 0.003 ACX SQ Equity ES0132105018 ACERINOX SA Materials 8.61 5.46% 07.01.2013 34.65 31.78 31.18 30.18 31.31 32.12 31.40 -0.190 -0.182 -0.185 -0.258 -0.071 0.077 0.078 0.002 0.002 0.002 0.002 0.002 0.000 0.000 ACKB BB Equity BE0003764785 ACKERMANS & VAN HAAREN Financials 62.82 2.61% 31.05.2013 ACS SQ Equity ES0167050915 ACS ACTIVIDADES CONS Y SERV Industrials 14.23 14.43% 05.07.2012 60.25 56.68 56.56 52.41 49.62 49.33 49.99 -0.175 -0.005 -0.008 -0.006 -0.046 0.046 0.227 -0.001 0.002 0.000 0.002 0.002 0.002 0.002 ATLN VX Equity CH0010532478 ACTELION LTD-REG Health Care 37.27 2.15% 06.05.2013 41.73 40.13 42.33 40.98 40.87 41.11 -0.185 -0.071 -0.054 -0.054 -0.047 -0.024 0.006 0.001 0.001 0.001 0.000 0.000 ADEN VX Equity CH0012138605 ADECCO SA-REG Industrials 38.58 4.92% 03.05.2013 37.26 37.17 37.31 36.81 36.04 35.24 35.82 -0.345 -0.230 -0.204 -0.252 -0.162 -0.109 -0.135 0.016 0.001 0.002 0.003 0.002 0.001 0.002 ADS GY Equity DE000A1EWWW0 ADIDAS AG Consumer Discretionary 60.88 2.05% 10.05.2013 30.52 30.52 31.52 31.16 30.24 29.84 28.45 -0.398 -0.383 -0.336 -0.263 -0.175 -0.030 -0.048 0.022 0.008 0.006 0.003 0.002 0.001 0.002 ADM LN Equity GB00B02J6398 ADMIRAL GROUP PLC Financials 1098.00 7.60% 26.09.2012 AGS LN Equity GB00B4JV1B90 AEGIS GROUP PLC Consumer Discretionary 161.10 2.01% 05.09.2012 AGN NA Equity NL0000303709 AEGON NV Financials 3.41 5.87% 17.08.2012 55.44 52.94 52.92 50.18 47.16 44.04 42.70 -0.346 -0.289 -0.116 -0.101 -0.016 0.094 0.182 0.010 0.004 0.001 0.002 0.001 0.004 0.005 ADP FP Equity FR0010340141 ADP Industrials 59.40 2.98% 13.05.2013 24.21 24.38 24.43 24.66 25.40 25.41 0.043 -0.002 0.002 0.009 0.024 0.036 0.004 0.000 0.000 0.000 0.000 0.000 AFR LN Equity GB00B0672758 AFREN PLC Energy 114.60 AGS BB Equity BE0003801181 AGEAS Financials 1.34 6.71% 29.04.2013 51.44 47.87 51.35 50.75 47.09 43.22 42.40 -0.495 -0.270 -0.291 -0.215 0.028 0.167 0.187 0.019 0.005 0.009 0.005 0.002 0.003 0.004 AGK LN Equity GB00B4WQ2Z29 AGGREKO PLC Industrials 2110.00 1.09% 19.09.2012 AF FP Equity FR0000031122 AIR FRANCE-KLM Industrials 3.53 16.07.2013 55.35 55.67 54.02 51.36 51.03 55.72 48.46 -0.182 -0.202 -0.232 -0.163 -0.261 -0.381 -0.248 0.004 0.005 0.003 0.001 0.000 0.004 -0.002 AI FP Equity FR0000120073 AIR LIQUIDE SA Materials 94.33 2.86% 13.05.2013 24.68 24.35 24.80 24.83 24.75 23.73 22.76 -0.261 -0.246 -0.235 -0.243 -0.163 -0.144 -0.099 0.015 0.007 0.005 0.004 0.002 0.002 0.001 AIXA GY Equity DE000A0WMPJ6 AIXTRON SE Information Technology 12.70 0.55% 16.05.2013 48.72 49.91 49.42 47.50 49.20 50.22 50.11 -0.233 -0.233 -0.228 -0.260 -0.353 -0.419 -0.485 0.007 0.004 0.004 0.005 0.002 0.001 0.001 AKSO NO Equity NO0010215684 AKER SOLUTIONS ASA Energy 84.30 3.68% 19.04.2013 52.13 50.28 48.38 -0.674 -0.582 -0.488 0.019 0.015 0.011 AKZA NA Equity NL0000009132 AKZO NOBEL Materials 38.02 4.03% 25.10.2012 33.60 33.66 32.89 32.39 30.64 29.25 28.96 -0.331 -0.262 -0.217 -0.215 -0.134 -0.090 -0.050 0.014 0.004 0.003 0.002 0.001 0.001 0.001 ALU FP Equity FR0000130007 ALCATEL-LUCENT Information Technology 1.21 07.06.2013 75.84 69.83 69.90 68.26 64.03 60.78 60.78 -0.360 -0.320 -0.185 -0.204 -0.136 -0.074 -0.076 0.003 0.001 0.005 0.003 -0.001 0.000 -0.001 ALFA SS Equity SE0000695876 ALFA LAVAL AB Industrials 126.20 3.17% 29.04.2013 34.34 35.40 34.18 34.48 34.26 34.26 -0.312 -0.244 -0.222 -0.170 -0.071 -0.071 0.033 0.009 0.007 0.003 0.000 0.000 ALV GY Equity DE0008404005 ALLIANZ SE-REG Financials 76.99 5.97% 10.05.2013 33.67 34.06 34.33 34.31 34.16 33.09 31.32 -0.500 -0.442 -0.395 -0.318 -0.163 -0.092 -0.067 0.008 0.005 0.004 0.002 0.000 0.000 0.000 ALO FP Equity FR0010220475 ALSTOM Industrials 24.13 3.32% 27.06.2013 49.01 47.86 46.95 45.87 44.13 43.13 43.07 -0.350 -0.265 -0.235 -0.235 -0.160 -0.150 -0.112 0.013 0.004 0.001 0.003 0.001 0.000 -0.001 AMS SQ Equity EU0009658145 AMADEUS IT HOLDING SA-A SHS Information Technology 15.45 2.56% 30.01.2013 29.34 28.23 28.39 28.00 28.00 27.98 28.31 -0.063 -0.076 -0.055 -0.087 -0.038 -0.037 -0.002 0.001 0.000 0.001 0.000 -0.002 -0.001 -0.002 AMEC LN Equity GB0000282623 AMEC PLC Energy 988.00 3.23% 28.11.2012 AMEAS FH Equity FI0009000285 AMER SPORTS OYJ Consumer Discretionary 9.64 4.15% 11.03.2013 AML LN Equity GB00B2988H17 AMLIN PLC Financials 317.40 7.56% 05.09.2012 ANDR AV Equity AT0000730007 ANDRITZ AG Industrials 40.01 3.12% 25.03.2013 39.72 37.73 38.41 36.60 40.32 40.66 -0.062 -0.169 -0.139 -0.084 0.477 0.640 -0.002 0.001 0.001 -0.001 -0.004 -0.005 AAL LN Equity GB00B1XZS820 ANGLO AMERICAN PLC Materials 2070.50 2.51% 15.08.2012 40.12 40.19 40.09 39.97 39.35 35.98 35.28 -0.177 -0.211 -0.183 -0.140 -0.080 -0.036 -0.042 0.006 0.000 0.000 0.000 0.001 0.002 0.002 ABI BB Equity BE0003793107 ANHEUSER-BUSCH INBEV NV Consumer Staples 53.69 2.42% 24.04.2013 24.36 24.24 24.45 24.63 24.78 24.78 -0.292 -0.226 -0.202 -0.212 -0.157 -0.157 0.017 0.004 0.003 0.002 0.001 0.001 ANTO LN Equity GB0000456144 ANTOFAGASTA PLC Materials 1067.00 1.54% 12.09.2012 40.15 40.90 41.65 42.95 -0.174 -0.163 -0.152 -0.115 0.011 0.008 0.005 0.001 MAERSKB DC Equity DK0010244508 AP MOELLER-MAERSK A/S-B Industrials 37940.00 2.64% 15.04.2013 34.56 33.81 34.30 33.68 -0.149 -0.142 -0.071 -0.050 0.004 0.002 0.000 0.000 MT NA Equity LU0323134006 ARCELORMITTAL Materials 11.84 4.97% 22.02.2013 50.41 49.35 49.63 48.34 46.78 47.64 48.26 -0.274 -0.288 -0.250 -0.183 -0.124 -0.125 -0.124 0.007 0.002 0.002 0.002 0.001 -0.001 -0.001 AKE FP Equity FR0010313833 ARKEMA Materials 57.74 2.25% 31.05.2013 50.53 48.98 47.43 44.92 43.67 43.67 -0.309 -0.283 -0.258 -0.191 -0.155 -0.155 0.001 0.001 0.001 0.001 0.002 0.002 ARM LN Equity DE0005557508 ARM HOLDINGS PLC Information Technology 492.90 0.85% 05.09.2012 41.41 41.03 40.65 40.33 -0.112 -0.076 -0.041 0.010 0.008 0.005 0.002 -0.002 ARYN SE Equity CH0043238366 ARYZTA AG Consumer Staples 44.10 1.39% 28.01.2013 18.21 18.81 18.90 20.47 20.65 20.94 -0.197 -0.033 -0.032 -0.081 -0.090 -0.074 0.016 -0.001 0.000 0.000 0.001 0.000 ASHM LN Equity GB00B132NW22 ASHMORE GROUP PLC Financials 328.60 4.72% 31.10.2012 AHT LN Equity GB0000536739 ASHTEAD GROUP PLC Industrials 220.20 1.53% 15.08.2012 ASML NA Equity NL0006034001 ASML HOLDING NV Information Technology 36.57 1.37% 26.04.2013 32.71 35.05 33.40 32.93 32.42 32.20 32.42 -0.273 -0.174 -0.157 -0.183 -0.104 -0.080 -0.052 0.014 0.001 0.001 0.002 0.000 0.000 -0.001 ASSAB SS Equity SE0000255648 ASSA ABLOY AB-B Industrials 188.30 2.87% 02.05.2013 33.56 33.07 33.91 34.23 34.35 34.35 -0.264 -0.280 -0.264 -0.186 -0.116 -0.116 0.022 0.007 0.004 0.002 0.001 0.001 G IM Equity IT0000062072 ASSICURAZIONI GENERALI Financials 8.79 5.12% 20.05.2013 46.84 45.68 44.78 43.29 35.83 34.67 31.10 -0.380 -0.363 -0.299 -0.349 -0.102 -0.028 -0.009 0.009 0.004 0.002 0.005 0.000 -0.001 0.000 ABF LN Equity GB0006731235 ASSOCIATED BRITISH FOODS PLC Consumer Staples 1180.00 2.37% 05.12.2012 15.70 16.47 17.24 17.76 -0.119 -0.124 -0.129 -0.124 0.002 0.001 0.001 0.001 AZN LN Equity GB0009895292 ASTRAZENECA PLC Health Care 2629.00 6.99% 01.08.2012 19.44 19.75 20.60 20.89 20.84 20.17 20.02 -0.351 -0.261 -0.183 -0.181 -0.126 -0.069 -0.049 0.007 0.006 0.004 0.003 0.001 0.000 0.000 ATL IM Equity IT0003506190 ATLANTIA SPA Industrials 10.41 7.51% 19.11.2012 36.34 35.01 34.28 33.06 29.80 -0.399 -0.320 -0.310 -0.233 -0.158 0.010 0.004 0.003 0.002 0.001 ATCOA SS Equity SE0000101032 ATLAS COPCO AB-A SHS Industrials 151.80 3.46% 22.04.2013 41.62 41.14 40.70 63.28 36.71 36.71 -0.549 -0.208 -0.307 -0.080 -0.194 -0.194 0.014 -0.001 0.003 -0.001 0.003 0.003 ATO FP Equity FR0000051732 ATOS Information Technology 44.30 1.13% 13.06.2012 32.59 33.20 33.82 34.54 33.83 33.83 -0.191 -0.196 -0.201 -0.190 -0.181 -0.181 0.007 0.005 0.004 0.002 0.001 0.001 NDA GY Equity DE0006766504 AURUBIS AG Materials 40.09 3.12% 01.03.2013 26.89 27.17 27.29 28.59 28.53 28.77 28.80 -0.173 -0.160 -0.148 -0.177 -0.166 -0.153 -0.133 0.009 0.002 0.002 0.002 0.002 0.001 0.002 AVV LN Equity GB00B15CMQ74 AVEVA GROUP PLC Information Technology 1532.00 1.36% 20.06.2012 Stoxx 600 Index AV/ LN Equity GB0002162385 AVIVA PLC Financials 272.00 10.29% 19.09.2012 42.23 41.63 42.11 39.95 38.85 36.37 36.20 -0.376 -0.207 -0.271 -0.207 -0.155 -0.149 -0.182 0.000 0.004 0.000 0.001 0.000 0.000 0.001 CS FP Equity FR0000120628 AXA SA Financials 9.58 7.62% 06.05.2013 48.91 48.87 49.71 49.33 50.00 49.08 46.06 -0.600 -0.505 -0.426 -0.399 -0.242 -0.092 -0.163 0.013 0.000 0.000 0.002 0.001 -0.002 0.001 SPR GY Equity DE0005501357 AXEL SPRINGER AG Consumer Discretionary 33.55 5.22% 18.04.2013 30.68 30.33 30.29 30.17 31.81 31.46 32.94 0.055 0.024 0.029 0.025 0.033 0.036 -0.026 -0.001 0.000 0.000 -0.001 0.000 0.000 0.000 BAB LN Equity GB0009697037 BABCOCK INTL GROUP PLC Industrials 850.00 2.77% 12.12.2012 BA/ LN Equity GB0002634946 BAE SYSTEMS PLC Industrials 273.60 7.05% 17.10.2012 25.17 25.29 25.79 27.13 26.84 26.84 -0.246 -0.239 -0.213 -0.116 -0.095 -0.095 0.009 0.006 0.000 -0.001 -0.001 -0.001 BBY LN Equity GB0000961622 BALFOUR BEATTY PLC Industrials 268.00 5.37% 10.10.2012 BALN VX Equity CH0012410517 BALOISE HOLDING AG - REG Financials 63.15 7.13% 03.05.2013 25.59 25.50 25.52 26.06 26.35 24.16 22.80 -0.218 -0.292 -0.271 -0.236 -0.150 -0.057 -0.034 0.014 0.006 0.005 0.004 0.003 0.002 0.003 CRG IM Equity IT0003211601 BANCA CARIGE SPA Financials 0.73 9.58% 20.05.2013 55.07 54.62 54.60 55.00 54.50 60.57 0.042 0.003 0.010 0.032 0.036 0.049 -0.001 0.000 0.000 0.000 0.000 0.001 BMPS IM Equity IT0001334587 BANCA MONTE DEI PASCHI SIENA Financials 0.23 3.51% 20.05.2013 77.46 75.29 73.24 69.83 59.25 53.76 41.14 -0.326 -0.237 -0.177 -0.124 -0.620 -0.931 -1.477 0.007 0.006 0.003 0.000 0.012 0.019 0.031 BPE IM Equity IT0000066123 BANCA POPOL EMILIA ROMAGNA Financials 3.73 3.96% 22.04.2013 57.69 57.57 57.51 57.22 59.37 59.00 0.056 0.014 0.008 0.023 0.034 0.053 -0.003 -0.001 0.000 0.000 0.001 0.001 PMI IM Equity IT0000064482 BANCA POPOLARE DI MILANO Financials 0.37 4.06% 20.05.2013 72.36 70.78 69.04 69.38 70.11 70.11 -0.312 -0.311 -0.393 -0.133 -0.096 -0.096 0.007 0.001 0.002 0.003 0.001 0.001 BPSO IM Equity IT0000784196 BANCA POPOLARE DI SONDRIO Financials 4.43 3.39% 22.04.2013 38.40 38.15 38.18 38.34 39.95 39.92 0.007 0.009 0.010 0.023 -0.028 -0.042 -0.001 -0.001 0.000 -0.001 0.000 -0.001 BBVA SQ Equity US78378X1072 BANCO BILBAO VIZCAYA ARGENTA Financials 4.94 8.49% 09.07.2012 64.07 59.21 57.23 52.73 46.13 42.25 38.30 -0.406 -0.236 -0.229 -0.162 0.031 0.190 0.191 0.003 0.005 0.004 0.001 -0.002 -0.002 -0.001 SAB SQ Equity ES0113860A34 BANCO DE SABADELL SA Financials 1.51 6.88% 04.09.2012 48.16 48.80 46.79 41.47 38.59 32.76 33.02 -0.438 -0.608 -0.610 -0.213 0.070 0.223 0.382 0.001 0.000 0.004 0.000 0.001 0.003 0.003 BES PL Equity PTBES0AM0007 BANCO ESPIRITO SANTO-REG Financials 0.51 08.04.2013 BP IM Equity IT0004231566 BANCO POPOLARE SCARL Financials 1.01 2.96% 20.05.2013 76.10 73.41 69.59 68.16 66.58 66.58 -0.277 -0.316 -0.239 -0.301 -0.337 -0.337 0.006 0.001 0.001 0.001 0.003 0.003 POP SQ Equity ES0113790531 BANCO POPULAR ESPANOL Financials 1.93 6.48% 27.06.2012 63.88 60.45 58.07 54.99 51.35 50.37 49.09 -0.297 -0.111 -0.085 -0.206 -0.354 -0.394 -0.394 0.003 0.001 0.002 0.002 0.002 0.003 0.003 SAN SQ Equity ES0113900J37 BANCO SANTANDER SA Financials 4.55 13.20% 30.07.2012 64.14 58.68 53.14 49.68 42.13 34.92 27.05 -0.399 -0.400 -0.212 -0.192 0.094 0.252 0.512 0.000 0.003 0.001 0.001 -0.001 0.000 0.003 BKIA SQ Equity ES0113307039 BANKIA SA Financials 1.72 BKT SQ Equity ES0113679I37 BANKINTER SA Financials 3.02 6.04% 02.07.2012 57.98 54.38 53.17 47.62 44.27 42.78 43.33 -0.187 -0.185 -0.119 -0.048 0.021 0.068 0.078 -0.002 -0.002 -0.001 -0.002 -0.002 -0.002 -0.002 BCVN SE Equity CH0015251710 BANQUE CANTONALE VAUDOIS-REG Financials 480.25 4.79% 07.05.2013 24.93 25.16 25.11 25.05 26.32 26.32 -0.033 0.001 0.004 -0.005 -0.043 -0.020 0.001 0.000 0.000 0.000 0.001 0.000 BARC LN Equity GB0031348658 BARCLAYS PLC Financials 182.45 3.86% 08.08.2012 59.82 58.68 59.28 56.81 51.81 50.10 49.15 -0.449 -0.316 -0.280 -0.297 -0.227 -0.211 -0.219 0.007 -0.002 0.001 0.001 0.002 0.003 0.003 BDEV LN Equity GB0000811801 BARRATT DEVELOPMENTS PLC Consumer Discretionary 121.50 1.23% 24.10.2012 BARN SE Equity CH0009002962 BARRY CALLEBAUT AG-REG Consumer Staples 845.00 1.95% 27.02.2013 19.11 18.90 18.91 19.00 19.72 19.38 -0.101 -0.001 -0.003 -0.008 -0.033 -0.018 0.008 0.000 0.000 0.001 0.001 0.001 BAS GY Equity DE000BASF111 BASF SE Materials 58.07 4.48% 29.04.2013 27.08 27.79 28.35 29.18 29.70 29.09 27.91 -0.512 -0.417 -0.396 -0.318 -0.188 -0.119 -0.030 0.018 0.008 0.007 0.004 0.002 0.001 -0.001 BAYN GY Equity DE000BAY0017 BAYER AG-REG Health Care 51.70 3.39% 29.04.2013 29.54 29.75 30.43 30.57 30.61 30.24 29.38 -0.311 -0.350 -0.317 -0.259 -0.159 -0.089 -0.053 0.021 0.009 0.006 0.003 0.001 -0.001 -0.001 BMW GY Equity DE0005190003 BAYERISCHE MOTOREN WERKE AG Consumer Discretionary 63.05 4.12% 15.05.2013 39.75 39.84 40.16 39.61 38.19 36.87 33.48 -0.502 -0.412 -0.381 -0.292 -0.183 -0.115 -0.104 0.012 0.005 0.004 0.002 0.001 0.001 0.002 BEI GY Equity DE0005200000 BEIERSDORF AG Consumer Staples 52.01 1.54% 29.04.2013 30.25 28.30 27.90 26.70 24.06 23.35 22.93 -0.223 -0.121 -0.077 -0.116 -0.091 -0.082 -0.067 0.014 0.003 0.001 0.003 0.003 0.003 0.004 BELG BB Equity BE0003810273 BELGACOM SA Telecommunication Services 21.75 10.02% 04.12.2012 22.62 21.84 21.31 19.95 19.67 19.67 -0.067 -0.137 -0.175 -0.093 -0.127 -0.127 0.019 0.003 0.001 0.000 0.001 0.001 BKG LN Equity GB00B02L3W35 BERKELEY GROUP HOLDINGS Consumer Discretionary 1188.00 BG/ LN Equity GB0008762899 BG GROUP PLC Energy 1264.00 1.31% 01.08.2012 32.65 32.13 32.49 33.75 33.90 33.90 -0.468 -0.300 -0.243 -0.208 -0.190 -0.190 0.012 0.008 0.004 0.002 0.002 0.002 BLT LN Equity GB0000566504 BHP BILLITON PLC Materials 1753.50 4.23% 05.09.2012 38.03 37.60 37.45 37.14 36.88 33.36 32.78 -0.337 -0.217 -0.191 -0.184 -0.096 -0.074 -0.045 0.011 0.001 0.002 0.001 0.000 0.000 -0.001 GBF GY Equity DE0005909006 BILFINGER BERGER SE Industrials 66.00 3.94% 10.05.2013 31.85 31.04 31.35 31.22 32.16 32.31 32.18 -0.325 -0.200 -0.196 -0.207 -0.123 -0.076 -0.089 0.019 0.004 0.003 0.003 0.002 0.001 0.001 BIM FP Equity FR0010096479 BIOMERIEUX Health Care 64.99 1.51% 03.06.2013 24.44 24.27 24.14 23.95 23.80 23.96 -0.073 -0.005 0.014 0.018 0.020 0.029 0.010 0.000 0.000 0.000 0.001 0.001 BNP FP Equity FR0000131104 BNP PARIBAS Financials 26.87 4.47% 30.05.2013 57.01 56.24 56.53 54.91 48.86 48.87 45.75 -0.432 -0.458 -0.418 -0.399 -0.289 -0.201 -0.212 0.010 0.002 0.001 0.002 0.002 0.001 0.001 BOL SS Equity SE0000869646 BOLIDEN AB Materials 96.65 4.91% 06.05.2013 46.57 46.40 44.91 44.74 44.11 44.11 -0.253 -0.405 -0.298 -0.212 -0.163 -0.163 0.024 0.009 0.006 0.002 0.001 0.001 BME SQ Equity ES0115056139 BOLSAS Y MERCADOS ESPANOLES Financials 15.30 10.46% 14.09.2012 24.06 24.68 24.68 23.73 28.05 26.88 29.57 -0.034 -0.043 -0.064 -0.085 -0.005 0.105 0.070 0.001 0.000 -0.001 0.001 -0.001 -0.001 -0.001 BOK LN Equity GB00B01TND91 BOOKER GROUP PLC Consumer Staples 73.25 2.98% 06.06.2012 GBB FP Equity FR0004548873 BOURBON SA Energy 19.54 4.20% 04.06.2012 EN FP Equity FR0000120503 BOUYGUES SA Industrials 20.88 7.66% 30.04.2013 36.02 35.26 34.88 35.12 33.65 28.90 27.71 -0.280 -0.270 -0.254 -0.232 -0.065 0.044 0.066 0.011 0.004 0.005 0.002 0.001 0.001 0.001 BP/ LN Equity GB0007980591 BP PLC Energy 399.05 5.40% 01.08.2012 26.58 27.04 27.98 28.32 28.46 28.51 27.51 -0.365 -0.248 -0.185 -0.165 -0.088 -0.072 -0.053 0.010 0.005 0.003 0.003 0.000 0.000 -0.001 BNR GY Equity DE000A1DAHH0 BRENNTAG AG Industrials 90.24 2.22% 20.06.2013 22.96 23.57 23.96 25.18 25.15 26.42 25.35 -0.149 -0.154 -0.115 -0.137 -0.051 -0.068 -0.008 0.013 0.001 0.001 0.002 0.001 0.001 0.001 BATS LN Equity GB0002875804 BRITISH AMERICAN TOBACCO PLC Consumer Staples 3015.50 4.61% 15.08.2012 20.23 20.35 20.29 20.88 -0.443 -0.213 -0.213 -0.214 0.014 0.011 0.004 0.004 BLND LN Equity GB0001367019 BRITISH LAND CO PLC Financials 495.70 5.33% 03.10.2012 20.31 21.13 21.68 22.82 -0.157 -0.145 -0.131 -0.066 0.009 0.007 0.005 0.001 BSY LN Equity GB0001411924 BRITISH SKY BROADCASTING GRO Consumer Discretionary 691.50 3.70% 14.11.2012 23.51 23.65 24.31 24.19 23.78 22.45 22.41 -0.395 -0.257 -0.156 -0.167 -0.061 -0.039 -0.046 0.010 0.006 0.003 0.002 0.001 -0.001 -0.002 BVIC LN Equity GB00B0N8QD54 BRITVIC PLC Consumer Staples 344.10 5.35% 06.06.2012 BT/A LN Equity GB0030913577 BT GROUP PLC Telecommunication Services 205.90 4.23% 26.12.2012 25.03 25.32 26.66 26.42 25.32 24.38 23.47 -0.365 -0.228 -0.156 -0.194 -0.082 -0.087 -0.100 0.009 0.002 0.001 0.002 0.001 0.002 0.002 BGC LN Equity GB0001001592 BTG PLC Health Care 361.10 BNZL LN Equity GB00B0744B38 BUNZL PLC Industrials 1005.00 2.66% 07.11.2012 BRBY LN Equity GB0031743007 BURBERRY GROUP PLC Consumer Discretionary 1400.00 1.84% 04.07.2012 36.09 35.60 36.05 35.00 34.92 35.49 -0.142 -0.072 -0.044 -0.102 -0.068 -0.048 0.000 0.000 0.001 0.000 -0.001 -0.003 BVI FP Equity FR0006174348 BUREAU VERITAS SA Industrials 66.70 1.90% 06.06.2013 23.48 23.46 23.30 23.49 23.10 23.24 0.097 0.006 0.004 0.017 0.019 0.032 0.007 0.000 0.000 0.000 0.000 0.001 BPTY LN Equity GI000A0MV757 BWIN.PARTY DIGITAL ENTERTAIN Consumer Discretionary 127.40 GCC ID Equity IE00B010DT83 C&C GROUP PLC Consumer Staples 3.47 2.42% 24.10.2012 29.31 29.02 28.45 27.95 28.50 29.12 0.163 -0.122 -0.132 -0.187 -0.184 -0.185 0.019 0.004 0.001 0.002 0.001 0.001 CWC LN Equity GB00B5KKT968 CABLE & WIRELESS COMMUNICATI Telecommunication Services 28.36 17.88% 30.05.2012 47.51 43.99 40.47 37.99 -0.097 -0.190 -0.283 -0.242 -0.001 0.001 0.004 0.002 CNE LN Equity GB00B74CDH82 CAIRN ENERGY PLC Energy 295.20 40.35 38.64 36.93 35.58 -0.297 -0.227 -0.157 -0.153 0.005 0.004 0.003 0.000 CABK SQ Equity ES0140609019 CAIXABANK Financials 2.26 10.19% 26.06.2012 45.71 39.85 39.53 36.80 33.45 31.06 29.16 -0.237 -0.146 -0.214 -0.361 -0.073 0.120 0.086 -0.002 0.002 0.001 0.002 0.001 0.000 0.001 CAP FP Equity FR0000125338 CAP GEMINI Information Technology 28.57 3.50% 04.06.2013 44.14 43.22 43.63 42.18 38.38 37.83 36.96 -0.217 -0.215 -0.224 -0.189 -0.156 -0.129 -0.121 0.009 0.005 0.003 0.002 0.002 0.003 0.004 CPI LN Equity GB00B23K0M20 CAPITA PLC Industrials 623.50 3.85% 29.08.2012 CAPC LN Equity GB00B62G9D36 CAPITAL & COUNTIES PROPERTIE Financials 190.10 0.79% 22.08.2012 CSCG LN Equity GB0006834344 CAPITAL SHOPPING CENTRES GRO Financials 313.90 4.82% 10.10.2012 CLLN LN Equity GB0007365546 CARILLION PLC Industrials 261.80 6.53% 05.09.2012 CARLB DC Equity DK0010181759 CARLSBERG AS-B Consumer Staples 455.10 1.32% 25.03.2013 29.33 29.01 30.62 31.47 -0.199 -0.124 -0.072 -0.038 0.004 0.001 0.001 0.000 CCL LN Equity GB0031215220 CARNIVAL PLC Consumer Discretionary 2061.00 4.15% 22.08.2012 31.17 31.41 31.64 32.28 -0.101 -0.120 -0.140 -0.134 0.003 0.002 0.002 0.001 CA FP Equity FR0000120172 CARREFOUR SA Consumer Staples 13.74 3.78% 20.06.2012 39.82 41.03 39.70 39.24 36.24 36.06 34.56 -0.179 -0.166 -0.212 -0.186 -0.047 -0.068 0.024 0.020 0.005 0.005 0.002 -0.002 -0.002 -0.005 CO FP Equity FR0000125585 CASINO GUICHARD PERRACHON Consumer Staples 67.37 4.90% 18.04.2013 30.83 28.92 29.11 28.43 26.09 24.20 25.07 -0.337 -0.224 -0.228 -0.204 -0.127 -0.122 -0.105 0.008 0.006 0.003 0.003 0.002 0.002 0.000 CAST SS Equity SE0000379190 CASTELLUM AB Financials 84.90 4.59% 29.03.2013 CGL LN Equity BMG196F11004 CATLIN GROUP LTD Financials 412.90 6.90% 22.08.2012 CLS1 GY Equity DE000CLS1001 CELESIO AG Health Care 11.90 3.36% 17.05.2013 34.16 33.98 34.93 35.54 35.19 37.12 35.89 -0.223 -0.196 -0.176 -0.153 -0.076 -0.041 -0.017 0.012 0.003 0.004 0.002 0.000 -0.002 -0.002 CNA LN Equity GB00B033F229 CENTRICA PLC Utilities 312.10 5.22% 26.09.2012 19.54 19.80 20.07 20.49 20.39 20.39 -0.183 -0.195 -0.207 -0.188 -0.167 -0.167 0.005 0.005 0.005 0.004 0.004 0.004 Q.M.S Advisors | tel: +41 (0)78 922 08 77 | e-mail: info@qmsadv.com |
- 2. 22.05.2012 Option Implied Volatility Skew Parameters by Terms: At The Money Implied Volatilities by Terms IVt = atx + btx2 + ct Next Ex- Skew Skew Skew Skew Skew Skew Skew Skew Skew Skew Skew Skew Skew Skew Dividend ATM Vol - ATM Vol - ATM Vol - ATM Vol - ATM Vol - ATM Vol - ATM Vol - Ticker ISIN Name GICS_SECTOR_NAME ATM Ref Dividend (a) - (a) - (a) - (a) - (a) - (a) - (a) - (b) - (b) - (b) - (b) - (b) - (b) - (b) - Yield 30D 60D 90D 6M 12M 18M 24M Date 30D 60D 90D 6M 12M 18M 24M 30D 60D 90D 6M 12M 18M 24M CHG LN Equity GB00B45C9X44 CHEMRING GROUP PLC Industrials 318.50 5.68% 11.07.2012 CHR DC Equity DK0060227585 CHR HANSEN HOLDING A/S Materials 163.20 CDI FP Equity FR0000130403 CHRISTIAN DIOR Consumer Discretionary 110.30 2.28% 29.11.2012 29.50 29.09 28.67 27.62 28.72 28.72 -0.338 -0.331 -0.324 -0.286 -0.270 -0.270 0.008 0.007 0.006 0.004 0.004 0.004 SGO FP Equity FR0000125007 COMPAGNIE DE SAINT-GOBAIN Industrials 30.42 4.08% 10.06.2013 42.27 42.95 43.49 43.24 39.53 38.19 36.55 -0.304 -0.283 -0.270 -0.217 -0.136 -0.110 -0.098 0.013 0.005 0.003 0.002 0.001 0.000 0.000 CFR VX Equity CH0045039655 CIE FINANCIERE RICHEMON-BR A Consumer Discretionary 58.10 0.95% 09.09.2013 31.41 31.40 31.00 31.67 31.70 31.24 -0.417 -0.266 -0.206 -0.243 -0.200 -0.153 0.012 0.004 0.003 0.003 0.002 0.001 GA FP Equity FR0000120164 CIE GENERALE DE GEOPHYSIQUE Energy 18.67 43.24 40.71 41.28 42.28 42.95 42.78 -0.319 -0.275 -0.188 -0.220 -0.177 -0.165 0.001 0.000 0.003 0.002 0.002 0.002 ML FP Equity FR0000121261 MICHELIN (CGDE) Consumer Discretionary 50.36 4.57% 14.05.2013 39.23 39.33 40.36 39.42 37.17 34.83 -0.474 -0.288 -0.277 -0.250 -0.163 -0.130 0.006 0.003 0.001 0.002 0.002 0.002 CLN VX Equity CH0012142631 CLARIANT AG-REG Materials 10.47 2.87% 28.06.2013 37.69 36.70 37.91 38.65 39.04 36.58 36.69 -0.089 -0.240 -0.238 -0.218 -0.209 -0.129 -0.159 0.023 0.009 0.004 0.003 0.000 0.002 0.002 CBG LN Equity GB0007668071 CLOSE BROTHERS GROUP PLC Financials 695.50 6.18% 10.10.2012 CNP FP Equity FR0000120222 CNP ASSURANCES Financials 9.47 16.26% 11.06.2012 38.67 38.07 37.48 36.13 35.31 35.31 -0.177 -0.205 -0.233 -0.274 -0.256 -0.256 0.014 0.010 0.007 0.003 0.002 0.002 COB LN Equity GB00B07KD360 COBHAM PLC Industrials 223.10 3.59% 10.10.2012 EEEK GA Equity GRS104003009 COCA-COLA HELLENIC BOTTLING Consumer Staples 12.78 2.66% 25.06.2013 COFB BB Equity BE0003593044 COFINIMMO Financials 85.20 7.63% 29.04.2013 22.14 21.86 21.77 21.55 23.61 23.69 0.042 0.006 0.009 0.014 0.032 0.045 0.006 0.000 0.000 0.000 0.000 0.000 COLOB DC Equity DK0010309657 COLOPLAST-B Health Care 1016.00 1.57% 12.12.2012 COLR BB Equity BE0974256852 COLRUYT SA Consumer Staples 31.36 2.97% 01.10.2012 23.90 23.68 23.77 23.77 24.12 24.12 -0.128 -0.096 -0.073 -0.065 -0.037 -0.037 0.017 0.002 0.001 0.002 0.001 0.001 CBK GY Equity DE0008032004 COMMERZBANK AG Financials 1.44 24.05.2013 58.08 55.40 55.73 55.44 54.26 52.57 50.14 -0.412 -0.411 -0.343 -0.230 -0.192 -0.176 -0.116 0.008 0.004 0.004 0.002 0.001 0.001 0.001 CPG LN Equity GB0005331532 COMPASS GROUP PLC Consumer Discretionary 631.50 3.37% 23.01.2013 18.84 19.64 20.20 21.31 21.61 21.61 -0.251 -0.243 -0.232 -0.192 -0.176 -0.176 0.007 0.006 0.006 0.004 0.003 0.003 CON GY Equity DE0005439004 CONTINENTAL AG Consumer Discretionary 69.74 2.87% 16.05.2013 41.41 40.96 41.17 41.13 40.52 40.94 41.27 -0.439 -0.294 -0.248 -0.248 -0.131 -0.077 -0.050 0.012 0.004 0.004 0.003 0.001 0.000 -0.001 CKSN LN Equity GB00B3WK5475 COOKSON GROUP PLC Industrials 659.00 3.58% 12.09.2012 CORA NA Equity NL0000288967 CORIO NV Financials 33.13 8.51% 29.04.2013 28.28 27.67 27.89 28.10 27.55 27.55 27.55 -0.398 -0.284 -0.229 -0.201 -0.157 -0.157 -0.157 0.018 0.004 0.004 0.001 0.000 0.000 0.000 ACA FP Equity FR0000045072 CREDIT AGRICOLE SA Financials 3.09 27.05.2013 76.60 72.11 72.92 67.43 59.36 59.46 54.46 -0.484 -0.486 -0.397 -0.332 -0.273 -0.211 -0.251 0.000 0.003 0.003 0.003 0.002 0.002 0.002 CSGN VX Equity CH0012138530 CREDIT SUISSE GROUP AG-REG Financials 18.94 3.96% 09.05.2013 42.49 41.98 42.01 41.42 40.49 38.23 36.19 -0.240 -0.316 -0.311 -0.269 -0.189 -0.111 -0.051 0.015 0.006 0.004 0.003 0.001 0.001 0.002 CRH ID Equity IE0001827041 CRH PLC Materials 14.13 4.58% 29.08.2012 38.52 36.43 36.48 37.09 36.34 37.59 -0.406 -0.179 -0.184 -0.159 -0.031 -0.022 0.006 0.002 0.002 0.001 -0.002 -0.004 CRDA LN Equity GB0002335270 CRODA INTERNATIONAL PLC Materials 2196.00 2.74% 29.08.2012 CSM NA Equity NL0000852549 CSM Consumer Staples 13.23 6.05% 03.05.2013 37.78 35.95 36.29 34.71 34.77 34.77 34.77 -0.080 -0.089 -0.095 -0.076 -0.066 -0.066 -0.066 0.014 0.002 0.005 0.002 0.002 0.002 0.002 DMGT LN Equity GB0009457366 DAILY MAIL&GENERAL TST-A NV Consumer Discretionary 401.80 4.48% 06.06.2012 DAI GY Equity DE0007100000 DAIMLER AG-REGISTERED SHARES Consumer Discretionary 38.11 5.77% 11.04.2013 39.54 39.88 40.11 39.69 38.54 36.80 35.77 -0.569 -0.486 -0.428 -0.342 -0.212 -0.131 -0.102 0.016 0.007 0.005 0.003 0.002 0.002 0.002 BN FP Equity FR0000120644 DANONE Consumer Staples 51.51 2.91% 07.05.2013 24.98 25.04 25.95 25.82 25.41 23.57 21.93 -0.453 -0.289 -0.255 -0.243 -0.166 -0.132 -0.108 0.021 0.005 0.003 0.003 0.002 0.001 0.001 DANSKE DC EquityDK0010274414 DANSKE BANK A/S Financials 82.25 3.65% 19.03.2013 42.03 42.58 41.53 39.66 -0.220 -0.181 -0.171 -0.127 0.019 0.000 0.005 0.001 DSY FP Equity FR0000130650 DASSAULT SYSTEMES SA Information Technology 70.89 0.99% 14.06.2012 23.41 24.16 24.91 25.81 25.83 25.83 -0.188 -0.213 -0.239 -0.239 -0.181 -0.181 0.013 0.011 0.008 0.003 0.002 0.002 CPR IM Equity IT0003849244 DAVIDE CAMPARI-MILANO SPA Consumer Staples 5.21 1.44% 20.05.2013 24.47 24.49 24.58 24.81 24.50 24.61 0.049 0.013 0.012 0.016 0.031 0.040 0.002 0.000 0.000 -0.001 0.000 0.000 DCC ID Equity IE0002424939 DCC PLC Industrials 19.70 6.91% 14.11.2012 19.70 19.27 19.56 20.16 20.62 20.21 0.000 0.029 -0.084 -0.233 -0.182 -0.100 0.032 0.015 0.006 0.002 0.002 0.002 DEB LN Equity GB00B126KH97 DEBENHAMS PLC Consumer Discretionary 74.10 4.18% 05.12.2012 DELB BB Equity BE0003562700 DELHAIZE GROUP Consumer Staples 30.94 5.69% 29.05.2013 25.08 26.22 26.94 29.39 28.21 28.21 0.096 0.031 0.007 -0.034 -0.053 -0.053 0.014 0.006 0.002 0.003 0.002 0.002 DL NA Equity NL0009294552 DELTA LLOYD NV Financials 11.18 9.31% 13.08.2012 39.20 38.11 37.29 38.01 37.91 37.91 -0.133 -0.135 -0.008 -0.020 -0.024 -0.024 0.013 0.002 0.002 -0.001 -0.001 -0.001 DLN LN Equity GB0002652740 DERWENT LONDON PLC Financials 1726.00 1.89% 26.09.2012 DBK GY Equity DE0005140008 DEUTSCHE BANK AG-REGISTERED Financials 29.07 2.58% 03.06.2013 44.11 43.83 44.35 44.47 41.90 43.00 38.27 -0.374 -0.416 -0.376 -0.315 -0.196 -0.163 -0.067 0.012 0.006 0.004 0.002 0.000 0.000 0.002 DB1 GY Equity DE0005810055 DEUTSCHE BOERSE AG Financials 40.49 5.93% 16.05.2013 35.21 34.60 34.46 33.96 33.40 31.23 29.28 -0.329 -0.223 -0.171 -0.187 -0.122 -0.067 -0.075 0.007 0.004 0.002 0.003 0.001 0.001 0.001 DEQ GY Equity DE0007480204 DEUTSCHE EUROSHOP AG Financials 28.91 3.81% 21.06.2013 16.79 17.11 17.20 16.54 16.28 16.45 12.62 -0.216 -0.063 -0.063 -0.075 -0.059 -0.056 0.043 0.025 0.008 0.003 0.003 0.003 0.004 0.008 LHA GY Equity DE0008232125 DEUTSCHE LUFTHANSA-REG Industrials 8.73 3.44% 10.05.2013 37.99 37.59 37.63 36.36 35.64 34.09 32.16 -0.417 -0.388 -0.324 -0.270 -0.161 -0.101 -0.045 0.016 0.007 0.004 0.003 0.002 0.002 0.003 DPW GY Equity DE0005552004 DEUTSCHE POST AG-REG Industrials 13.23 5.44% 10.05.2013 28.93 28.67 29.18 29.07 28.56 27.63 25.11 -0.385 -0.387 -0.387 -0.314 -0.174 -0.110 -0.047 0.023 0.010 0.006 0.004 0.001 0.001 0.001 DTE GY Equity DE0005557508 DEUTSCHE TELEKOM AG-REG Telecommunication Services 8.90 7.87% 24.05.2013 21.21 21.18 21.94 20.42 19.74 22.14 15.85 0.470 0.156 0.009 -0.074 -0.008 0.000 0.164 0.030 0.015 0.007 0.005 0.001 0.002 0.005 DGE LN Equity GB0002374006 DIAGEO PLC Consumer Staples 1507.50 2.99% 05.09.2012 20.76 20.90 20.88 21.26 21.46 20.23 19.49 -0.465 -0.300 -0.267 -0.233 -0.153 -0.075 -0.048 0.013 0.006 0.004 0.004 0.002 0.003 0.003 DIA SQ Equity ES0126775032 DISTRIBUIDORA INTERNACIONAL Consumer Staples 3.68 37.09 34.61 35.83 32.98 32.24 31.78 31.65 -0.206 -0.541 -0.436 -0.365 -0.392 -0.542 -0.520 0.001 0.005 0.004 0.002 0.003 0.004 0.004 DNB NO Equity NO0010031479 DNB ASA Financials 57.40 3.48% 26.04.2013 38.80 39.50 42.24 38.75 -0.392 -0.338 -0.358 -0.340 0.043 0.021 0.002 0.003 DRX LN Equity GB00B1VNSX38 DRAX GROUP PLC Utilities 557.00 4.63% 26.09.2012 SMDS LN Equity GB0008220112 DS SMITH PLC Materials 149.00 4.04% 08.08.2012 DSV DC Equity DK0060079531 DSV A/S Industrials 119.60 1.05% 18.03.2013 31.72 34.46 34.83 33.94 -0.219 -0.281 -0.182 -0.118 0.020 0.004 0.000 0.001 DUFN SE Equity CH0023405456 DUFRY AG-REG Consumer Discretionary 113.40 16.05.2013 33.17 33.00 32.95 32.99 33.17 33.24 -0.053 -0.007 0.005 -0.002 -0.049 -0.057 0.001 0.000 0.000 0.000 0.000 0.000 EOAN GY Equity DE000ENAG999 E.ON AG Utilities 15.39 7.15% 03.05.2013 29.54 29.88 30.50 30.34 30.16 29.18 27.32 -0.388 -0.464 -0.385 -0.305 -0.158 -0.077 0.092 0.020 0.007 0.005 0.004 0.002 0.001 -0.002 EAD FP Equity NL0000235190 EADS NV Industrials 28.29 1.59% 04.06.2013 33.24 33.78 34.49 34.74 32.30 30.71 31.08 -0.165 -0.180 -0.179 -0.180 -0.131 -0.081 -0.042 0.012 0.005 0.003 0.002 0.002 0.000 -0.001 EZJ LN Equity GB00B7KR2P84 EASYJET PLC Industrials 495.00 1.98% 28.02.2013 EBRO SQ Equity ES0112501012 EBRO FOODS SA Consumer Staples 12.65 3.71% 11.01.2013 29.20 28.78 28.69 28.39 27.42 27.17 26.79 -0.099 -0.100 -0.103 -0.102 -0.018 -0.053 -0.018 0.001 0.001 0.000 0.000 0.002 0.001 0.002 EDEN FP Equity FR0010908533 EDENRED Industrials 21.78 3.21% 27.05.2013 23.51 25.24 25.35 27.51 27.46 28.35 0.108 -0.084 -0.069 -0.199 -0.152 -0.133 0.017 -0.001 0.000 0.001 0.000 0.000 EDP PL Equity PTEDP0AM0009 EDP-ENERGIAS DE PORTUGAL SA Utilities 1.85 11.06% 10.05.2013 Stoxx 600 Index FGR FP Equity FR0000130452 EIFFAGE Industrials 25.13 4.78% 26.04.2013 60.55 60.11 59.93 59.91 62.42 62.01 0.001 -0.002 0.023 0.019 0.011 0.026 0.000 0.000 0.000 0.000 0.001 0.002 ELN ID Equity IE0003072950 ELAN CORP PLC Health Care 10.42 35.70 35.60 36.30 35.83 35.70 35.41 -0.140 -0.063 -0.074 -0.087 -0.056 -0.054 0.008 0.001 0.001 0.001 0.001 0.002 EDF FP Equity FR0010242511 EDF Utilities 15.65 7.35% 13.12.2012 33.77 32.75 33.21 30.94 29.54 28.80 30.59 -0.186 -0.241 -0.258 -0.210 -0.115 -0.144 -0.073 0.016 0.007 0.005 0.003 0.001 0.001 -0.001 ECM LN Equity GB0003096442 ELECTROCOMPONENTS PLC Information Technology 210.60 5.70% 20.06.2012 ELUXB SS Equity SE0000103814 ELECTROLUX AB-SER B Consumer Discretionary 137.60 4.72% 03.04.2013 42.83 43.39 43.09 41.52 40.56 40.56 -0.369 -0.349 -0.298 -0.215 -0.162 -0.162 0.012 0.001 0.002 0.003 0.001 0.001 EKTAB SS Equity SE0000163628 ELEKTA AB-B SHS Health Care 343.80 1.25% 05.09.2012 ELI1V FH Equity FI0009007884 ELISA OYJ Telecommunication Services 16.30 7.98% 05.04.2013 22.48 23.26 23.06 23.12 -0.075 -0.180 -0.176 -0.165 0.019 0.004 0.003 0.002 ENG SQ Equity ES0130960018 ENAGAS SA Utilities 13.17 7.80% 21.12.2012 27.79 27.67 27.13 25.46 26.78 25.92 26.53 -0.042 0.005 -0.016 -0.073 0.091 0.062 0.114 0.000 0.000 0.000 0.002 0.001 0.001 0.001 ELE SQ Equity ES0130670112 ENDESA SA Utilities 13.01 8.50% 02.07.2012 37.37 37.04 36.75 34.55 33.07 32.08 32.48 -0.007 0.104 0.107 0.036 0.089 0.064 0.086 -0.001 -0.001 0.000 0.000 0.000 0.000 0.000 EGPW IM Equity IT0004618465 ENEL GREEN POWER SPA Utilities 1.21 2.35% 20.05.2013 33.21 34.09 34.16 35.08 35.98 35.98 -0.698 -0.387 -0.311 -0.143 -0.071 -0.071 0.041 0.019 0.004 0.000 0.000 0.000 ENEL IM Equity IT0003128367 ENEL SPA Utilities 2.38 6.72% 24.06.2013 36.63 33.56 33.12 31.81 30.58 29.54 29.12 -0.371 -0.148 -0.250 -0.213 -0.036 0.024 0.023 0.026 0.005 0.004 0.003 0.000 0.000 0.000 ENI IM Equity IT0003132476 ENI SPA Energy 15.78 6.72% 24.09.2012 32.26 31.17 30.94 30.72 26.92 26.30 24.87 -0.388 -0.396 -0.340 -0.281 -0.140 -0.113 -0.095 0.012 0.006 0.003 0.003 0.002 0.002 0.002 ERA FP Equity FR0000131757 ERAMET Materials 85.86 3.49% 13.05.2013 55.17 55.01 55.00 54.81 57.12 56.98 0.010 0.011 0.015 0.027 0.014 0.015 0.000 0.000 0.000 0.000 0.000 0.000 EBS AV Equity AT0000652011 ERSTE GROUP BANK AG Financials 14.85 3.37% 17.05.2013 50.83 50.53 50.63 49.48 47.96 49.18 -0.367 -0.363 -0.284 -0.205 0.468 0.667 0.033 0.001 0.004 0.003 -0.003 -0.004 EI FP Equity FR0000121667 ESSILOR INTERNATIONAL Health Care 68.44 1.24% 24.05.2013 18.94 18.27 18.46 19.13 18.65 17.00 16.59 -0.121 -0.156 -0.191 -0.159 -0.100 -0.079 -0.075 0.023 0.007 0.005 0.004 0.002 0.001 0.001 MAU FP Equity FR0000051070 MAUREL ET PROM Energy 11.08 7.22% 04.07.2012 33.83 28.26 31.25 30.94 36.79 38.36 0.049 0.403 0.415 0.340 0.167 0.187 0.001 0.006 0.001 0.003 0.000 -0.001 ENRC LN Equity GB00B29BCK10 EURASIAN NATURAL RESOURCES Materials 475.00 3.07% 22.08.2012 49.21 47.10 45.00 39.91 0.244 0.205 0.166 0.143 -0.011 -0.013 -0.016 -0.009 RF FP Equity FR0000121121 EURAZEO Financials 32.19 3.73% 23.05.2013 49.37 48.22 48.33 49.08 48.88 50.91 -0.008 0.014 0.028 0.017 0.016 0.018 -0.001 0.000 0.000 0.000 0.000 -0.001 ECMPA NA Equity NL0000288876 EUROCOMMERCIAL PROPERTIE-CV Financials 26.72 7.11% 01.11.2012 ETL FP Equity FR0010221234 EUTELSAT COMMUNICATIONS Consumer Discretionary 23.44 4.18% 08.11.2012 19.85 20.12 20.05 20.98 20.92 20.31 0.195 0.010 0.006 0.006 0.023 -0.001 0.012 0.000 0.000 0.000 0.000 0.000 EVR LN Equity GB00B71N6K86 EVRAZ PLC Materials 321.10 8.94% 26.10.2012 EXO IM Equity IT0001353140 EXOR SPA Financials 16.59 2.02% 24.06.2013 41.96 39.34 38.87 38.93 -0.211 -0.088 -0.090 -0.016 0.007 0.006 0.000 0.000 EXPN LN Equity GB00B19NLV48 EXPERIAN PLC Industrials 896.50 2.39% 26.12.2012 20.57 20.72 20.87 21.63 -0.408 -0.353 -0.298 -0.180 0.010 0.008 0.007 0.001 EO FP Equity FR0000121147 FAURECIA Consumer Discretionary 15.41 6.16% 02.05.2013 50.64 49.92 49.20 47.69 47.31 47.31 -0.099 -0.092 -0.086 -0.075 -0.064 -0.064 0.001 0.001 0.001 0.000 0.000 0.000 FER SQ Equity ES0118900010 FERROVIAL SA Industrials 8.47 8.38% 15.11.2012 35.32 35.42 35.01 35.12 36.33 34.63 35.74 0.014 -0.008 -0.009 -0.023 0.058 0.055 0.112 -0.002 -0.001 0.000 -0.003 -0.003 -0.002 -0.003 FI IM Equity IT0004644743 FIAT INDUSTRIAL Industrials 7.84 2.81% 22.04.2013 45.21 43.94 43.92 42.47 40.98 40.98 -0.402 -0.345 -0.289 -0.215 -0.170 -0.170 0.006 0.004 0.003 0.002 0.001 0.001 F IM Equity IT0001976403 FIAT SPA Consumer Discretionary 3.79 3.95% 22.04.2013 53.30 52.29 51.82 50.61 45.22 42.47 40.51 -0.371 -0.292 -0.262 -0.185 -0.241 -0.225 -0.125 0.010 0.004 0.003 0.002 0.002 0.002 0.002 FNC IM Equity IT0003856405 FINMECCANICA SPA Industrials 2.88 9.74% 20.05.2013 64.75 61.21 60.04 55.20 50.51 50.51 -0.195 -0.166 -0.178 -0.155 -0.170 -0.170 0.003 0.000 0.000 0.001 0.002 0.002 FGP LN Equity GB0003452173 FIRSTGROUP PLC Industrials 201.40 12.02% 18.07.2012 FLS DC Equity DK0010234467 FLSMIDTH & CO A/S Industrials 330.00 3.03% 02.04.2013 39.74 39.30 41.32 40.34 -0.179 -0.194 -0.123 -0.080 0.007 0.000 0.000 -0.001 FDR FP Equity FR0000064578 FONCIERE DES REGIONS Financials 52.98 8.12% 13.05.2013 39.83 40.13 40.09 39.81 42.93 42.64 -0.006 0.004 0.022 0.020 0.031 0.048 0.000 0.000 0.000 0.000 0.000 0.000 FUM1V FH Equity FI0009007132 FORTUM OYJ Utilities 15.62 6.40% 01.04.2013 23.19 25.98 25.67 25.80 -0.184 -0.264 -0.229 -0.237 0.021 0.002 0.002 0.003 FTE FP Equity FR0000133308 FRANCE TELECOM SA Telecommunication Services 10.39 13.48% 05.09.2012 26.04 25.73 25.40 20.65 19.05 15.79 21.05 0.141 0.038 -0.011 -0.033 -0.050 0.018 0.035 0.023 0.007 0.004 0.010 0.009 0.016 0.001 FRA GY Equity DE0005773303 FRAPORT AG Industrials 43.21 2.89% 16.05.2013 29.19 28.92 28.86 29.73 29.71 29.33 28.38 -0.345 -0.169 -0.173 -0.226 -0.150 -0.120 -0.122 0.013 0.001 0.002 0.003 0.002 0.002 0.002 FME GY Equity DE0005785802 FRESENIUS MEDICAL CARE AG & Health Care 52.62 1.43% 13.05.2013 20.88 20.96 21.61 21.94 22.23 22.32 22.36 -0.138 -0.212 -0.181 -0.154 -0.107 -0.078 -0.055 0.023 0.011 0.006 0.003 0.002 0.001 0.002 FRE GY Equity DE0005785604 FRESENIUS SE & CO KGAA Health Care 75.12 1.42% 14.05.2013 23.09 23.04 23.32 23.29 23.78 23.92 23.54 -0.254 -0.198 -0.129 -0.153 -0.132 -0.119 -0.114 0.023 0.004 0.002 0.002 0.001 0.001 0.001 FRES LN Equity GB00B2QPKJ12 FRESNILLO PLC Materials 1378.00 3.12% 15.08.2012 FPE3 GY Equity DE0005790430 FUCHS PETROLUB AG -PFD Materials 41.31 2.59% 10.05.2013 26.19 24.77 24.71 24.84 26.96 27.09 26.67 -0.326 -0.220 -0.230 -0.221 -0.179 -0.161 -0.171 0.017 0.004 0.003 0.003 0.002 0.002 0.002 FUR NA Equity NL0000352565 FUGRO NV-CVA Energy 49.43 6.27% 13.05.2013 35.06 33.80 33.28 32.54 31.94 31.94 31.94 -0.214 -0.169 -0.164 -0.169 -0.088 -0.088 -0.088 0.013 0.002 0.002 0.003 -0.001 -0.001 -0.001 GFS LN Equity GB00B01FLG62 G4S PLC Industrials 272.90 3.48% 05.09.2012 GALN SE Equity CH0015536466 GALENICA AG-REG Health Care 590.50 1.52% 09.05.2013 32.91 32.28 32.17 28.42 27.89 27.63 -0.114 -0.055 -0.098 -0.061 -0.066 -0.051 0.010 0.007 0.004 0.003 0.000 0.001 GALP PL Equity PTGAL0AM0009 GALP ENERGIA SGPS SA Energy 9.95 2.41% 17.09.2012 GAM SE Equity CH0102659627 GAM HOLDING AG Financials 10.40 5.00% 22.04.2013 36.49 35.10 34.93 34.72 34.59 33.55 -0.423 -0.202 -0.258 -0.216 -0.151 -0.114 0.015 0.006 0.004 0.001 0.001 0.002 GAS SQ Equity ES0116870314 GAS NATURAL SDG SA Utilities 9.92 3.80% 09.01.2013 60.90 48.78 44.31 38.42 26.86 30.52 25.53 -0.955 -0.804 -0.709 -0.529 -0.164 -0.229 -0.148 0.004 0.004 0.005 0.003 0.003 0.002 0.003 GSZ FP Equity FR0010208488 GDF SUEZ Utilities 16.37 9.16% 07.11.2012 34.00 32.25 32.11 31.20 29.67 28.77 28.15 -0.393 -0.361 -0.318 -0.233 -0.157 -0.122 -0.075 0.011 0.006 0.003 0.003 0.002 0.002 0.001 G1A GY Equity DE0006602006 GEA GROUP AG Industrials 21.09 3.18% 25.04.2013 37.72 36.29 36.65 37.06 36.07 34.85 35.67 -0.463 -0.242 -0.240 -0.240 -0.167 -0.135 -0.153 0.010 0.001 0.002 0.003 0.002 0.002 0.001 GEBN VX Equity CH0030170408 GEBERIT AG-REG Industrials 190.20 3.31% 22.04.2013 20.37 20.43 21.11 21.60 22.18 21.93 -0.358 -0.282 -0.250 -0.275 -0.206 -0.156 0.019 0.005 0.004 0.006 0.003 0.003 GFC FP Equity FR0010040865 GECINA SA Financials 69.19 7.23% 17.05.2013 34.12 33.95 33.97 34.20 34.14 36.53 0.009 0.012 0.016 0.022 0.030 0.040 -0.001 0.000 0.000 0.000 0.000 0.000 GTO FP Equity NL0000400653 GEMALTO Information Technology 52.96 0.59% 24.05.2013 30.35 29.94 30.05 29.90 29.51 29.53 -0.004 0.003 0.010 0.009 0.028 0.032 0.000 0.000 0.000 0.000 0.000 0.000 FI/N SE Equity CH0001752309 FISCHER (GEORG)-REG Industrials 350.00 24.06.2013 33.13 31.01 30.98 31.49 34.09 34.16 -0.070 -0.108 -0.103 -0.057 -0.184 -0.099 0.000 0.002 0.002 0.001 0.001 0.001 GXI GY Equity DE000A0LD6E6 GERRESHEIMER AG Health Care 34.25 28.39 28.98 28.90 29.39 29.15 28.49 28.57 -0.120 -0.115 -0.120 -0.132 -0.107 -0.103 -0.102 0.006 0.002 0.001 0.002 0.001 0.002 0.002 GETIB SS Equity SE0000202624 GETINGE AB-B SHS Health Care 177.80 2.25% 29.04.2013 21.62 23.20 23.93 24.28 -0.165 -0.307 -0.227 -0.174 0.041 0.021 0.010 0.004 GIVN VX Equity CH0010645932 GIVAUDAN-REG Materials 865.50 2.66% 28.03.2013 16.71 17.75 19.20 20.33 21.14 21.03 -0.259 -0.229 -0.196 -0.252 -0.193 -0.162 0.017 0.002 0.002 0.005 0.003 0.002 GJF NO Equity NO0010582521 GJENSIDIGE FORSIKRING ASA Financials 67.50 7.41% 19.04.2013 24.76 24.68 24.59 -0.333 -0.285 -0.235 0.038 0.027 0.016 GKN LN Equity GB0030646508 GKN PLC Consumer Discretionary 189.70 4.48% 08.08.2012 GSK LN Equity GB0009252882 GLAXOSMITHKLINE PLC Health Care 1412.00 5.38% 01.08.2012 17.56 18.11 18.31 19.20 19.04 17.93 17.21 -0.513 -0.276 -0.228 -0.219 -0.135 -0.100 -0.073 0.017 0.007 0.004 0.004 0.003 0.004 0.004 GLEN LN Equity JE00B4T3BW64 GLENCORE INTERNATIONAL PLC Materials 358.10 2.92% 29.08.2012 40.51 39.20 38.85 37.76 36.94 36.96 -0.196 -0.230 -0.236 -0.240 -0.188 -0.199 0.004 0.000 0.002 0.000 0.002 0.002 GN DC Equity DK0010272632 GN STORE NORD A/S Health Care 68.20 0.67% 25.03.2013 34.59 31.68 31.87 32.81 0.024 -0.078 -0.128 -0.083 0.021 0.004 -0.003 -0.003 BKIR ID Equity IE0030606259 BANK OF IRELAND Financials 0.09 14.11.2012 69.15 67.70 65.10 65.23 65.91 65.07 -0.006 -0.032 0.198 0.080 0.010 0.006 0.012 -0.008 -0.005 0.000 -0.001 0.000 GPOR LN Equity GB00B01FLL16 GREAT PORTLAND ESTATES PLC Financials 377.10 2.25% 30.05.2012 GNK LN Equity GB00B0HZP136 GREENE KING PLC Consumer Discretionary 477.00 5.26% 08.08.2012 GRF SQ Equity ES0171996012 GRIFOLS SA Health Care 18.58 02.07.2012 39.17 37.50 37.26 34.65 33.75 32.39 32.71 -0.059 -0.060 -0.063 -0.081 -0.082 -0.010 -0.029 0.000 0.001 0.001 0.001 0.001 0.001 0.001 GBLB BB Equity BE0003797140 GROUPE BRUXELLES LAMBERT SA Financials 51.19 5.33% 26.04.2013 25.69 24.27 23.71 22.87 21.92 21.92 -0.350 -0.230 -0.218 -0.234 -0.179 -0.179 0.017 0.001 0.000 -0.001 -0.001 -0.001 GET FP Equity FR0010533075 GROUPE EUROTUNNEL SA - REGR Industrials 6.15 1.30% 21.05.2013 32.73 31.84 31.87 31.68 28.93 28.46 0.246 0.212 0.169 0.018 -0.003 0.036 0.010 0.001 0.003 -0.001 0.000 0.001 HLMA LN Equity GB0004052071 HALMA PLC Information Technology 377.00 2.69% 18.07.2012 HMSO LN Equity GB0004065016 HAMMERSON PLC Financials 416.30 4.06% 15.08.2012 HNR1 GY Equity DE0008402215 HANNOVER RUECKVERSICHERU-REG Financials 43.61 5.05% 06.05.2013 25.81 25.25 25.52 25.60 25.76 25.71 25.27 -0.246 -0.207 -0.217 -0.249 -0.137 -0.092 -0.066 0.022 0.001 0.002 0.003 0.001 0.000 0.001 HL/ LN Equity GB00B1VZ0M25 HARGREAVES LANSDOWN PLC Financials 473.80 4.62% 05.09.2012 HAS LN Equity GB0004161021 HAYS PLC Industrials 72.85 3.56% 10.10.2012 HEI GY Equity DE0006047004 HEIDELBERGCEMENT AG Materials 36.16 1.38% 03.05.2013 45.74 44.33 44.30 44.10 43.12 43.09 43.41 -0.414 -0.270 -0.225 -0.237 -0.150 -0.115 -0.093 0.006 0.000 0.003 0.002 0.001 0.000 -0.001 HEIO NA Equity NL0000008977 HEINEKEN HOLDING NV Consumer Staples 33.15 2.75% 27.08.2012 Q.M.S Advisors | tel: +41 (0)78 922 08 77 | e-mail: info@qmsadv.com |