Pick of the Week: BHARTI AIRTEL LTD.
•
0 likes•18 views

- Bharti Airtel Limited is an Indian multinational telecommunications services company headquartered in New Delhi that operates in 20 countries across South Asia, Africa, and the Channel Islands. - It is the largest mobile operator in South Asia and the third largest in the world with over 303 million subscribers. - The document provides a technical analysis of Bharti Airtel stock, recommending it as a "buy" based on chart patterns and indicators, with a projected price target of Rs. 410 in the coming trading sessions.

Recommended
More Related Content
What's hot
What's hot (20)
Similar to Pick of the Week: BHARTI AIRTEL LTD.
Similar to Pick of the Week: BHARTI AIRTEL LTD. (20)
Recently uploaded
Recently uploaded (20)
Pick of the Week: BHARTI AIRTEL LTD.
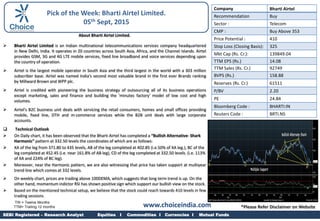
- 1. About Bharti Airtel Limited. Bharti Airtel Limited is an Indian multinational telecommunications services company headquartered in New Delhi, India. It operates in 20 countries across South Asia, Africa, and the Channel Islands. Airtel provides GSM, 3G and 4G LTE mobile services, fixed line broadband and voice services depending upon the country of operation. Airtel is the largest mobile operator in South Asia and the third largest in the world with a 303 million subscriber base. Airtel was named India's second most valuable brand in the first ever Brandz ranking by Millward Brown and WPP plc. Airtel is credited with pioneering the business strategy of outsourcing all of its business operations except marketing, sales and finance and building the 'minutes factory' model of low cost and high volumes. Airtel's B2C business unit deals with servicing the retail consumers, homes and small offices providing mobile, fixed line, DTH and m-commerce services while the B2B unit deals with large corporate accounts. Technical Outlook On Daily chart, it has been observed that the Bharti Airtel has completed a “Bullish Alternative- Shark Harmonic” pattern at 332.50 levels the coordinates of which are as follows: XA of the leg from 371.80 to 435 levels, AB of the leg completed at 402.85 (i.e.50% of XA leg.), BC of the leg completed at 452.45 (i.e. near 161.8% of AB leg), CD of the leg completed at 332.50 levels. (i.e. 113% of XA and 224% of BC leg). Moreover, near the Harmonic pattern, we are also witnessing that price has taken support at multiyear trend line which comes at 332 levels. On weekly chart, prices are trading above 100DEMA, which suggests that long term trend is up. On the other hand, momentum indictor RSI has shown positive sign which support our bullish view on the stock. Based on the mentioned technical setup, we believe that the stock could reach towards 410 levels in few trading sessions. Company Bharti Airtel Recommendation Buy Sector : Telecom CMP : Buy Above 353 Price Potential : 410 Stop Loss (Closing Basis): 325 Mkt Cap (Rs. Cr.): 139849.04 TTM EPS (Rs.) 14.08 TTM Sales (Rs. Cr.) 92749 BVPS (Rs.) 158.88 Reserves (Rs. Cr.) 61511 P/BV 2.20 PE 24.84 Bloomberg Code : BHARTI:IN Reuters Code : BRTI.NS TW = Twelve Months TTM= Trailing 12 months SEBI Registered – Research Analyst Equities I Commodities I Currencies I Mutual Funds Pick of the Week: Bharti Airtel Limited. 05th Sept, 2015 www.choiceindia.com *Please Refer Disclaimer on Website
- 2. Pick of the Week: Bharti Airtel Limited. 05th September, 2015 SEBI Certified – Research Analyst Equities I Commodities I Currencies I Mutual FundsSEBI Registered – Research Analyst Equities I Commodities I Currencies I Mutual Funds This is solely for information of clients of Choice Broking and does not construe to be an investment advice. It is also not intended as an offer or solicitation for the purchase and sale of any financial instruments. Any action taken by you on the basis of the information contained herein is your responsibility alone and Choice Broking its subsidiaries or its employees or associates will not be liable in any manner for the consequences of such action taken by you. We have exercised due diligence in checking the correctness and authenticity of the information contained in this recommendation, but Choice Broking or any of its subsidiaries or associates or employees shall not be in any way responsible for any loss or damage that may arise to any person from any inadvertent error in the information contained in this recommendation or any action taken on basis of this information. Technical analysis studies Aprilket psychology, price patterns and volume levels. It is used to forecast future price and Aprilket movements. Technical analysis is complementary to fundamental analysis and news sources. The recommendations issued herewith might be contrary to recommendations issued by Choice Broking in the company research undertaken as the recommendations stated in this report is derived purely from technical analysis. Choice Broking has based this document on information obtained from sources it believes to be reliable but which it has not independently verified; Choice Broking makes no guarantee, representation or warranty and accepts no responsibility or liability as to its accuracy or completeness. The opinions contained within the report are based upon publicly available information at the time of publication and are subject to change without notice. The information and any disclosures provided herein are in sumAprily form and have been prepared for informational purposes. The recommendations and suggested price levels are intended purely for trading purposes. The recommendations are valid for the day of the report however trading trends and volumes might vary substantially on an intraday basis and the recommendations may be subject to change. The information and any disclosures provided herein may be considered confidential. Any use, distribution, modification, copying, forwarding or disclosure by any person is strictly prohibited. The information and any disclosures provided herein do not constitute a solicitation or offer to purchase or sell any security or other financial product or instrument. The current performance may be unaudited. Past performance does not guarantee future returns. There can be no assurance that investments will achieve any targeted rates of return, and there is no guarantee against the loss of your entire investment. POTENTIAL CONFLICT OF INTEREST DISCLOSURE (as on date of report) Disclosure of interest statement – • Analyst interest of the stock /Instrument(s): - No. • Firm interest of the stock / Instrument (s): - No. Disclaimer Contact Us Kunal Pamar (Research Associate) kunal.pamar@choiceindia.com PERFORMANCE TRACKER www.choiceindia.comcustomercare@choiceindia.com Chandrakant Maske(Research Associate) chandrakant.maske@choiceindia.com Amit Pathania (Research Associate) amit.pathania@choiceindia.com Vikash Chaudhri (Research Associate) vikas.chaudhari@choiceindia.com