Techno Buy: KARURVYSYA
•
0 likes•30 views

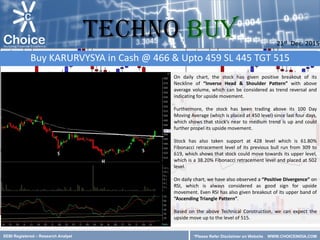
The stock has given a positive breakout from an inverse head and shoulders pattern with high volume, indicating a trend reversal and upside movement. It has also been trading above its 100-day moving average for four days, showing an upward near to medium term trend. Support at the 61.8% Fibonacci retracement level of 428 further signals potential upside to 502, the 38.2% retracement level. A positive RSI divergence on the daily chart also signals upside to a target of 515. The recommendation is to buy KARURVYSYA in cash at 466 with a stop loss of 445.

Recommended
More Related Content
What's hot
What's hot (20)
Similar to Techno Buy: KARURVYSYA
Similar to Techno Buy: KARURVYSYA (20)
Recently uploaded
Recently uploaded (20)
Techno Buy: KARURVYSYA
- 1. SEBI Registered – Research Analyst *Please Refer Disclaimer on Website On daily chart, the stock has given positive breakout of its Neckline of “Inverse Head & Shoulder Pattern” with above average volume, which can be considered as trend reversal and indicating for upside movement. Furthermore, the stock has been trading above its 100 Day Moving Average (which is placed at 450 level) since last four days, which shows that stock’s near to medium trend is up and could further propel its upside movement. Stock has also taken support at 428 level which is 61.80% Fibonacci retracement level of its previous bull run from 309 to 619, which shows that stock could move towards its upper level, which is a 38.20% Fibonacci retracement level and placed at 502 level. On daily chart, we have also observed a “Positive Divergence” on RSI, which is always considered as good sign for upside movement. Even RSI has also given breakout of its upper band of “Ascending Triangle Pattern”. Based on the above Technical Construction, we can expect the upside move up to the level of 515. Buy KARURVYSYA in Cash @ 466 & Upto 459 SL 445 TGT 515 21st Dec. 2015 TECHNO BUY *Please Refer Disclaimer on Website WWW.CHOICEINDIA.COM
- 2. www.choiceindia.com Contact Us Disclaimer This is solely for information of clients of Choice Broking and does not construe to be an investment advice. It is also not intended as an offer or solicitation for the purchase and sale of any financial instruments. Any action taken by you on the basis of the information contained herein is your responsibility alone and Choice Broking its subsidiaries or its employees or associates will not be liable in any manner for the consequences of such action taken by you. We have exercised due diligence in checking the correctness and authenticity of the information contained in this recommendation, but Choice Broking or any of its subsidiaries or associates or employees shall not be in any way responsible for any loss or damage that may arise to any person from any inadvertent error in the information contained in this recommendation or any action taken on basis of this information. Technical analysis studies market psychology, price patterns and volume levels. It is used to forecast future price and market movements. Technical analysis is complementary to fundamental analysis and news sources. The recommendations issued herewith might be contrary to recommendations issued by Choice Broking in the company research undertaken as the recommendations stated in this report is derived purely from technical analysis. Choice Broking has based this document on information obtained from sources it believes to be reliable but which it has not independently verified; Choice Broking makes no guarantee, representation or warranty and accepts no responsibility or liability as to its accuracy or completeness. The opinions contained within the report are based upon publicly available information at the time of publication and are subject to change without notice. The information and any disclosures provided herein are in summary form and have been prepared for informational purposes. The recommendations and suggested price levels are intended purely for trading purposes. The recommendations are valid for the day of the report however trading trends and volumes might vary substantially on an intraday basis and the recommendations may be subject to change. The information and any disclosures provided herein may be considered confidential. Any use, distribution, modification, copying, forwarding or disclosure by any person is strictly prohibited. The information and any disclosures provided herein do not constitute a solicitation or offer to purchase or sell any security or other financial product or instrument. The current performance may be unaudited. Past performance does not guarantee future returns. There can be no assurance that investments will achieve any targeted rates of return, and there is no guarantee against the loss of your entire investment. POTENTIAL CONFLICT OF INTEREST DISCLOSURE (as on date of report) Disclosure of interest statement – • Analyst interest of the stock /Instrument(s): - No. • Firm interest of the stock / Instrument (s): - No. www.choiceindia.comcustomercare@choiceindia.com Research Team Mr. Sumeet Bagadia Associate Director Kunal Parmar Research Associate Amit Pathania Research Associate Kapil Shah Research Associate Vikas Chaudhari Research Associate Rajnath Yadav Research Associate Satish Kumar Research Associate 21st Dec. 2015 TECHNO Buy Kunal Parmar Digitally signed by Kunal Parmar DN: cn=Kunal Parmar, o=Choice Equity Broking Pvt Ltd., ou=Research Dept, email=kunal.parmar@choiceindia.com, c=IN Date: 2015.12.21 13:44:07 +05'30'