
Recommended
More Related Content
What's hot
What's hot (20)
Similar to Pick of the week 10.12.16
Similar to Pick of the week 10.12.16 (20)
Recently uploaded
Recently uploaded (20)
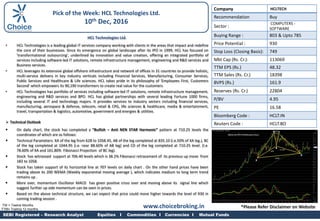
Pick of the week 10.12.16
- 1. HCL Technologies Ltd. • HCL Technologies is a leading global IT services company working with clients in the areas that impact and redefine the core of their businesses. Since its emergence on global landscape after its IPO in 1999, HCL has focused on 'transformational outsourcing', underlined by innovation and value creation, offering an integrated portfolio of services including software-led IT solutions, remote infrastructure management, engineering and R&D services and Business services. • HCL leverages its extensive global offshore infrastructure and network of offices in 31 countries to provide holistic, multi-service delivery in key industry verticals including Financial Services, Manufacturing, Consumer Services, Public Services and Healthcare & Life sciences. HCL takes pride in its philosophy of 'Employees First, Customers Second' which empowers its 90,190 transformers to create real value for the customers. • HCL Technologies has portfolio of services including software-led IT solutions, remote infrastructure management, engineering and R&D services and BPO. HCL has global partnerships with several leading Fortune 1000 firms, including several IT and technology majors. It provides services to industry sectors including financial services, manufacturing, aerospace & defense, telecom, retail & CPG, life sciences & healthcare, media & entertainment, travel, transportation & logistics, automotive, government and energies & utilities. Technical Outlook On daily chart, the stock has completed a “Bullish – Anti NEN STAR Harmonic” pattern at 710.25 levels the coordinates of which are as follows: Technical Parameters: XA of the leg from 628 to 1058.45, AB of the leg completed at 835.10 (i.e.50% of XA leg.), BC of the leg completed at 1044.95 (i.e. near 88.60% of AB leg) and CD of the leg completed at 710.25 level. (I.e. 78.60% of XA and 161.80% Fibonacci Projection of BC leg). Stock has witnessed support at 706.40 levels which is 38.2% Fibonacci retracement of its previous up move from 183 to 1058. Stock has taken support of its horizontal line at 707 levels on daily chart . On the other hand prices have been trading above its 200 WEMA (Weekly exponential moving average ), which indicates medium to long term trend remains up . More over, momentum Oscillator MACD has given positive cross over and moving above its signal line which suggest further up side momentum can be seen in prices. Based on the above technical structure, we can expect that price could move higher towards the level of 930 in coming trading session . Company HCLTECH Recommendation Buy Sector : COMPUTERS - SOFTWARE Buying Range : 803 & Upto 785 Price Potential : 930 Stop Loss (Closing Basis): 749 Mkt Cap (Rs. Cr.): 113069 TTM EPS (Rs.) 48.32 TTM Sales (Rs. Cr.) 18398 BVPS (Rs.) 161.9 Reserves (Rs. Cr.) 22804 P/BV 4.95 PE 16.58 Bloomberg Code : HCLT:IN Reuters Code : HCLT.BO TW = Twelve Months TTM= Trailing 12 months SEBI Registered – Research Analyst Equities I Commodities I Currencies I Mutual Funds Pick of the Week: HCL Technologies Ltd. 10th Dec, 2016 www.choicebroking.in *Please Refer Disclaimer on Website
- 2. Pick of the Week: HCL Technologies Ltd. 10th Dec, 2016 SEBI Certified – Research Analyst Equities I Commodities I Currencies I Mutual FundsSEBI Registered – Research Analyst Equities I Commodities I Currencies I Mutual Funds This is solely for information of clients of Choice Broking and does not construe to be an investment advice. It is also not intended as an offer or solicitation for the purchase and sale of any financial instruments. Any action taken by you on the basis of the information contained herein is your responsibility alone and Choice Broking its subsidiaries or its employees or associates will not be liable in any manner for the consequences of such action taken by you. We have exercised due diligence in checking the correctness and authenticity of the information contained in this recommendation, but Choice Broking or any of its subsidiaries or associates or employees shall not be in any way responsible for any loss or damage that may arise to any person from any inadvertent error in the information contained in this recommendation or any action taken on basis of this information. Technical analysis studies Aprilket psychology, price patterns and volume levels. It is used to forecast future price and Aprilket movements. Technical analysis is complementary to fundamental analysis and news sources. The recommendations issued herewith might be contrary to recommendations issued by Choice Broking in the company research undertaken as the recommendations stated in this report is derived purely from technical analysis. Choice Broking has based this document on information obtained from sources it believes to be reliable but which it has not independently verified; Choice Broking makes no guarantee, representation or warranty and accepts no responsibility or liability as to its accuracy or completeness. The opinions contained within the report are based upon publicly available information at the time of publication and are subject to change without notice. The information and any disclosures provided herein are in sumAprily form and have been prepared for informational purposes. The recommendations and suggested price levels are intended purely for trading purposes. The recommendations are valid for the day of the report however trading trends and volumes might vary substantially on an intraday basis and the recommendations may be subject to change. The information and any disclosures provided herein may be considered confidential. Any use, distribution, modification, copying, forwarding or disclosure by any person is strictly prohibited. The information and any disclosures provided herein do not constitute a solicitation or offer to purchase or sell any security or other financial product or instrument. The current performance may be unaudited. Past performance does not guarantee future returns. There can be no assurance that investments will achieve any targeted rates of return, and there is no guarantee against the loss of your entire investment. POTENTIAL CONFLICT OF INTEREST DISCLOSURE (as on date of report) Disclosure of interest statement – • Analyst interest of the stock /Instrument(s): - No. • Firm interest of the stock / Instrument (s): - No. Disclaimer Contact Us Kunal Parar ( Sr. Research Associate) kkunal.parar@choiceindia.com PERFORMANCE TRACKER www.choicebroking.incustomercare@choiceindia.com Kapil Shah(Research Associate) kapil.shah@choiceindia.com Amit Pathania (Research Associate) amit.pathania@choiceindia.com Vikas Chaudhari (Research Associate) vikas.chaudhari@choiceindia.com Vikas Chaudhari Digitally signed by Vikas Chaudhari DN: cn=Vikas Chaudhari, o=Choice Equity Broking Pvt Ltd, ou=Research Department, email=vikas.chaudhari@choiceindia.com, c=IN Date: 2016.12.10 15:58:38 +05'30'