
Recommended
More Related Content
Similar to October 15, 2006Federal Reserve Bank of ClevelandUnder.docx
Similar to October 15, 2006Federal Reserve Bank of ClevelandUnder.docx (20)
More from cherishwinsland
More from cherishwinsland (20)
Recently uploaded
Recently uploaded (20)
October 15, 2006Federal Reserve Bank of ClevelandUnder.docx
- 1. October 15, 2006 Federal Reserve Bank of Cleveland Understanding Unemployment by Guillaume Rocheteau ISSN 0428-1276 Modern economists have built models of the labor market, which isolate the market’s key drivers and describe the way these interact to produce particular levels of unemployment. One of the most popular models used by macroeconomists today is the search-matching model of equilibrium unemployment. We explain this model, and show how it can be applied to understand the way various policies, such as unemployment benefits, taxes, or technological changes, can affect the unemployment rate. Adisturbing feature of the labor mar- ket is its seeming inability to clear. At each instant in time, there are both workers without jobs and jobs without workers. How can it be that productive resources are left unemployed in a well- functioning market economy?
- 2. Economists attribute the failure of the labor market to instantly allocate work- ers to jobs to various “frictions.” These frictions arise because labor, unlike gold or oil, is not a homogenous commodity. The services provided by a plumber are different from those provided by a lawyer—and even lawyers differ in the services they offer; some specialize in constitutional law, others in private law. To match jobs and workers is far from a trivial problem. The heterogeneity of labor services also makes it hard for employers to distinguish productive from unproductive workers. And to complicate things even more, the mere process of moving labor services from one job to another is not costless. Over the past 25 years, economists have developed a theory of the labor market that takes into account the heterogeneity of labor services and that describes the matching process of workers and firms. The theory, sometimes called the search- matching theory of unemployment, is the description that most economists have in the back of their mind when thinking about the labor market. In this Commen- tary, we review this theory and show how it can be applied to address several issues related to unemployment. ■ Three Building Blocks for a Theory of Unemployment
- 3. The search model of unemployment contains three elements. Each element characterizes a different aspect of the labor market, and the three elements together determine the behavior of the overall labor market. The first element describes how wages are set. The second determines the number of vacancies that firms decide to open, and the third describes the process through which unemployed workers and vacancies are brought together, that is, the process of creating jobs. Setting Wages Not all labor markets work the same, but in many, wages are determined through a bargaining process between workers and their employers. The outcome of the bar- gaining process depends on two things: the bargaining power of each party and the outside options of each. The party with the most bargaining power—the worker or the firm—is the one that can extract a larger fraction of the surplus that stems from their relationship. The outside options for both workers and firms depend on the income of each if they stay unmatched as well as their ability to locate alternative partners if the negotiation fails. Outside options are affected by the “imbalances” of the labor market—the number of vacancies and the number of
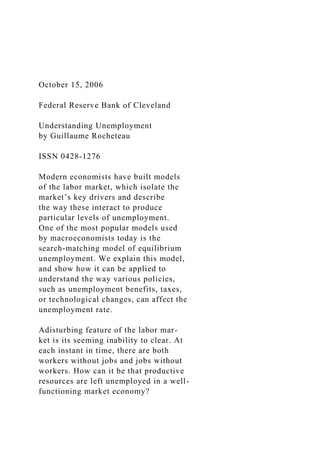
- 4. unemployed workers. Wages respond to changes in outside options as follows. If the number of vacancies per unemployed worker (a measure of the scarcity of workers often referred to as labor market tightness) is large, then workers’ outside options are good and they can ask for a high wage. Firms are willing to pay this high wage to avoid having to look for another worker and incurring high recruiting costs. But if vacancies are scarce relative to unemployed workers, then workers’ outside options are poor, and they are willing to accept low wages to avoid a long spell of unemployment. In cases where wages are formed differ- ently than by bargaining between work- ers and firms, most descriptions of the wage-setting process would still predict that wages tend to increase as the num- ber of vacancies (per unemployed worker) increases. The relationship between the wage and the number of vacancies is referred to as the wage-set- ting curve and is shown in figure 1. Our version of the wage-setting curve slopes upward: As the number of vacancies increases, workers get higher wages. The wage-setting curve shifts to the left or the right when fundamentals of the economy change. For instance, the curve moves to the right—meaning that wages increase—as workers’ productivity
- 5. increases, as workers enjoy more bar- gaining power, or as they receive more generous unemployment benefits. Opening Job Vacancies Once we know how the market wage is determined, we can find the number of workers that firms are willing to hire, or equivalently, the number of vacancies they want to open. If it were costless to find a suitable worker and if it could be done instantaneously, firms would keep hiring workers as long as each new worker’s productivity exceeded the mar- ket wage. But hiring a worker is neither costless nor instantaneous. The firm needs to post and advertise a vacancy, evaluate candidates, and so on. As a consequence of these labor market fric- tions, a firm will want to open a position only if the sum of profits it makes by hiring a worker compensates it for the various recruiting expenses it incurs to find the worker. This condition is referred to as the vacancy-supply condi- tion. It says that the number of vacan- cies opened in a labor market is deter- mined as a function of the market wage and recruiting costs. The vacancy-supply condition is repre- sented in figure 1. The curve slopes downward, meaning that the number of vacancies falls as the wage increases.
- 6. This can be understood intuitively by considering that when the wage is low, each worker generates high profits, and firms are willing to open a large number of vacancies. Of course, as the number of vacancies increases, it becomes harder for firms to find workers. As a consequence, hiring and recruiting costs increase until the incentives to open new vacancies are exhausted. Again, changes in the fundamentals of the labor market can affect the position of the vacancy-supply curve. The vacancy-supply curve moves upward (which means that firms want to hire more workers and therefore open a larger number of vacancies) as workers become more productive, as the cost of advertis- ing vacancies falls, and as the process of finding suitable workers becomes more efficient. Matching Workers and Jobs The wage-setting curve and the vacancy- supply curve allow us to determine the wage and the number of vacancies opened by firms. This information, how- ever, is insufficient to determine the unemployment rate. We need to know how the number of vacancies affects unemployment. For this, we need to understand how vacancies and unem- ployed workers are matched to create filled jobs.
- 7. As outlined earlier, the mechanism through which workers and firms are matched is imperfect and time consum- ing. Formally, this matching process is described as a “productive” process. There is an output: the number of matches between workers and firms, or equivalently, the number of jobs created. There are two inputs: the number of unemployed workers and the number of vacancies. The relationship between the stock of unemployed workers and the stock of vacancies to the number of jobs created, the so-called matching function, has been estimated for the U.S. economy (as well as for other economies). It has the following properties. The number of jobs created is larger when there are more unemployed workers and vacan- cies. This property can be understood intuitively when you consider that a productive process produces more output if it has more inputs. If one doubles the number of vacancies and the number of unemployed workers, the number of jobs created should be doubled as well. (The matching function is said to have con- stant returns to scale.) However, the rate at which an unemployed worker finds a job decreases as the pool of unemployed workers expands. Economists say that workers exert a “congestion effect” on each other when they are searching for a job. The matching function is illustrated
- 8. in figure 2. The flow of job creations feeds the stock of employed workers and filled jobs. The stock of unemployed workers is replenished by the flow of job destructions. If the economy were not subject to various shocks, it would end up in a steady state, where the number of jobs created would equal the number of jobs destroyed, and the stock of unemployed workers would remain unchanged. In this steady state, the unemployment rate would be low if the flow of job creations were large relative to job destructions, which would occur when the number of vacancies was large. But if there were few vacancies, then the flow of job creations would be small, and the unem- ployment rate would be high. The nega- tive relationship between vacancies and unemployment (at the steady state) is represented in the right panel of figure 1, and it is called the Beveridge curve. The Beveridge curve is an important tool for economists who want to assess the extent of search-matching frictions in the labor market. An upward shift of the Beveridge curve is symptomatic of a more severe mismatch problem between workers and jobs. FIGURE 2 JOB FLOWS Vacancies Vacancies
- 9. Wage setting Vacancy supply Beveridge curve Unemployment rateWageW* V* U* Unemployed workers Vacancies Employed workers and filled jobs Matching Job destructions Job destructions Job creations FIGURE 1 SEARCH FRICTIONS AND UNEMPLOYMENT
- 10. Putting the Three Building Blocks Together Obviously, wages, vacancies, and the unemployment rate cannot be explained independently. One cannot understand wages without knowing the tightness of the labor market; the number of vacan- cies depends on the market wage; and the unemployment rate depends on the number of vacancies opened by firms. We have to put the three pieces of the puzzle together. Since the vacancy-supply curve slopes up, and the wage-setting curve slopes down, there is a unique intersection between the two curves. The point of intersection determines the going mar- ket wage and the number of vacancies (that is, the vacancy-unemployment ratio. See the left panel of figure 1). The market wage is denoted W* in figure 1, and the vacancy-unemploy- ment ratio is denoted V*. Once we know the vacancy-unemployment ratio, the unemployment rate is obtained from the Beveridge curve (see the right panel of figure 1.) The equilibrium unemploy- ment rate is denoted U* in figure 1. We can then use this simple theory to determine how the equilibrium unem- ployment rate is affected when eco- nomic fundamentals, such as productiv-
- 11. ity, workers’ bargaining power, recruiting costs, and matching frictions, change or when policies, such as unem- ployment benefits or taxes, are altered. ■ The Determinants of the Unemployment Rate Generous unemployment benefits are often blamed for higher unemployment rates in Europe relative to the United States. How valid is this claim? The search-matching theory can help us evaluate it. According to the theory, higher unemployment benefits shift the wage-setting curve to the right: Workers are in a better position when unemployed, which allows them to negotiate a higher wage. As a consequence, firms have a lower incentive to open vacancies because they would make lower profits off of them. More generous benefits can also slow down the time it takes to match work- ers and firms. First, unemployed workers are in less of a hurry to find a job and, therefore, they search with a lower intensity. Second, they are more choosy in terms of the type of job they will accept. Because of these effects, the Beveridge curve shifts upward, and for a given vacancy- unemployment ratio, the unemploy-
- 12. ment rate increases. To summarize, more generous benefits lead to higher wages, fewer vacancies, and slower matching. No surprise, the unem- ployment rate increases. More powerful European unions have also been blamed for transatlantic differences in unemployment rates. Do unions deserve such blame? The search-matching theory says that the higher bargaining power enjoyed by unions in some European countries allows workers to extract a larger share of the surplus generated by a job. Because the market wage is higher, firms have a smaller incentive to open vacancies. Graphically, the wage-setting curve shifts to the right, which raises wages but reduces the supply of vacancies. Unemployment increases. Some economists have argued that the main reason unemployment rates differ across developed countries stems from different tax policies. For instance, payroll taxes tend to be higher in Europe. According to the search-matching theory, taxes reduce firms’ incentives to open vacancies and workers’ incentives to search for jobs because taxes reduce the (net) surplus from a filled job. Graphically, a payroll tax moves the vacancy- supply curve downward and the
- 13. wage-setting curve to the left. The vacancy-unemployment ratio and (net) wages are lower, while unem- ployment is higher. Countries with similar policies can have different unemployment rates because they use different technologies to match workers and firms. The Internet or employment agencies, for example, might improve the matching process, and firms in countries where they are available will have higher incentives to open vacancies. Graphi- cally, the vacancy-supply curve moves upward. The vacancy-unemployment ratio and wages increase. In addition, the Beveridge curve shifts downward because the matching process is more efficient. Therefore, the equilibrium unemployment rate is lower in coun- tries with lower matching frictions. ■ Why Do Unemployment Rates Vary with Business Cycles? Unemployment rates are lower in booms and higher in recessions. The search theory of unemployment helps makes it clear why this should be the case. Business cycle fluctuations are commonly thought to be initiated by productivity shocks, and changes in labor productivity over the business cycle will cause predictable conse-
- 14. quences in the labor market that are captured by the theory. What happens when workers become more productive? Because they produce more output, they can ask for a higher wage. The wage- setting curve moves to the right. Firms also make higher profits when workers are more productive (assuming that workers cannot appropriate the full increase in productivity), so the vacancy-supply curve moves upward. Over the business cycle, the vacancy rate will cycle above and below the Beveridge curve (see figure 3). A posi- tive productivity shock raises the vacancy-unemployment ratio so that the economy is located above the Bev- eridge curve. Then, the unemployment rate decreases over time and the econ- omy returns to the Beveridge curve. Similarly, following a negative shock, the vacancy-unemployment ratio falls and the economy falls below the Bev- eridge curve. Then, the unemployment rate increases gradually to bring the economy back to a steady state. The Beveridge curve can also shift up and down during the business cycle. Indeed, recessions are often described as intense periods of reallocations of workers and jobs. One explanation for Vacancies Vacancies
- 15. Wage setting Vacancy supply Beveridge curve Unemployment rateWage Boom Recession FIGURE 3 FLUCTUATIONS OF THE UNEMPLOYMENT RATE Federal Reserve Bank of Cleveland Research Department P.O. Box 6387 Cleveland, OH 44101 Return Service Requested: Please send corrected mailing label to the above address. Material may be reprinted if the source is credited. Please send copies of reprinted material to the editor. Guillaume Rocheteau is an economist at the Federal Reserve Bank of Cleveland. The views expressed here are those of the
- 16. author and not necessarily those of the Federal Reserve Bank of Cleveland, the Board of Governors of the Federal Reserve System, or its staff. Economic Commentary is published by the Research Department of the Federal Reserve Bank of Cleveland. To receive copies or to be placed on the mailing list, e-mail your request to [email protected] or fax it to 216-579-3050. Economic Commentary is also available at the Cleveland Fed’s site on the World Wide Web: www.clevelandfed.org/ research. We invite comments, questions, and sugges- tions. E-mail us at [email protected] PRSRT STD U.S. Postage Paid Cleveland, OH Permit No. 385 this phenomenon is that the reallocation of jobs is less costly during recession because the opportunity cost of closing jobs and plants (the foregone output, worker retraining, the retooling of plants…) is smaller than it is during booms. ■ Recommended Readings Dale Mortensen, and Christopher Pis- sarides. 1999. “New Developments in Models of Search in the Labor Market,” Chapter 39 in Orley Ashenfelter and
- 17. David Card (eds.) Handbook of Labor Economics, vol. 3B, Amsterdam: North-Holland. Christopher Pissarides. 2000. Equilib- rium Unemployment, 2nd edition, Cambridge, Mass.: MIT Press.