SlideShare a Scribd company logo
1 of 1
Download to read offline
Modelling effects of food loss and waste
mitigation measures on GHG emissions
Jan Broeze, Nina Waldhauer, Marianne van der Burgh and Bart van Gogh
Background
Food losses and waste are estimated at one-third of all food produced
for human consumption (FAO and others). These represent substantial
environmental impacts, estimated at around 7 percent of
anthropogenic greenhouse gas emissions (Vermeulen et al. 2012). It
is considered essential to significantly reduce these inefficiencies for
minimizing environmental impacts of food production and for securing
expected increasing demands for food, feed and biobased non-food
uses.
Food losses and waste generate emissions not only through the waste
handling processes (like rotting in landfilling, composting, bio-
digestion, etc.), but also have an even more substantial impact
through indirect contribution via the embedded emissions in primary
production, processing, distribution, and refrigeration of the wasted
food itself.
A variety of food loss and waste preventing measures can be
implemented in the post-harvest chain, contributing to the reduction
of product quality decay and losses, including (FAO, 2011):
• developing processing facilities;
• improving storage facilities;
• establishing/improving cold chain;
• using packaging for fresh products.
These preventive measures require investments and cause
greenhouse gas emissions, thus adding to climate change rather than
solely reducing it (James & James, 2010). This research analyses net
effects (comparing embedded GHG emissions reductions to added
emissions).
Approach
Conclusions
This work was implemented as part of the CGIAR Research Program on Climate Change,
Agriculture and Food Security (CCAFS), which is carried out with support from CGIAR Fund
Donors and through bilateral funding agreements. For details please visit
https://ccafs.cgiar.org/donors.
Acknowledgements
For assessing net
effects of food losses
reduction scenarios,
cumulative direct and
indirect sustainability
effects must be
estimated. For that,
appropriate data for
effects of agricultural
production and post-
harvest handling must
be combined in an
integrated model
(Table 1).
Table 1. Integrated modelling approach
Figure 1. Chain impact modelling user-interface.
A modelling approach for calculate cumulative GHG impacts of food
supply along the supply chain has been formulated. This will be used
to calculate sustainability cost-benefit of improvement opportunities.
Finding appropriate performance and sustainability data as explained
in Table 1 is essential for validity of the outcomes. Preliminary
comparisons of calculations based on these data and on industry-
supplied data gave noticeably similar outcomes. Thus, using
secondary data as explained in this table seems a good basis for
practical relevant conclusions.
Wageningen University & Research
P.O. Box 123, 6700 AB Wageningen
Contact: jan.broeze@wur.nl
T + 31 (0)317 48 01 47, M +31 (0)6 51 02 79 06
www.wur.nl/wfbr
Modelled
stages along
the supply
chain
Sustainability
effects
Complication Sources for data
Agricultural
production
CO2 emissions
associated with
agricultural
production
Distinction between
crops (categories)
and production
regions
FAO and Porter et al. (2016)
Transportation CO2 emissions
related to fuel use
Distinction between
transport modalities
GER data, EcoInvent
Food
processing
CO2 emissions due
to processing
Product and process
specific
Expert estimations +
practical data
Refrigerated
storage
CO2 emissions
related to energy
use and use of
refrigerants
Results largely
depend on
technology level and
refrigerant type
Reference examples of
refrigerated warehouses
Retail shelf CO2 emissions
related to energy
use for cooling
and use of
refrigerants
Results largely
depend on
technology level and
refrigerant type
Reference examples
Food losses
(applies at
each stage of
the supply
chain)
Due to losses,
cumulative effects
are allocated to a
reduced volume of
food.
Effects of food
waste handling
process.
Losses largely vary
amongst product
categories and
production and
consumption
regions.
Large differences of
impacts amongst
food waste handling
options.
FAO and Porter et al. (2016)
give global overview of food
losses per stage in food
supply chains for the main
food product categories,
differentiated for production
regions.
Effects of waste processes
are estimated from various
information sources.
MODELLING CO2 IMPACTS OF FOOD PRODUCTION AND SUPPLY CHAIN
Jan Broeze, version 10 November 2017
CASE name Several impact estimates are based on GER data and data from EcoInvent database
Geographical region (production) North Africa, West and Central Asia
Geographical region (consumption) Europe
Crop Grapes
GLOBAL RESULT TOTAL ENERGY USE AND GHG IMPACT PER KG PRODUCED CROP: 10.45 1.122
CHAIN PRODUCT EFFICIENCY (KG SOLD/KG CROP) 0.59 TOTALS PER KG SOLD IN RETAIL: 17.63 1.894
Energy use (MJ) CO2-equiv.
(primary equivalent) emissions (kg)
Agricultural production Initial unit 1.00 kg crop
CO2 impact 0.55 kg CO2eq per kg harvested crop 0.550
Energy use 0 MJ per kg crop (primary energy equivalent) 0.00
Losses 11%
Losses waste management Combustion -0.015
Postharvest handling and storage product in 0.89 kg
Average number of hours at ambient conditions 0 hours
Ambient temperature 20 C
Average number of days in refrig. storage 1 days 0.01 0.000
Other energy use 0 MJ per kg product (primary energy eq.) 0.00 0.000
Losses 11%
Losses waste management Landfilling 0.079
Collection transport
Transport distance 30 km
Transport modality Truck, medium 0.09 0.006
Refrigeration in transport? 0 0.00 0.000
Primary processing and packaging product in 0.79 kg
Losses 20%
Losses waste management Composting -0.027
Packaging steel 0 kg steel packaging per kg product 0.00 0.000
Packaging aluminium 0 kg aluminium per kg product 0.00 0.000
Packaging paper and board 0.057 kg paper and board per kg product 0.90 0.036
Packaging plastics 0.04 kg plastics per kg product 2.01 0.076
Packaging glass 0 kg glass per kg product 0.00 0.000
Transportation means (pellets, crates, etc.) 0.036 kg tarra per kg product
Processing and packaging energy use 0.07 MJ per kg product (primary energy eq.) 0.04 0.002
Average number of hours at ambient conditions hours
Ambient temperature 20 C
Average number of days in refrig. storage 1 days 0.01 0.000
(Possibly multi-modal) transport product in 0.63 kg
Transport 1 distance 0 km
Transport 1 modality Lorry, very larg (>32ton) 0.00 0.000
Ambient (0), chilled (1) or frozen (2)? 1 0.00 0.000
Transport 2 distance 5000 km
Transport 2 modality Lorry, very larg (>32ton) 5.19 0.302
Ambient (0), chilled (1) or frozen (2)? 1 1.04 0.060
Transport 3 distance 0 km
Transport 3 modality Lorry, very larg (>32ton) 0.00 0.000
Ambient (0), chilled (1) or frozen (2)? 1 0.00 0.000
Distribution/processing/repackaging centerproduct in 0.63 kg
Losses 1%
Losses waste management Combustion -0.001
Packaging steel 0 kg steel packaging per kg product 0.00 0.000
Packaging aluminium 0 kg aluminium per kg product 0.00 0.000
Packaging paper and board 0 kg paper and board per kg product 0.00 0.000
Packaging plastics 0 kg plastics per kg product 0.00 0.000
Packaging glass 0 kg glass per kg product 0.00 0.000
Adding water to processed product 0 kg water per kg product
Transportation means (pellets, crates, etc.) 0.036 kg tarra per kg product
Processing and packaging energy use 0 MJ per kg product (primary energy eq.) 0.00 0.000
Average number of hours at ambient conditions hours
Ambient temperature C
Average number of days in refrig. storage 2 days 0.01 0.001
Other energy use 0.1 MJ per kg product (primary energy eq.) 0.06 0.003
Distribution transport product in 0.62 kg
Transport distance 100 km
Transport modality Truck, large 0.20 0.012
Refrigeration in transport? 1 0.04 0.002
Retail product in 0.62 kg
Average number of hours at ambient conditions hours
Ambient temperature C
Average number of days in refrig. storage 2 days 0.83 0.039
Other energy use MJ per kg product (primary energy eq.) 0.00 0.000
Losses 5% percent
Losses waste management Composting -0.005
product sold 0.59
confirmregions
Reset
Reset
Reset
Reset
Reset
Reset

More Related Content

Similar to Modelling effects of food loss and waste mitigation measures on GHG emissions

Do donuts grow on trees?: Delivering the circular bioeconomy for low-emission...
Do donuts grow on trees?: Delivering the circular bioeconomy for low-emission...Do donuts grow on trees?: Delivering the circular bioeconomy for low-emission...
Do donuts grow on trees?: Delivering the circular bioeconomy for low-emission...CIFOR-ICRAF
 
Decarbonise Now - Consumption goods.pdf
Decarbonise Now - Consumption goods.pdfDecarbonise Now - Consumption goods.pdf
Decarbonise Now - Consumption goods.pdfMarie-Astrid Heyde
 
Carbon and nitrogen footprint for food crop production
Carbon and nitrogen footprint for food crop productionCarbon and nitrogen footprint for food crop production
Carbon and nitrogen footprint for food crop productionPravash Chandra Moharana
 
Food losses footprint highlights
Food losses footprint highlightsFood losses footprint highlights
Food losses footprint highlightsFAO
 
Waste: Local Actions with Global Effects
Waste: Local Actions with Global EffectsWaste: Local Actions with Global Effects
Waste: Local Actions with Global EffectsD-Waste
 
Food miles essay
Food miles essayFood miles essay
Food miles essayMarga Alcoz
 
Sustain Module 2
Sustain Module 2Sustain Module 2
Sustain Module 2IanSayers7
 
Carbon footprint and Ecological Footprint
Carbon footprint and Ecological FootprintCarbon footprint and Ecological Footprint
Carbon footprint and Ecological FootprinteAmbiente
 
Decarbonisation agriculture
Decarbonisation agricultureDecarbonisation agriculture
Decarbonisation agriculturePatrickTanz
 
Food policy - EU Climate Change and the impact Dietary Choice Feb 2016
Food policy - EU Climate Change and the impact Dietary Choice Feb 2016Food policy - EU Climate Change and the impact Dietary Choice Feb 2016
Food policy - EU Climate Change and the impact Dietary Choice Feb 2016New Food Innovation Ltd
 
Life cycle assessment (LCA) of Dairy and beef cattles
Life cycle assessment (LCA) of Dairy and beef cattles Life cycle assessment (LCA) of Dairy and beef cattles
Life cycle assessment (LCA) of Dairy and beef cattles Mohmed Sarhan
 
Improving the sustainability of livestock systems in Ireland
Improving the sustainability of livestock systems in IrelandImproving the sustainability of livestock systems in Ireland
Improving the sustainability of livestock systems in IrelandIrishFarmers
 
Livestock and Climate Change - Tara Garnett, Food Climate Research Network, U...
Livestock and Climate Change - Tara Garnett, Food Climate Research Network, U...Livestock and Climate Change - Tara Garnett, Food Climate Research Network, U...
Livestock and Climate Change - Tara Garnett, Food Climate Research Network, U...guycollender
 

Similar to Modelling effects of food loss and waste mitigation measures on GHG emissions (20)

Do donuts grow on trees?: Delivering the circular bioeconomy for low-emission...
Do donuts grow on trees?: Delivering the circular bioeconomy for low-emission...Do donuts grow on trees?: Delivering the circular bioeconomy for low-emission...
Do donuts grow on trees?: Delivering the circular bioeconomy for low-emission...
 
Decarbonise Now - Consumption goods.pdf
Decarbonise Now - Consumption goods.pdfDecarbonise Now - Consumption goods.pdf
Decarbonise Now - Consumption goods.pdf
 
Carbon and nitrogen footprint for food crop production
Carbon and nitrogen footprint for food crop productionCarbon and nitrogen footprint for food crop production
Carbon and nitrogen footprint for food crop production
 
Pierre Gerber. Rethinking livestock production and diets Nov 2015
Pierre Gerber. Rethinking livestock production and diets Nov 2015Pierre Gerber. Rethinking livestock production and diets Nov 2015
Pierre Gerber. Rethinking livestock production and diets Nov 2015
 
Greenhouse gas (GHG) emissions & priority action in climate mitigation in the...
Greenhouse gas (GHG) emissions & priority action in climate mitigation in the...Greenhouse gas (GHG) emissions & priority action in climate mitigation in the...
Greenhouse gas (GHG) emissions & priority action in climate mitigation in the...
 
Food losses footprint highlights
Food losses footprint highlightsFood losses footprint highlights
Food losses footprint highlights
 
Speciale
SpecialeSpeciale
Speciale
 
Waste: Local Actions with Global Effects
Waste: Local Actions with Global EffectsWaste: Local Actions with Global Effects
Waste: Local Actions with Global Effects
 
The food loss and waste calculator and how it can be used to mitigate climate...
The food loss and waste calculator and how it can be used to mitigate climate...The food loss and waste calculator and how it can be used to mitigate climate...
The food loss and waste calculator and how it can be used to mitigate climate...
 
Food miles essay
Food miles essayFood miles essay
Food miles essay
 
Establishing Climate Smart Agriculture in the World
Establishing Climate Smart Agriculture in the WorldEstablishing Climate Smart Agriculture in the World
Establishing Climate Smart Agriculture in the World
 
Final results - Life Beef Carbon
Final results - Life Beef CarbonFinal results - Life Beef Carbon
Final results - Life Beef Carbon
 
Strategies for food and climate: why and how
Strategies for food and climate: why and howStrategies for food and climate: why and how
Strategies for food and climate: why and how
 
Sustain Module 2
Sustain Module 2Sustain Module 2
Sustain Module 2
 
Carbon footprint and Ecological Footprint
Carbon footprint and Ecological FootprintCarbon footprint and Ecological Footprint
Carbon footprint and Ecological Footprint
 
Decarbonisation agriculture
Decarbonisation agricultureDecarbonisation agriculture
Decarbonisation agriculture
 
Food policy - EU Climate Change and the impact Dietary Choice Feb 2016
Food policy - EU Climate Change and the impact Dietary Choice Feb 2016Food policy - EU Climate Change and the impact Dietary Choice Feb 2016
Food policy - EU Climate Change and the impact Dietary Choice Feb 2016
 
Life cycle assessment (LCA) of Dairy and beef cattles
Life cycle assessment (LCA) of Dairy and beef cattles Life cycle assessment (LCA) of Dairy and beef cattles
Life cycle assessment (LCA) of Dairy and beef cattles
 
Improving the sustainability of livestock systems in Ireland
Improving the sustainability of livestock systems in IrelandImproving the sustainability of livestock systems in Ireland
Improving the sustainability of livestock systems in Ireland
 
Livestock and Climate Change - Tara Garnett, Food Climate Research Network, U...
Livestock and Climate Change - Tara Garnett, Food Climate Research Network, U...Livestock and Climate Change - Tara Garnett, Food Climate Research Network, U...
Livestock and Climate Change - Tara Garnett, Food Climate Research Network, U...
 

More from CCAFS | CGIAR Research Program on Climate Change, Agriculture and Food Security

More from CCAFS | CGIAR Research Program on Climate Change, Agriculture and Food Security (20)

CGIAR-AICCRA Knowledge Management Guide (2021)
CGIAR-AICCRA Knowledge Management Guide (2021)CGIAR-AICCRA Knowledge Management Guide (2021)
CGIAR-AICCRA Knowledge Management Guide (2021)
 
Achieving NDC Ambition in Agriculture: How much does agriculture contribute t...
Achieving NDC Ambition in Agriculture: How much does agriculture contribute t...Achieving NDC Ambition in Agriculture: How much does agriculture contribute t...
Achieving NDC Ambition in Agriculture: How much does agriculture contribute t...
 
Achieving NDC Ambition in Agriculture: Mitigation ambition in new & updated N...
Achieving NDC Ambition in Agriculture: Mitigation ambition in new & updated N...Achieving NDC Ambition in Agriculture: Mitigation ambition in new & updated N...
Achieving NDC Ambition in Agriculture: Mitigation ambition in new & updated N...
 
Achieving NDC Ambition in Agriculture: Overview of NDC ambition in the agricu...
Achieving NDC Ambition in Agriculture: Overview of NDC ambition in the agricu...Achieving NDC Ambition in Agriculture: Overview of NDC ambition in the agricu...
Achieving NDC Ambition in Agriculture: Overview of NDC ambition in the agricu...
 
CCAFS and GRA Resources for CLIFF-GRADS 2021
CCAFS and GRA Resources for CLIFF-GRADS 2021CCAFS and GRA Resources for CLIFF-GRADS 2021
CCAFS and GRA Resources for CLIFF-GRADS 2021
 
CSA Monitoring: Understanding adoption, synergies and tradeoffs at farm and h...
CSA Monitoring: Understanding adoption, synergies and tradeoffs at farm and h...CSA Monitoring: Understanding adoption, synergies and tradeoffs at farm and h...
CSA Monitoring: Understanding adoption, synergies and tradeoffs at farm and h...
 
Livestock and sustainability in changing climate: Impacts and global best pra...
Livestock and sustainability in changing climate: Impacts and global best pra...Livestock and sustainability in changing climate: Impacts and global best pra...
Livestock and sustainability in changing climate: Impacts and global best pra...
 
Plant-based protein market in Asia
Plant-based protein market in AsiaPlant-based protein market in Asia
Plant-based protein market in Asia
 
ADB ESLAP case study outputs and synthesis results: Sustainable livestock gui...
ADB ESLAP case study outputs and synthesis results: Sustainable livestock gui...ADB ESLAP case study outputs and synthesis results: Sustainable livestock gui...
ADB ESLAP case study outputs and synthesis results: Sustainable livestock gui...
 
ADB ESLAP Case Study "Dairy value chain in Indonesia"
ADB ESLAP Case Study "Dairy value chain in Indonesia"ADB ESLAP Case Study "Dairy value chain in Indonesia"
ADB ESLAP Case Study "Dairy value chain in Indonesia"
 
Assessment of the environmental sustainability of plant-based meat and pork: ...
Assessment of the environmental sustainability of plant-based meat and pork: ...Assessment of the environmental sustainability of plant-based meat and pork: ...
Assessment of the environmental sustainability of plant-based meat and pork: ...
 
Case study on dairy value chain in China
Case study on dairy value chain in ChinaCase study on dairy value chain in China
Case study on dairy value chain in China
 
Global sustainable livestock investment overview
Global sustainable livestock investment overviewGlobal sustainable livestock investment overview
Global sustainable livestock investment overview
 
The impact of mechanization in smallholder rice production in Nigeria
The impact of mechanization in smallholder rice production in NigeriaThe impact of mechanization in smallholder rice production in Nigeria
The impact of mechanization in smallholder rice production in Nigeria
 
Biodiversity in agriculture for people and planet
Biodiversity in agriculture for people and planetBiodiversity in agriculture for people and planet
Biodiversity in agriculture for people and planet
 
Evaluation of Rwanda climate services for agriculture through a gender lens
Evaluation of Rwanda climate services for agriculture through a gender lensEvaluation of Rwanda climate services for agriculture through a gender lens
Evaluation of Rwanda climate services for agriculture through a gender lens
 
Introduction to Climate-Smart Agriculture: Busia County, Kenya
Introduction to Climate-Smart Agriculture: Busia County, KenyaIntroduction to Climate-Smart Agriculture: Busia County, Kenya
Introduction to Climate-Smart Agriculture: Busia County, Kenya
 
Delivering information for national low-emission development strategies: acti...
Delivering information for national low-emission development strategies: acti...Delivering information for national low-emission development strategies: acti...
Delivering information for national low-emission development strategies: acti...
 
Delivering information for national low-emission development strategies: acti...
Delivering information for national low-emission development strategies: acti...Delivering information for national low-emission development strategies: acti...
Delivering information for national low-emission development strategies: acti...
 
Scaling the use of research outputs to support the low emissions development ...
Scaling the use of research outputs to support the low emissions development ...Scaling the use of research outputs to support the low emissions development ...
Scaling the use of research outputs to support the low emissions development ...
 

Recently uploaded

Factory Acceptance Test( FAT).pptx .
Factory Acceptance Test( FAT).pptx       .Factory Acceptance Test( FAT).pptx       .
Factory Acceptance Test( FAT).pptx .Poonam Aher Patil
 
Reboulia: features, anatomy, morphology etc.
Reboulia: features, anatomy, morphology etc.Reboulia: features, anatomy, morphology etc.
Reboulia: features, anatomy, morphology etc.Silpa
 
LUNULARIA -features, morphology, anatomy ,reproduction etc.
LUNULARIA -features, morphology, anatomy ,reproduction etc.LUNULARIA -features, morphology, anatomy ,reproduction etc.
LUNULARIA -features, morphology, anatomy ,reproduction etc.Silpa
 
Atp synthase , Atp synthase complex 1 to 4.
Atp synthase , Atp synthase complex 1 to 4.Atp synthase , Atp synthase complex 1 to 4.
Atp synthase , Atp synthase complex 1 to 4.Silpa
 
Human genetics..........................pptx
Human genetics..........................pptxHuman genetics..........................pptx
Human genetics..........................pptxSilpa
 
Role of AI in seed science Predictive modelling and Beyond.pptx
Role of AI in seed science  Predictive modelling and  Beyond.pptxRole of AI in seed science  Predictive modelling and  Beyond.pptx
Role of AI in seed science Predictive modelling and Beyond.pptxArvind Kumar
 
Climate Change Impacts on Terrestrial and Aquatic Ecosystems.pptx
Climate Change Impacts on Terrestrial and Aquatic Ecosystems.pptxClimate Change Impacts on Terrestrial and Aquatic Ecosystems.pptx
Climate Change Impacts on Terrestrial and Aquatic Ecosystems.pptxDiariAli
 
Module for Grade 9 for Asynchronous/Distance learning
Module for Grade 9 for Asynchronous/Distance learningModule for Grade 9 for Asynchronous/Distance learning
Module for Grade 9 for Asynchronous/Distance learninglevieagacer
 
Bhiwandi Bhiwandi ❤CALL GIRL 7870993772 ❤CALL GIRLS ESCORT SERVICE In Bhiwan...
Bhiwandi Bhiwandi ❤CALL GIRL 7870993772 ❤CALL GIRLS  ESCORT SERVICE In Bhiwan...Bhiwandi Bhiwandi ❤CALL GIRL 7870993772 ❤CALL GIRLS  ESCORT SERVICE In Bhiwan...
Bhiwandi Bhiwandi ❤CALL GIRL 7870993772 ❤CALL GIRLS ESCORT SERVICE In Bhiwan...Monika Rani
 
Zoology 5th semester notes( Sumit_yadav).pdf
Zoology 5th semester notes( Sumit_yadav).pdfZoology 5th semester notes( Sumit_yadav).pdf
Zoology 5th semester notes( Sumit_yadav).pdfSumit Kumar yadav
 
FAIRSpectra - Enabling the FAIRification of Spectroscopy and Spectrometry
FAIRSpectra - Enabling the FAIRification of Spectroscopy and SpectrometryFAIRSpectra - Enabling the FAIRification of Spectroscopy and Spectrometry
FAIRSpectra - Enabling the FAIRification of Spectroscopy and SpectrometryAlex Henderson
 
Selaginella: features, morphology ,anatomy and reproduction.
Selaginella: features, morphology ,anatomy and reproduction.Selaginella: features, morphology ,anatomy and reproduction.
Selaginella: features, morphology ,anatomy and reproduction.Silpa
 
Biogenic Sulfur Gases as Biosignatures on Temperate Sub-Neptune Waterworlds
Biogenic Sulfur Gases as Biosignatures on Temperate Sub-Neptune WaterworldsBiogenic Sulfur Gases as Biosignatures on Temperate Sub-Neptune Waterworlds
Biogenic Sulfur Gases as Biosignatures on Temperate Sub-Neptune WaterworldsSérgio Sacani
 
THE ROLE OF BIOTECHNOLOGY IN THE ECONOMIC UPLIFT.pptx
THE ROLE OF BIOTECHNOLOGY IN THE ECONOMIC UPLIFT.pptxTHE ROLE OF BIOTECHNOLOGY IN THE ECONOMIC UPLIFT.pptx
THE ROLE OF BIOTECHNOLOGY IN THE ECONOMIC UPLIFT.pptxANSARKHAN96
 
Cyanide resistant respiration pathway.pptx
Cyanide resistant respiration pathway.pptxCyanide resistant respiration pathway.pptx
Cyanide resistant respiration pathway.pptxSilpa
 
Chemistry 5th semester paper 1st Notes.pdf
Chemistry 5th semester paper 1st Notes.pdfChemistry 5th semester paper 1st Notes.pdf
Chemistry 5th semester paper 1st Notes.pdfSumit Kumar yadav
 
Thyroid Physiology_Dr.E. Muralinath_ Associate Professor
Thyroid Physiology_Dr.E. Muralinath_ Associate ProfessorThyroid Physiology_Dr.E. Muralinath_ Associate Professor
Thyroid Physiology_Dr.E. Muralinath_ Associate Professormuralinath2
 

Recently uploaded (20)

Factory Acceptance Test( FAT).pptx .
Factory Acceptance Test( FAT).pptx       .Factory Acceptance Test( FAT).pptx       .
Factory Acceptance Test( FAT).pptx .
 
Reboulia: features, anatomy, morphology etc.
Reboulia: features, anatomy, morphology etc.Reboulia: features, anatomy, morphology etc.
Reboulia: features, anatomy, morphology etc.
 
+971581248768>> SAFE AND ORIGINAL ABORTION PILLS FOR SALE IN DUBAI AND ABUDHA...
+971581248768>> SAFE AND ORIGINAL ABORTION PILLS FOR SALE IN DUBAI AND ABUDHA...+971581248768>> SAFE AND ORIGINAL ABORTION PILLS FOR SALE IN DUBAI AND ABUDHA...
+971581248768>> SAFE AND ORIGINAL ABORTION PILLS FOR SALE IN DUBAI AND ABUDHA...
 
LUNULARIA -features, morphology, anatomy ,reproduction etc.
LUNULARIA -features, morphology, anatomy ,reproduction etc.LUNULARIA -features, morphology, anatomy ,reproduction etc.
LUNULARIA -features, morphology, anatomy ,reproduction etc.
 
Atp synthase , Atp synthase complex 1 to 4.
Atp synthase , Atp synthase complex 1 to 4.Atp synthase , Atp synthase complex 1 to 4.
Atp synthase , Atp synthase complex 1 to 4.
 
Human genetics..........................pptx
Human genetics..........................pptxHuman genetics..........................pptx
Human genetics..........................pptx
 
Role of AI in seed science Predictive modelling and Beyond.pptx
Role of AI in seed science  Predictive modelling and  Beyond.pptxRole of AI in seed science  Predictive modelling and  Beyond.pptx
Role of AI in seed science Predictive modelling and Beyond.pptx
 
Climate Change Impacts on Terrestrial and Aquatic Ecosystems.pptx
Climate Change Impacts on Terrestrial and Aquatic Ecosystems.pptxClimate Change Impacts on Terrestrial and Aquatic Ecosystems.pptx
Climate Change Impacts on Terrestrial and Aquatic Ecosystems.pptx
 
Module for Grade 9 for Asynchronous/Distance learning
Module for Grade 9 for Asynchronous/Distance learningModule for Grade 9 for Asynchronous/Distance learning
Module for Grade 9 for Asynchronous/Distance learning
 
Bhiwandi Bhiwandi ❤CALL GIRL 7870993772 ❤CALL GIRLS ESCORT SERVICE In Bhiwan...
Bhiwandi Bhiwandi ❤CALL GIRL 7870993772 ❤CALL GIRLS  ESCORT SERVICE In Bhiwan...Bhiwandi Bhiwandi ❤CALL GIRL 7870993772 ❤CALL GIRLS  ESCORT SERVICE In Bhiwan...
Bhiwandi Bhiwandi ❤CALL GIRL 7870993772 ❤CALL GIRLS ESCORT SERVICE In Bhiwan...
 
Zoology 5th semester notes( Sumit_yadav).pdf
Zoology 5th semester notes( Sumit_yadav).pdfZoology 5th semester notes( Sumit_yadav).pdf
Zoology 5th semester notes( Sumit_yadav).pdf
 
FAIRSpectra - Enabling the FAIRification of Spectroscopy and Spectrometry
FAIRSpectra - Enabling the FAIRification of Spectroscopy and SpectrometryFAIRSpectra - Enabling the FAIRification of Spectroscopy and Spectrometry
FAIRSpectra - Enabling the FAIRification of Spectroscopy and Spectrometry
 
Site Acceptance Test .
Site Acceptance Test                    .Site Acceptance Test                    .
Site Acceptance Test .
 
Selaginella: features, morphology ,anatomy and reproduction.
Selaginella: features, morphology ,anatomy and reproduction.Selaginella: features, morphology ,anatomy and reproduction.
Selaginella: features, morphology ,anatomy and reproduction.
 
Biogenic Sulfur Gases as Biosignatures on Temperate Sub-Neptune Waterworlds
Biogenic Sulfur Gases as Biosignatures on Temperate Sub-Neptune WaterworldsBiogenic Sulfur Gases as Biosignatures on Temperate Sub-Neptune Waterworlds
Biogenic Sulfur Gases as Biosignatures on Temperate Sub-Neptune Waterworlds
 
THE ROLE OF BIOTECHNOLOGY IN THE ECONOMIC UPLIFT.pptx
THE ROLE OF BIOTECHNOLOGY IN THE ECONOMIC UPLIFT.pptxTHE ROLE OF BIOTECHNOLOGY IN THE ECONOMIC UPLIFT.pptx
THE ROLE OF BIOTECHNOLOGY IN THE ECONOMIC UPLIFT.pptx
 
PATNA CALL GIRLS 8617370543 LOW PRICE ESCORT SERVICE
PATNA CALL GIRLS 8617370543 LOW PRICE ESCORT SERVICEPATNA CALL GIRLS 8617370543 LOW PRICE ESCORT SERVICE
PATNA CALL GIRLS 8617370543 LOW PRICE ESCORT SERVICE
 
Cyanide resistant respiration pathway.pptx
Cyanide resistant respiration pathway.pptxCyanide resistant respiration pathway.pptx
Cyanide resistant respiration pathway.pptx
 
Chemistry 5th semester paper 1st Notes.pdf
Chemistry 5th semester paper 1st Notes.pdfChemistry 5th semester paper 1st Notes.pdf
Chemistry 5th semester paper 1st Notes.pdf
 
Thyroid Physiology_Dr.E. Muralinath_ Associate Professor
Thyroid Physiology_Dr.E. Muralinath_ Associate ProfessorThyroid Physiology_Dr.E. Muralinath_ Associate Professor
Thyroid Physiology_Dr.E. Muralinath_ Associate Professor
 

Modelling effects of food loss and waste mitigation measures on GHG emissions

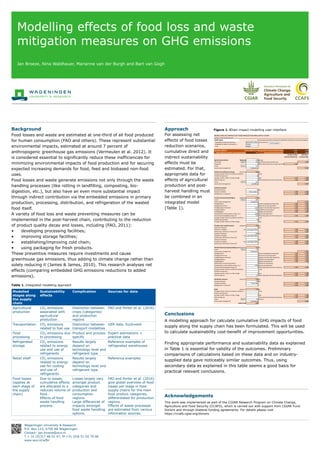
  • 1. Modelling effects of food loss and waste mitigation measures on GHG emissions Jan Broeze, Nina Waldhauer, Marianne van der Burgh and Bart van Gogh Background Food losses and waste are estimated at one-third of all food produced for human consumption (FAO and others). These represent substantial environmental impacts, estimated at around 7 percent of anthropogenic greenhouse gas emissions (Vermeulen et al. 2012). It is considered essential to significantly reduce these inefficiencies for minimizing environmental impacts of food production and for securing expected increasing demands for food, feed and biobased non-food uses. Food losses and waste generate emissions not only through the waste handling processes (like rotting in landfilling, composting, bio- digestion, etc.), but also have an even more substantial impact through indirect contribution via the embedded emissions in primary production, processing, distribution, and refrigeration of the wasted food itself. A variety of food loss and waste preventing measures can be implemented in the post-harvest chain, contributing to the reduction of product quality decay and losses, including (FAO, 2011): • developing processing facilities; • improving storage facilities; • establishing/improving cold chain; • using packaging for fresh products. These preventive measures require investments and cause greenhouse gas emissions, thus adding to climate change rather than solely reducing it (James & James, 2010). This research analyses net effects (comparing embedded GHG emissions reductions to added emissions). Approach Conclusions This work was implemented as part of the CGIAR Research Program on Climate Change, Agriculture and Food Security (CCAFS), which is carried out with support from CGIAR Fund Donors and through bilateral funding agreements. For details please visit https://ccafs.cgiar.org/donors. Acknowledgements For assessing net effects of food losses reduction scenarios, cumulative direct and indirect sustainability effects must be estimated. For that, appropriate data for effects of agricultural production and post- harvest handling must be combined in an integrated model (Table 1). Table 1. Integrated modelling approach Figure 1. Chain impact modelling user-interface. A modelling approach for calculate cumulative GHG impacts of food supply along the supply chain has been formulated. This will be used to calculate sustainability cost-benefit of improvement opportunities. Finding appropriate performance and sustainability data as explained in Table 1 is essential for validity of the outcomes. Preliminary comparisons of calculations based on these data and on industry- supplied data gave noticeably similar outcomes. Thus, using secondary data as explained in this table seems a good basis for practical relevant conclusions. Wageningen University & Research P.O. Box 123, 6700 AB Wageningen Contact: jan.broeze@wur.nl T + 31 (0)317 48 01 47, M +31 (0)6 51 02 79 06 www.wur.nl/wfbr Modelled stages along the supply chain Sustainability effects Complication Sources for data Agricultural production CO2 emissions associated with agricultural production Distinction between crops (categories) and production regions FAO and Porter et al. (2016) Transportation CO2 emissions related to fuel use Distinction between transport modalities GER data, EcoInvent Food processing CO2 emissions due to processing Product and process specific Expert estimations + practical data Refrigerated storage CO2 emissions related to energy use and use of refrigerants Results largely depend on technology level and refrigerant type Reference examples of refrigerated warehouses Retail shelf CO2 emissions related to energy use for cooling and use of refrigerants Results largely depend on technology level and refrigerant type Reference examples Food losses (applies at each stage of the supply chain) Due to losses, cumulative effects are allocated to a reduced volume of food. Effects of food waste handling process. Losses largely vary amongst product categories and production and consumption regions. Large differences of impacts amongst food waste handling options. FAO and Porter et al. (2016) give global overview of food losses per stage in food supply chains for the main food product categories, differentiated for production regions. Effects of waste processes are estimated from various information sources. MODELLING CO2 IMPACTS OF FOOD PRODUCTION AND SUPPLY CHAIN Jan Broeze, version 10 November 2017 CASE name Several impact estimates are based on GER data and data from EcoInvent database Geographical region (production) North Africa, West and Central Asia Geographical region (consumption) Europe Crop Grapes GLOBAL RESULT TOTAL ENERGY USE AND GHG IMPACT PER KG PRODUCED CROP: 10.45 1.122 CHAIN PRODUCT EFFICIENCY (KG SOLD/KG CROP) 0.59 TOTALS PER KG SOLD IN RETAIL: 17.63 1.894 Energy use (MJ) CO2-equiv. (primary equivalent) emissions (kg) Agricultural production Initial unit 1.00 kg crop CO2 impact 0.55 kg CO2eq per kg harvested crop 0.550 Energy use 0 MJ per kg crop (primary energy equivalent) 0.00 Losses 11% Losses waste management Combustion -0.015 Postharvest handling and storage product in 0.89 kg Average number of hours at ambient conditions 0 hours Ambient temperature 20 C Average number of days in refrig. storage 1 days 0.01 0.000 Other energy use 0 MJ per kg product (primary energy eq.) 0.00 0.000 Losses 11% Losses waste management Landfilling 0.079 Collection transport Transport distance 30 km Transport modality Truck, medium 0.09 0.006 Refrigeration in transport? 0 0.00 0.000 Primary processing and packaging product in 0.79 kg Losses 20% Losses waste management Composting -0.027 Packaging steel 0 kg steel packaging per kg product 0.00 0.000 Packaging aluminium 0 kg aluminium per kg product 0.00 0.000 Packaging paper and board 0.057 kg paper and board per kg product 0.90 0.036 Packaging plastics 0.04 kg plastics per kg product 2.01 0.076 Packaging glass 0 kg glass per kg product 0.00 0.000 Transportation means (pellets, crates, etc.) 0.036 kg tarra per kg product Processing and packaging energy use 0.07 MJ per kg product (primary energy eq.) 0.04 0.002 Average number of hours at ambient conditions hours Ambient temperature 20 C Average number of days in refrig. storage 1 days 0.01 0.000 (Possibly multi-modal) transport product in 0.63 kg Transport 1 distance 0 km Transport 1 modality Lorry, very larg (>32ton) 0.00 0.000 Ambient (0), chilled (1) or frozen (2)? 1 0.00 0.000 Transport 2 distance 5000 km Transport 2 modality Lorry, very larg (>32ton) 5.19 0.302 Ambient (0), chilled (1) or frozen (2)? 1 1.04 0.060 Transport 3 distance 0 km Transport 3 modality Lorry, very larg (>32ton) 0.00 0.000 Ambient (0), chilled (1) or frozen (2)? 1 0.00 0.000 Distribution/processing/repackaging centerproduct in 0.63 kg Losses 1% Losses waste management Combustion -0.001 Packaging steel 0 kg steel packaging per kg product 0.00 0.000 Packaging aluminium 0 kg aluminium per kg product 0.00 0.000 Packaging paper and board 0 kg paper and board per kg product 0.00 0.000 Packaging plastics 0 kg plastics per kg product 0.00 0.000 Packaging glass 0 kg glass per kg product 0.00 0.000 Adding water to processed product 0 kg water per kg product Transportation means (pellets, crates, etc.) 0.036 kg tarra per kg product Processing and packaging energy use 0 MJ per kg product (primary energy eq.) 0.00 0.000 Average number of hours at ambient conditions hours Ambient temperature C Average number of days in refrig. storage 2 days 0.01 0.001 Other energy use 0.1 MJ per kg product (primary energy eq.) 0.06 0.003 Distribution transport product in 0.62 kg Transport distance 100 km Transport modality Truck, large 0.20 0.012 Refrigeration in transport? 1 0.04 0.002 Retail product in 0.62 kg Average number of hours at ambient conditions hours Ambient temperature C Average number of days in refrig. storage 2 days 0.83 0.039 Other energy use MJ per kg product (primary energy eq.) 0.00 0.000 Losses 5% percent Losses waste management Composting -0.005 product sold 0.59 confirmregions Reset Reset Reset Reset Reset Reset