Download to read offline
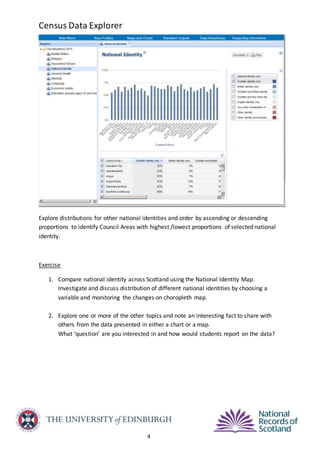
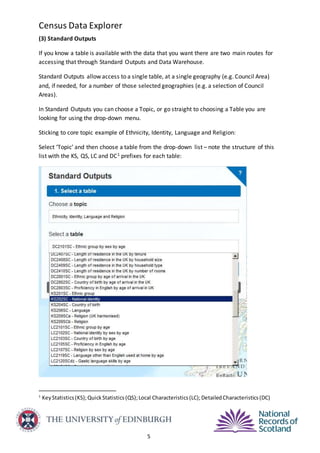
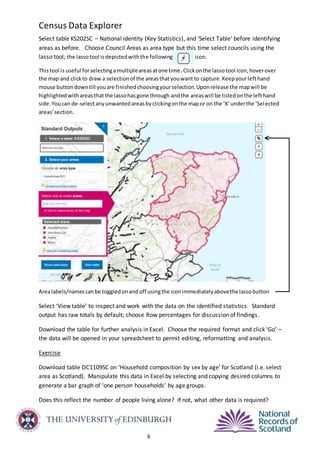

This document provides instructions for using the Census Data Explorer tool to access and analyze census data for different geographic areas in Scotland. It describes how to generate area profiles, maps, charts, and standard outputs comparing demographic data across different regions, council areas, and other geographic units. Examples are given for comparing national identity data across areas and generating graphs of household composition from census tables.


