Download to read offline
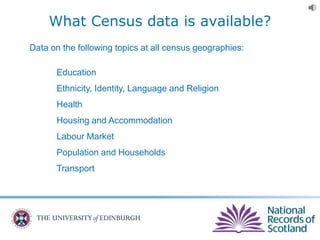
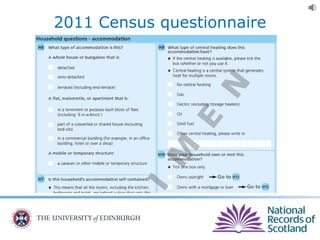
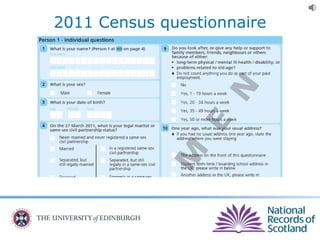

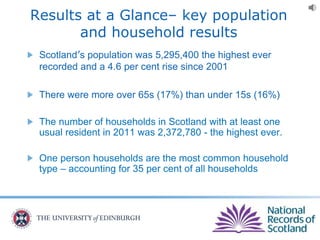
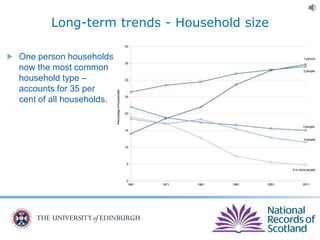

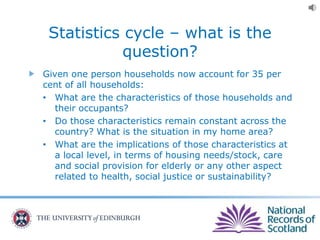
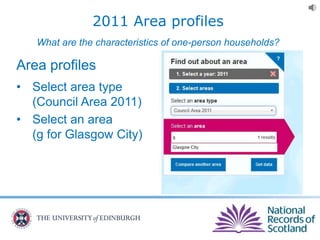
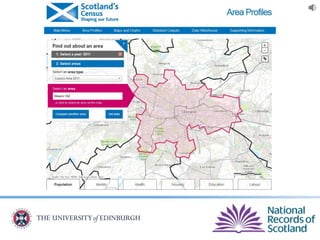
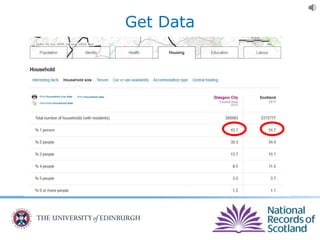
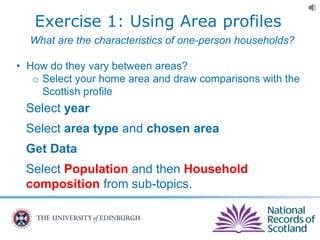
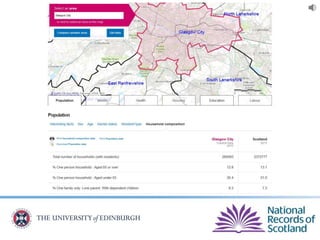
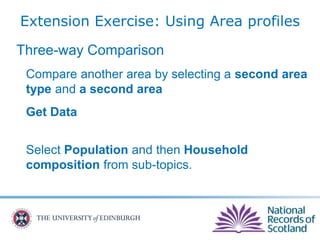
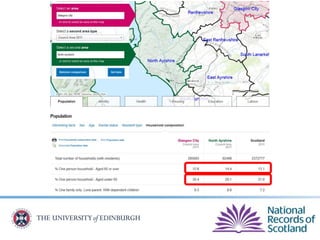
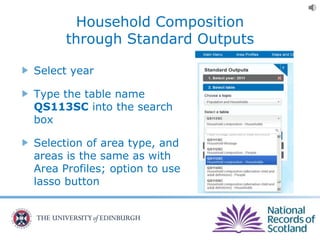
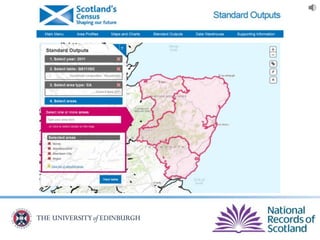
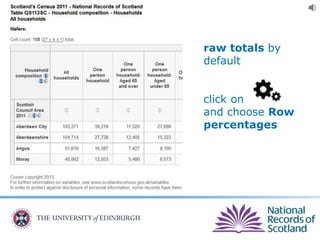
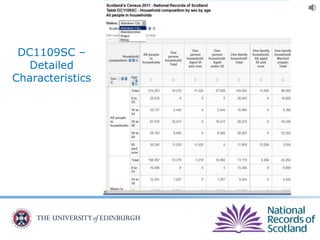
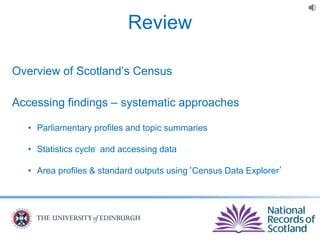

The document provides an overview of Scotland's census, emphasizing the importance of census data in understanding population dynamics, including education, ethnicity, health, and housing. It highlights key findings from the 2011 census, such as the increase in the population and the prevalence of one-person households. Additionally, it outlines systematic approaches for accessing census data, including use of the 'census data explorer' and various statistical techniques.


