This document contains summaries from three presentations on data-driven communication:
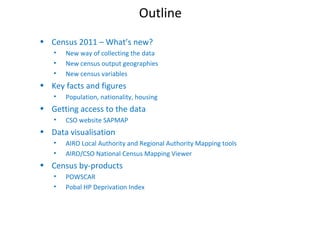
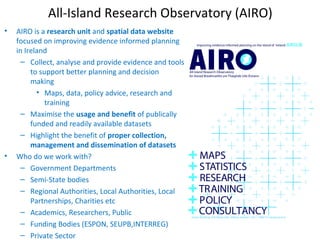
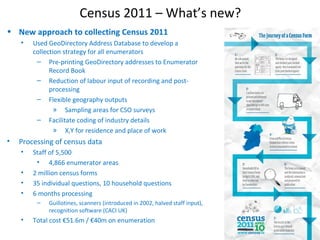
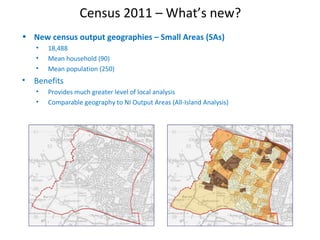
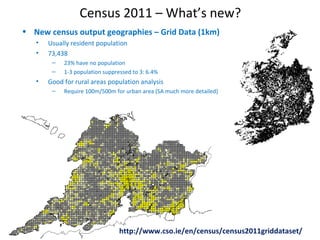
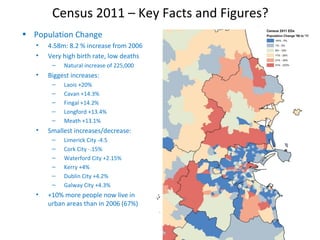
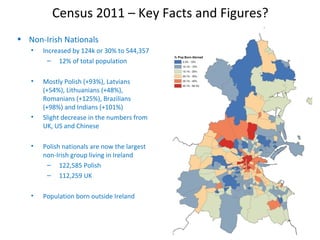
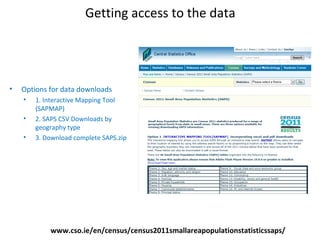
1. Justin Gleeson from NIRSA discussed the 2011 Irish Census, including new small area geographies, variables on languages, health, and place of work/school. Key facts showed population growth of 8.2% and a 30% increase in non-Irish nationals, led by Poles.
2. Brendan Sheridan from Experian discussed using customer insight.
3. Edel McCabe from PublicisD discussed targeting and segmentation.