Download to read offline
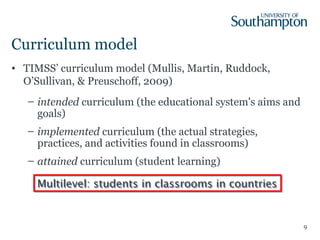
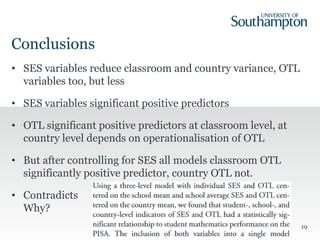

This document summarizes a study examining the relationship between students' socioeconomic status (SES), opportunity to learn (OTL) mathematics content, and achievement on the 2011 Trends in International Mathematics and Science Study (TIMSS) assessment. The study used multilevel modeling of TIMSS data from over 280,000 8th grade students in over 11,000 classrooms across 50 countries. Results showed that both SES and two measures of classroom-level OTL positively predicted student achievement, while country-level OTL measures showed mixed effects depending on the operationalization of OTL. Controlling for SES, classroom OTL remained a significant positive predictor of achievement but country-level OTL did not.