Download to read offline

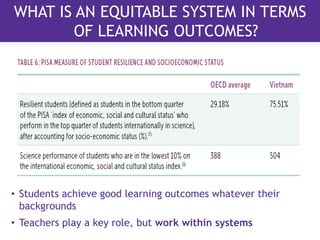


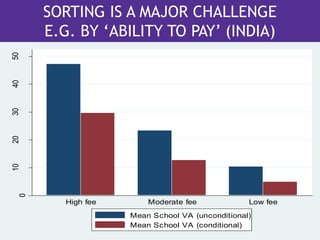


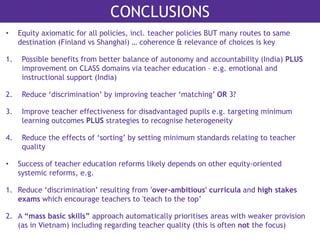


The document discusses the Young Lives international study, which assesses equitable learning outcomes in four countries. It highlights that education systems often exacerbate inequalities, particularly affecting disadvantaged students, and contrasts education methods in Vietnam, which promote equitable outcomes, with those in India and Peru. Key recommendations include improving teacher quality and reducing systemic discrimination to achieve equitable education across diverse backgrounds.


