
Recommended
Recommended
More Related Content
Similar to PAGE 1 s We ground our initial BUY rating f.docx
Similar to PAGE 1 s We ground our initial BUY rating f.docx (20)
More from bunyansaturnina
More from bunyansaturnina (20)
Recently uploaded
Recently uploaded (20)
PAGE 1 s We ground our initial BUY rating f.docx
- 1. PAGE 1 s We ground our initial BUY rating for Energy Development Corporation (EDC) on its favorable business environment and organic growth strategies on top of stable, recurring cash flows. Using a WACC of 10.7% to discount its FCFF and deducting the market value of debt, we arrive at an intrinsic value of Php 6.30, a 47.1% upside from its current share price. Revenues up 16.9% due to newly acquired plants. The successful acquisition and turnover of the Tongonan (112.5 MW) and Palinpinon I and II (192.5 MW) plants last September 2009 for USD 220M (Php 10.75B) coupled with planned improvements to increase utilization rates are expected to boost revenues by Php 4.8B in 2010. In addition, the company plans to build seven new plants to be completed from 2013 to 2021. We
- 2. expect the three plants commencing operations from 2013 to 2015 alone to increase revenues by Php 4.0B or 13.0% in 2016. Core operations in green energy to address power crisis. EDC’s core business of generating green, cheap and sustainable energy places it at the forefront of meeting the projected Philippine electricity shortage. We foresee the steady growth of energy demand at 2.4% per year and shortfall in industry exploration to spark an energy crisis by 2011. While new entrants have begun penetrating the industry, we believe the company’s vertically- integrated operations give it an edge to withstand competition. Php 3.7B savings in 2010 as Renewable Energy Law (RE) takes effect. Passage of the RE Law allows EDC to take advantage of lower corporate income tax rates of 10.0%, a seven-year income tax holiday for new plants and reduced royalty fee payments of 1.5% of gross revenues. Foreign currency exposure down 49.5% to Php 11.3B by 2010. The company’s reduced exposure to foreign currency denominated loans will be achieved through its Peso debt issuances in 2009 and maturity of Php 12M Miyazawa II Yen bond in 2010. We believe this reflects the
- 3. company’s effort to manage its exchange rate risk after a Php 9.3B foreign exchange loss in 2008 nearly wiped out profits. Other risks are expected to be mitigated through the company’s fundamental strengths and strategies. Defensive play with Php 11.1B recurring cash flows. The company’s stable, recurring cash flows establish it as a defensive play. This is reflected in its solid stock market performance amidst volatile economic conditions. Market Data 52‐week high (Php) 4.95 52‐week low (Php) 1.82 Previous close (Php) 4.30 Market cap (Mil Php) 79,688 Outstanding shares (Mil) Free float (%) 18,750 60.0 EPS (31 Dec 08) 0.07 Trailing P/E Ratio (X) 10.4 Sources: PSE, EDC, Team estimates FORECAST SUMMARY 2007 2008 2009E 2010E 2011E 2012E 2013E 2014E Php Millions Revenues 19,001 20,527 28,635 33,550 37,043 36,777 36,410 38,089
- 4. EBITDA 10,283 11,841 15,551 17,426 19,109 18,885 19,254 19,755 Net Income 8,768 1,345 10,745 11,326 12,361 11,782 11,659 12,079 Php Per Share Net Income 0.47 0.07 0.57 0.60 0.66 0.63 0.62 0.64 Dividends 0.08 0.28 0.51 0.18 0.40 0.69 0.61 0.58 Returns (%) Total Equity 28.33 4.25 36.60 33.37 30.62 27.88 27.90 28.42 Source: Company data, Team estimates Target Price (Php): 6.30 Price, 04 Dec 09 (Php): 4.30 Upside (%): 47.1 Rating BUY Share Price Movement ENERGY DEVELOPMENT CORPORATION Philippine Utilities PSE Ticker: EDC Full Steam Ahead 794 1,294 1,794 2,294
- 5. 2,794 3,294 3,794 1.0 1.5 2.0 2.5 3.0 3.5 4.0 4.5 5.0 04 ‐D ec ‐0 8 04 ‐F eb ‐0 9 04 ‐A p r‐ 09 04
- 6. ‐J u n ‐0 9 04 ‐A u g‐ 09 04 ‐O ct ‐0 9 04 ‐D ec ‐0 9 EDC PSEi Source: PSE PAGE 2 Business Description
- 7. EDC is the largest producer of geothermal energy in the Philippines. It is primarily engaged in generating steam and electricity for sale to various distributors through its operations of steam fields and power plants in five geothermal service contract areas. Incorporated in 1976, EDC is formerly a wholly-owned subsidiary of Philippine National Oil Company (PNOC), a Government Owned and Controlled Corpora- tion (GOCC). It held its Initial Public Offering (IPO) in December 2006. The company was fully privatized in November 2007 when Red Vulcan Holdings Corporation, a First Gen (FG) subsidiary, acquired a 60.0% controlling interest. The company generates revenues from electricity sales (geothermal and hydroelectric), steam sales, and third-party geothermal and drilling services. Serving as the backbone of the company’s operations are two steam fields servicing National Power Corporation (NPC) power plants with a capacity of 150 MW, and 10 geothermal power plants and related steam fields with a total installed capacity of 1,049 MW. EDC is also venturing into other renewables through its recent acquisition of a 60.0% stake in FG Hydro, which operates the 112.5 MW Pantabangan-Masi- way hydro plant in Nueva Ecija.
- 8. Industry Analysis WIDE PROSPECTS FOR GEOTHERMAL ENERGY The Pursuit of Clean and Sustainable Energy The pressing threats of climate change and fossil fuel depletion have shifted the world’s focus to renewable sources of power, one of which is geothermal energy. Geothermal energy has become increasingly attractive for several reasons: (1) It is virtually inexhaustible due to its fundamental dependence on the earth’s natural supply of heat and water; (2) Geothermal power plants are among the most reliable generating plants, running on average at 90-98% of the time compared to coal-fired plants that run only 65-75% of the time; and (3) Despite the high upfront capital investments required to construct geothermal power plants, the levelized costs of geothermal plants are significantly lower than that of plants that run on fossil fuels and other renewables. As one of the cleanest and cheapest alternative sources of power, geothermal energy can be expected to play a major role in the global energy supply in the future. A Vast Pool of Untapped Potential Situated in the Pacific Ring of Fire, the Philippines has emerged as the second
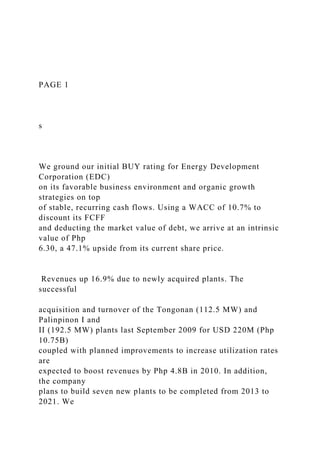
- 9. largest producer of geothermal power in the world. While geothermal power currently constitutes 18.0% of the country’s energy mix, the government estimates that less than half of the country’s geothermal resources have been tapped. Approximately 2,600 MW out of 4,500 MW of energy has yet to be explored. With electricity generation from geothermal sources growing at 5.0% per year, a rate more than twice that of the total energy industry in the Philippines, we see plenty of leg room for development of this resource. 50% 20% 12% 9% 5%4% Figure 1. Breakdown of 2008 Revenues Electricity (Geo) Steam Electricity (Hydro) Interest Income Construction Drilling
- 10. Table 1. Power Plants by Island Group Plant Grid Location Installed Capacity (in MW) 2008 Revenue (in Php billions) Luzon 150* 4.24_ Visayas 943_ 10.95_ Mindanao 106_ 1.16_ TOTAL 1,199_ 16.35_ *Steam field operations supplying to NPC‐owned plants Source: Company data 0 50 100 150 Solar Fuel cell Nuclear Hydro Coal Natural Gas Wind Geothermal USD per MWh Figure 2. Levelized Cost of Electricity in 2009
- 11. Levelized cost of electricity refers to the average cost of power production over the life of a plant. It considers: (1) upfront capital investments, (2) operating and maintenance costs and (3) fuel costs for plants that rely on external fuel sources. Source: Credit Suisse 32% 26% 18% 16% 8% <1% Figure 3. 2008 Philippine Energy Mix: Electricity Generated in GWh Natural Gas Coal Geothermal Hydro Oil‐based Other sources Table 2. Top 5 Countries in Installed Geothermal Capacity as of 2008 Country Geothermal Capacity in MW 1 USA 2,687 2 Philippines 1,976 3 Indonesia 992
- 12. 4 Mexico 953 5 Italy 810 Source: Geo Resources Council Bulletin Source: Department of Energy (DOE) Source: Company data PAGE 3 TIMELY GOVERNMENT INITIATIVES CREATE FAVORABL E ENVIRONMENT In light of the impending energy crisis, the government has been encouraging private investment in RE projects through various forms of legislation. Restructured Energy Market Opens Windows of Opportunity The passage of the Electric Power Industry Reform Act (EPIRA) set into motion the deregulation of the power industry and the privatization of NPC- owned enterprises. While transitioning into an open market introduces competition, we believe that the barriers to entry in the geothermal industry are sufficiently high to deter new players from making significant headway in the market. Instead, this restructuring has served as an opportunity for EDC to
- 13. expand and further vertically integrate its operations by purchasing NPC’s power plants available for bid. In 2008, EDC successfully won the bid for three power plants in Visayas – Tongonan, Palinpinon I and II – all of which are expected to boost revenues substantially beginning 2010. Another two power plants situated on an EDC steam field in Bacon-Manito (BacMan), Albay, will also be up for privatization in January 2010. Renewable Energy Plays Prominent Role in DOE Plans DOE has made it a top priority to lessen the country’s dependence on imported fuels as part of its thrust for 60.0% Philippine energy self- sufficiency by 2010. This has accelerated the development of indigenous renewable sources, creating a favorable environment for a pure-play company like EDC. By 2013, the government envisions the country to be the number one producer of geothermal energy in the world. It has set a target installation of an additional 1,200 MW of geothermal capacity, 50.0% or 610 MW of which is said to be situated within EDC contract areas. With the government aggressively bidding-out areas for exploration and providing generous fiscal and non-fiscal incentives for RE companies, EDC stands to gain from such favorable circumstances.
- 14. ECONOMIC FORCES DRIVING GROWTH MOMENTUM No Slowdown in Energy Consumption Driven by an annual 4.3% increase in GDP and a 1.5% growth in population, energy consumption is expected to increase steadily at approximately 2.4% every year up to 2030. We expect this trend to remain resilient to increases in oil prices and currency devaluations as energy demand has proven to be insensitive to sudden price hikes as long as economic activities measured by GDP continue to prosper. Power Shortage to Sweep the Nation Certain provinces in the Visayas are already experiencing rotating blackouts during peak hours because the supply of electricity in the region is not enough to meet demand. Demand is also expected to outpace supply in Mindanao by 2010 and in Luzon by 2011. Due to this disconnect between growing demand and a shortfall in exploration and retirement of decades-old plants, a power crisis is expected to sweep the nation in two years. EDC’s upgrades of existing power plants and new projects in Visayas and Mindanao are expected to benefit from this supply shortage. Soaring Oil Prices a Recipe for Disaster
- 15. With 54.0% of the country’s power relying on fossil fuels such as coal and oil, the rising oil prices and declining oil reserves will further aggravate the power crisis as these inputs are primarily sourced from other countries. If the government does not look for alternatives to rely on, this will spell the formula for a national energy crisis. With the increasing demand, shortfall in supply, and towering oil prices, EDC will become increasingly relevant as the Philippines looks to the company to increase the country’s installed capacity of renewable energy sources. 0 3,000 6,000 9,000 12,000 Geothermal Renewables Fossil Fuels
- 16. Installed Capacity (MW) Figure 5. RE vs. Fossil Fuels Development Targets As of 2007 2013 Target Table 4. Geothermal Plants for Privatization Year NPC asset Capacity (in MW) Winning Bidder 2007 Tiwi‐Makban 747.5_ Aboitiz 2009 Tongonan 112.5_ EDC 2009 Palinpinon I & II 192.0_ EDC 2010 BacMan I & II 150.0_ ‐ Source: Power Sector Assets and Liabilities Management Source: DOE 0 100 200 300 1990 1993 1996 1999 2002 2005 2008 Figure 4. Rebased Energy Demand
- 17. Energy Demand GDP Population Oil Price Exchange Rate Sources: BSP, NCSB, IMF, and DOE Table 3. Visayas Energy Demand and Supply Island Supply Demand and Reserves Excess (Deficit) Leyte 668_ 287_ 381__ Bohol 21_ 59_ ‐38__ Cebu 399_ 589_ ‐190__ Negros 185_ 263_ ‐78__ Panay 201_ 294_ ‐93__ Total 1,474_ 1,492_ ‐18__ Source: DOE PAGE 4 The enactment of EPIRA also led to the creation of a Wholesale Electricity Spot Market (WESM) in Luzon in 2006. Prior to WESM, a large portion of all electricity produced was sold solely to NPC at pre-determined prices. WESM
- 18. now provides for two different mechanisms for generation companies to sell electricity to private distributors: spot market or bilateral contracts. In the spot market, energy sources are dispatched according to cost, from lowest to highest, until electricity demand is satisfied. The low generating cost of geothermal energy puts it at the forefront of the dispatch mechanism during non-peak hours and second during peak hours. Generation companies can also opt to enter into bilateral contracts with private entities in which prices and volumes are negotiated six months prior to delivery. This ensures a stable supply of electricity and relatively fixed prices for distributors. By virtue of geothermal energy’s low cost, both mechanisms practically guarantee that all geothermal energy produced is sold. Pricing however, may slightly differ as energy sold in the spot market is priced at market clearing price (the price of the last energy dispatched, usually oil- based), while contract prices are based on effective grid rates for electricity. Either way, both rates are at a significant premium to the cost estimate of geothermal energy. Renewable Energy Law Reinforces Government Commitment
- 19. The recent RE Act is expected to accelerate the exploration and development of geothermal resources in the Philippines through the reduction of taxes and fees remitted to the government. Such fiscal incentives create an attractive business environment for EDC to operate in the years to come. Company Analysis STRONG HEAD START AND EXPERTISE TO WITHSTAND COMPETITION With over 30 years of experience, EDC is in a prime position to maximize the benefits of the growing energy demand and favorable legislation. Alongside other global industry leaders such as Ormat, Chevron, Enel, and Calpine, EDC is the only Philippine company to have achieved full vertical integration from the development to the operation of steam fields. This gives EDC nationwide economies-of-scale, which fortifies a significant barrier-to-entry against new players. In addition, it has solidified its position as the only com- pany in the Philippines to have a business portfolio covering geothermal steam fields and power plants. FACILITY UPGRADES IMPROVE PLANT UTILIZATION Currently, 58.0% of the company’s facilities, equivalent to 694.4 MW installed capacity, are operating at high utilization rates ranging from 87.7% to 97.0%.
- 20. EDC is continuously undertaking facility upgrades to improve efficiency and increase output: Php 65.4M Leyte Steam Augmentation was completed in 2009 Q1; augmentation projects are lined up for the Northern Negros facility; and upgrades of the newly-acquired Tongonan and Palinpinon I and II power plants are planned for 2010. Table 5. Energy Sources Ranked by Cost Energy Source Cost Estimate (Php per kWh) Hydroelectric 2.72 Geothermal 3.47 Coal 4.23 Natural gas 4.36 Oil‐based 5.82 Source: UP College of Engineering
- 21. Table 6. Changes Effected by the RE Law Existing Legislation RE Law Tax rate 30% 10% Income tax holiday 6 years as pioneer, 4 years as non‐pioneer, plus one bonus year 7 years from commercial operation Royalty fees 60.0% of gross values or 6.0% of gross income 1.5% of gross income Source: Renewable Energy Act of 2008 Table 7. Philippine Geothermal Industry Players Player Steam Field Power Plant EDC Yes Yes Chevron Yes No Aboitiz No Yes Source: DOE
- 22. Figure 7. Global Industry Players Classified According to Scope of Operations R&D Exploration Drilling Confirmation Engineering Construction O&M EDC (PH), Ormat (US), Chevron (US), Enel (IT), Calpine (US) PT Pertamina (ID), Reykjavik Energy (IS) Boart Longyear (US), Halliburton (US) Sumitomo (JP), Shaw Group (US) Govt/Univ Labs (All) Iceland Drilling Co. (IS), Baker Drilling (US), Parker Drilling (US), ThermaSource (US), GeothermEx (US) Siemens (DE), Enex (IS) Mannvit (IS), Power Eng (US) MHI (JP), GE (US), Fuji (JP), UTC Source: New Energy Finance, 2008 DE: Denmark | ID: Indonesia | IS: Iceland | IT: Italy | JP: Japan | PH: Philippines | US: United States 0% 20%
- 24. O ct N o v D ec Figure 6. 2008 Luzon Generation Mix Oil Nat Gas Coal Geo Hydro Source: WESM Annual Report PAGE 5 GROWING OPERATIONS TO MEET ENERGY DEMAND In 2009, EDC increased its installed capacity through the transfer of the Mindanao I and II Build-Operate-Transfer (BOT) plants and the former NPC- owned Tongonan, Palinpinon I and II plants. Seven new projects are in the
- 25. pipeline to meet the projected growth in electricity demand and are expected to strengthen the company’s position in the open market ahead. Aside from these, the company’s other growth potentials are its targeted expansion in drilling services, initial foray into the global arena with its satellite office in Indonesia and wind project in Ilocos Norte. SUSTAINABLE FUTURE FOR EDC AND THE COMMUNITY Aside from being a pure play renewable energy company, EDC extends its dedication to social and environmental development through its various projects. It recently bagged the Grand Anvil Award for its “Harmonizing Environment and Technology” communication plan regarding its steam augmentation project at the buffer zone of the Mt. Kanlaon Natural Park. FINANCIAL STABILITY GROUNDS EDC ON SOLID PLATF ORM Seven out of ten EDC power plants are still operating under minimum take-or- pay arrangements, thus giving short- to medium-term stability on the company’s cash flows. The recent Aaa-rated Php 12B oversubscribed bond offering in November 2009 highlights strong investor confidence. In the second quarter of 2009, EDC also declared a 25.0% common stock dividend
- 26. increasing its outstanding shares from 15B to 18.75B. It also increased the authorized capital from Php 15B to Php 30B. Financial Analysis NEW PLANTS AND IMPROVEMENTS SPARK REVENUE GR OWTH Company revenues are expected to grow steadily at 5.9% over the next five years behind rising billed energy volume. This rises primarily with capacity expansion as energy demand far exceeds supply. The recent acquisition of the Tongonan-Palinpinon plants (305 MW) and planned capital expenditures to improve their efficiency are expected to boost revenues by Php 4.8B or 16.9% in 2010. Plans to improve utilization rates, such as the Leyte Augmentation Project (60 MW) among others are also expected to supplement this. Although there is a slight slowdown in revenue growth in 2012 due to the expiration of some take-or-pay agreements, new geothermal power plants in Nasulo (20 MW), Tanawon (50 MW) and Mindanao (50 MW) are expected to more than offset this with revenues of Php 4.0B or 13.0% in 2016. These projects keep EDC at the forefront of meeting the growing energy demand in the country. LOW‐COST STRUCTURE BOOSTS MARGINS Operating costs of geothermal energy are expected to remain
- 27. low relative to other energy sources. Major components of these costs include personnel costs and repairs and maintenance. EBIT margins are projected to remain stable at an average of 50.0%. In addition, fiscal incentives through the RE Law are projected to increase net profits by a total of Php 3.7B in 2010 from the special corporate tax rate of 10.0% and changes in royalty fee computations. STEADY CASH FLOWS KEEP EARNINGS QUALITY HIGH Healthy streams of operating cash flows of Php 14.2B to Php 19.0B are expected to be generated from operating income over the projection period. This is supported by an earnings quality ratio (OCF per EBIT) projected to remain at an average of 90.0% over the forecast period. These stable and recurring cash flows prove the value of the company’s earnings. Table 8. EDC Expansion Plans New Projects* Island Group Capacity
- 28. (MW) Target Full Operations Nasulo Visayas 20 2013 Tanawon Luzon 50 2013 Mindanao III Mindanao 50 2015 Rangas Luzon 40 2017 Kayabon Luzon 40 2018 Dauin Visayas 40 2019 South Leyte Visayas 40 2021 TOTAL 280 * All projects have completed the exploration stage and are currently undergoing development. Source: Company data ‐ 5 10 15 20 25
- 29. 30 2007 2008 2009E 2010E 2011E 2012E 2013E 2014E Figure 8. Revenues (Php B) Steam Existing Plants Tongonan‐Palinpinon Luzon Visayas Mindanao ‐ 10 20 30 40 2007 2008 2009E 2010E 2011E 2012E 2013E 2014E Figure 9. Profit Margins (Php B) Revenues EBIT Operating cash Net Profits The Grand Anvil Award is conferred by the Public Relations Society of the Philippines to outstanding public relations programs and tools designed and implemented in the past year. Source: Company data, Team estimates Source: Company data, Team estimates
- 30. PAGE 6 STRONG BALANCE SHEET EDC’s expansion plans are supported by a healthy cash position and a robust balance sheet. The current ratio is maintained at close to 1.00 to provide ample resources to satisfy current liabilities. The debt ratio is kept at close to 60.0%, a safe distance from the 70.0 to 30.0% debt ratio required by debt covenants. The maturity of the bullet Miyazawa II bond in 2010 will significantly reduce the debt level and provide the company with sufficient room to obtain fresh debt capital to finance future expansion plans. The recently approved increase in authorized capital from Php 15B to Php 30B is also expected to provide more room to obtain financing in future years. REDUCED FOREIGN CURRENCY EXPOSURE Since being privatized, the company’s foreign-currency denominated loans carried over from government ownership have resulted to heavy foreign exchange losses and substantial net income volatility. The company’s foreign exchange exposure will decline due to the Php 12B bond issuance and the
- 31. bullet maturity of the Miyazawa II Yen-denominated bond (approximately Php 12B) in 2010. The proportion of Peso-denominated loans in the debt financing mix will increase from 9.0% in 2008 to 68.7% in 2010, reducing vulnerability to foreign exchange losses. Valuation DISCOUNTED CASH FLOW MODEL Recurring Earnings Lead to Stable Cash Flows We projected EDC’s revenues on a per-plant per-year basis until 2031, when most Geothermal Service Contracts (GSCs) end. We used escalation factors to determine prices, while DOE projections, current market share data, plant capacities and utilization rates were applied to establish volume. We expect EDC to maintain its cost structure, driven mainly by revenues and asset acquisitions, except for some notable changes, such as the elimination of BOT fees. EDC enjoys strong recurring earnings and cash flows which put it on a defensive play against local macro fundamentals. 0% 20% 40%
- 32. 60% 80% 100% 2007 2008 2009E 2010E 2011E 2012E 2013E 2014E Figure 10. Foreign Currency Exposure USD JPY PHP KEY FINANCIAL RATIOS 2007 2008 2009E 2010E 2011E 2012E 2013E 2014E Turnover Receivables (X) 4.01 3.90 4.55 4.49 4.57 4.36 4.28 4.36 Fixed Assets (X) 1.26 1.16 1.11 0.90 0.84 0.74 0.68 0.66 Total Assets (X) 0.25 0.29 0.37 0.36 0.35 0.32 0.30 0.30 Profitability EBITDA Margin (%) 54.12 57.68 54.31 51.94 51.58 51.35 52.88 51.87 EBIT Margin (%) 52.84 54.48 51.91 47.84 47.47 47.16 47.19 46.40 Net Profit Margin (%) 46.15 6.55 37.52 33.76 33.37 32.04 32.02 31.71 Return on Assets (%) 13.44 15.83 18.96 17.39 16.72 15.01 14.25 13.79 Return on Equity (%) 28.33 4.25 36.60 33.37 30.62 27.88 27.90 28.42 Solvency Total Debt Ratio (%) 52.03 58.56 65.70 61.02 62.10 64.67 66.02 67.60 Long‐term Debt Ratio (%) 35.74 46.48 55.59 38.78 31.75
- 33. 29.22 25.27 20.76 Liquidity Interest Coverage (X) 6.27 5.20 6.37 4.61 4.45 3.99 3.82 3.87 Current Ratio (X) 1.33 0.87 1.02 1.28 1.18 0.84 0.71 0.59 Acid Test Ratio (X) 0.74 0.41 0.70 0.81 0.85 0.60 0.49 0.40 Per Share Data Recurring Earnings (Php) 0.25 0.57 0.62 0.62 0.67 0.64 0.63 0.65 Dividends (Php) 0.08 0.28 0.51 0.18 0.40 0.69 0.61 0.58 Book Value (Php) 1.84 1.53 1.59 2.02 2.28 2.22 2.23 2.30 Source: Company data, Team estimates Source: Company data, Team estimates PAGE 7 RE Law Savings Lift Price Target Under the RE Law, the company is entitled to a preferential tax treatment of 10.0% on income before taxes and lowered royalty fees of 1.5% of gross revenues. These fiscal incentives lift the intrinsic value by Php 2.83 or 128.0% over the target price arising from recurring earnings. New Plants Drive Value Further EDC plans to build seven new plants from 2013 to 2021 with a combined
- 34. annualized practical capacity of 472 GWh by 2014 and 1,887 GWh by 2031, leading to an upside of Php 1.29 or 58.0% of the base value from recurring earnings. This also takes into account the seven-year income tax holiday these plants enjoy because of the RE Law. Continued Operations into the Future Since EDC’s organic growth will roll out beyond 2014, we have projected its financial performance, position and cash flows year-on-year until 2031, when its GSCs expire. During construction from 2012 to 2021, its capital expenditures will take up as much as 3.6% of operating cash flows. We impute a terminal value by projecting 2031 cash flows into perpetuity considering the company’s continuing ownership and operation of its power plants. Only Php 0.87 or 13.8% of our current intrinsic value arises from the terminal value. The terminal growth assumption of 4.4% at 2031 for FCFF is based on the most recent 10-year growth of nominal GDP. We ground our BUY rating on the unique combination of these business environment opportunities and the company’s new projects. PRICE RELATIVE ESTIMATES EDC Standing Out Among Peers
- 35. Among Philippine utilities, EDC is most closely comparable to Aboitiz Power, which also engages in the renewable energy generation business. EDC’s P/E ratio, currently at 10.4x, lies close to Aboitiz’ 11.8x. Its P/E ratio also fares well against other Asian utilities. Although the company’s P/E of 10.4x is above the average of 7.3x for Asian energy companies, the company’s distribution of special cash dividends over regular dividends at 30.0% of recurring earnings provides a healthy return for investors and justifies its current price. All these support our BUY recommendation for the stock. (We use recurring earnings as a substitute for net profit as we believe this is a better indicator of projected performance.) Intrinsic Value VALUE DRIVERS FCFE DDM Value of Recurring Earnings 2.21 3.09 Preferential tax treatment 2.32 0.84 Lower royalty fees 0.51 0.40 RE Law Savings on Old Plants 2.83 1.24 Value of Old Plants with Savings 5.04 4.33 New Luzon plants 0.73 0.43 New Visayas plants 0.38 0.20 New Mindanao plants 0.18 0.08 Value Creation by New Plants* 1.29 0.71 CURRENT INTRINSIC VALUE 6.30 5.00
- 36. *Net of additional RE Law savings thereon Source: Team estimates Terminal Value Assumptions FCFF Growth Rate 4.40% WACC 10.49% Source: Team estimates VALUATION SUMMARY Total 2010E 2011E 2012E 2013E 2014E Operating cash flows 15,978 18,252 18,901 19,707 19,517 Capital expenditures ‐840 ‐676 ‐ ‐564 ‐204 Free cash flows to firm 15,138 17,576 18,901 19,143 19,313 FCFF from 2015E ‐ 2031E ‐ ‐ ‐ ‐ 186,140 Terminal value of FCFF ‐ ‐ ‐ ‐ 64,000 Future value of FCFF 15,138 17,576 18,901 19,143 269,453 WAVE cost of capital 9.93% 9.98% 10.44% 10.66% 10.64% Present value of FCFF 217,613 13,771 14,531 14,031 12,765 162,516 Debt issue (payment) ‐14,641 ‐5,974 ‐5,938 ‐7,922 ‐8,153 Debt from 2015E ‐ 2031E ‐ ‐ ‐ ‐ ‐63,418 Terminal value of debt ‐ ‐ ‐ ‐ ‐31,000 Future value of debt ‐14,641 ‐5,974 ‐5,938 ‐7,922 ‐102,571 WAVE cost of debt 6.72% 6.80% 7.65% 8.02% 7.98% Present value of debt ‐99,414 ‐13,719 ‐5,237 ‐4,761 ‐5,819 ‐69,879 Present value of FCFE 118,199 52 9,294 9,270 6,946 92,636 Shares outstanding 18,750 18,750 18,750 18,750 18,750 18,750 Present value per share 6.30 0.00 0.50 0.50 0.40 4.90 Peer Comparison as of 04 Dec 2009 Company PER (TTM)* PSR (TTM)
- 37. EDC 10.4x 3.9x US Utilities 15.6x 0.9x Asian Utilities 22.7x 0.2x Asian Energy Utilities 7.3x 0.6x Selected US Energy Utilities Ormat Technologies 29.8x 4.7x Calpine Corporation 89.2x 0.8x Chevron Corporation 12.8x 1.0x Selected Asian Energy Utilities HK Electric Holdings 12.0x 7.8x Electricity Gen Co. (TH) 5.6x 4.5x Selected Philippine Utilities Aboitiz Power 11.8x 3.7x Meralco 57.2x 1.3x Manila Water 13.2x 4.3x Source: Business Week, PSE *Recurring Earnings |TTM – Trailing 12 Months | PER – Price/Earnings Ratio | PSR – Price/Sales Ratio PAGE 8 Risks OPERATIONAL RISKS Open Market Welcomes Competition Creating an open-access energy sector poses a threat of increased competi- tion in the industry. We expect the company’s expertise and strong financial capabilities to equip EDC to win government contract bids in the future and provide a distinct advantage against new players.
- 38. Natural Occurrences Disrupt Plant Efficiency Past experience has shown that natural occurrences, such as typhoons and unfavorable geological incidents, could cause significant downtime and failure in affected plants. These could result in unforeseen drops in actual energy delivered. The current portfolio of widely-spread power plants, as well as an Enterprise Risk Management system, is expected to address this risk. Value Chain Bottlenecks Limit Energy Delivery Failure of external units in the value chain, such as the transmission lines, may taper delivered energy as supply is limited by the capacity of these units. The recent privatization of this sector will improve the coverage and dependability of its lines that should provide support to EDC’s growth strategies. Unsuccessful Exploration Projects Slow Growth While most of its exploration projects in the past have been successful, there is no guarantee for continued success. This could slow company growth. However, in the medium term, we believe this will not be a significant issue because EDC’s seven geothermal projects for 2011 to 2023 have already completed exploration.
- 39. Operational Failures Cause Downtime Each facility contributes significant amount of revenues. Labor and equipment problems may cause failure of one unit and significantly decrease earnings, such as the Php 356M loss incurred in 2008. EDC’s regular upgrades of its facilities are expected to lower this risk. Terrorist Attacks Threaten Plant Operations Terrorist or militant attacks can halt operations where steam fields and power plant operations are located. These may cause asset damage, temporary shutdown and loss of investor confidence. To mitigate this risk, EDC has adopted security measures in its plants to prevent armed hostilities. Price Relative Price Estimates Lie Close to Intrinsic Value We also use industry averages of price relative ratios to forecast 2010 target share price. Our intrinsic value of Php 6.30 derived from our FCFF model falls within the range of prices from Php 5.70 – Php 7.10 per share obtained from price relative estimates. This establishes the consistency and reliability of our intrinsic value estimates. Solid Stock Performance since IPO
- 40. Since its privatization in December 2006, EDC’s stock has performed well relative to the Philippine Composite. Its trading volume has been stable ever since its IPO despite the onset of the recent financial crisis. This is also reflected in the above-average performance compared to other Philippine and Asian utilities. Risks At A Glance Risk Mitigating Factor Increased competition with open‐market access EDC’s low cost structure, technical expertise and financial capacity equips it to win contract bids Natural occurrences may disrupt plant efficiency Widely spread portfolio of plant assets and Enterprise Risk Management system Inefficient transmission lines may reduce delivered energy Privatization of transmis‐
- 41. sion assets and integration of national grid increases reliability and efficiency Unsuccessful exploration projects Seven projects already in the pipeline until 2023 Labor and equipment instability Regular upgrades of facilities Terrorist attacks may cause asset damage and temporary shutdown Adoption of heightened security measures in high‐ risk areas NPC may default on take‐ or‐pay agreements EDC has never experienced such over the past 30 years and NPC obligations are backed by the government GSCs may not be renewed Expiration not until 2031
- 42. and EDC expertise to be basis for renewal Foreign currency loans may cause significantly high cash outflows when Peso depreciates EDC is now refinancing maturing foreign currency loans with Peso‐denomi‐ nated borrowings Existing loans may be refinanced at higher interest rate levels EDC faces minimal repay‐ ments in the next five years and its recent bond issue has been rated Aaa New administration can change existing policies Looming energy crisis ensures EDC’s major role Use of IFRIC 12 may not be proper given owner‐ ship of power plants Minimal effect on cash flows due to tax differences on earnings
- 43. Source: Team estimates Price Relative Ratios and Estimates TTM 2010E P/E 11.40x PhP 7.10 P/S 4.30x PhP 6.80 P/CF 7.60x PhP 6.40 P/BV 2.86x PhP 5.70 Source: Team estimates ‐ 50 100 150 200 250 0 0.5 1 1.5 2
- 44. 2‐Jan‐07 2‐Jan‐08 2‐Jan‐09 M ill io n S h ar es In d ex ed P ri ce PSEi EDC Price EDC Volume Source: PSE PAGE 9 CREDIT RISK | Possible NPC Default on Numerous Obligations Almost 60.0% of EDC’s installed capacity is still sold to the National Power Corporation (NPC) through take-or-pay agreements. The company may have to deal with NPC’s sudden default on its obligations. However,
- 45. through its 30 years of operations, EDC has never experienced such default. NPC obligations are also backed by the national government. . POLITICAL RISK | Political Instability Rattles Investors’ Confi dence Transition into the new administration after the May 2010 elections may pose instability issues. Changes in policy could hamper the company’s development or affect investor sentiment. Still, the looming energy crisis proves EDC’s role in the government’s plans despite the change in leadership. REGULATORY RISK | Contract Renewal Uncertainty Endangers Profit Stability Core operations have been profitable, a big part due to its steam field operations, which are subject to 20-year GSC granted by government. Upon expiration, renewal of the GSCs is not guaranteed. The expiration of most contracts though, is not until 2031 and we find the company’s strong track record and expertise to influence government to renew the contract with EDC. MARKET RISK | Potential Rise in Interest Rates Create Fundin g Risks
- 46. Considering its reliance on financing through borrowings, the company is exposed to the risk that it may be unable to obtain new loans to refinance existing loans at favorable interest rate levels. The company’s recent bond issuance that received Aaa rating, however, is proof of creditor trust in the company and should allow it to obtain relatively favorable interest rates in obtaining future debt financing. EXCHANGE RATE RISK | Foreign Currency Loans Cause Fluctuating Debt Repayments The company’s foreign-currency denominated loans, carried over from its prior operations as a GOCC, depict poor matching of cash inflows in pesos and outflows in Yen or Dollars. Hence, depreciation of the Peso relative to the Dollar or the Yen will significantly increase the Peso value of these obligations, leading to high and unpredictable cash outflows. To mitigate this risk, the company is actively securing more Peso-denominated loans and has been hedging its foreign currency exposures. ACCOUNTING RISK | EDC May Depart from IFRIC 12 EDC has adopted IFRIC Interpretation 12 – Service Concession Arrangements to account for its steam fields and power plants in line with its operations of the regulated energy value chain. However, we recognize the risk
- 47. of a sudden change in applicable accounting rule. Since the company owns the power plants and is not under the obligation of handing these back to the government, it may not qualify for IFRIC 12. While such treatment will have some effect on earnings, this is not expected to affect cash flows significantly. Scenario Analysis We consider the aforementioned risks in developing different scenarios to assess the vulnerability of the stock price to these market conditions. UPSIDE POTENTIAL UPON CONTRACT RENEWAL We look into the regulatory risk the company faces. In the base case, we assume that EDC’s contracts over the steam fields are not renewed after they expire in 2031. Here, EDC needs to source steam from a third party to supply its power plants. If the GSCs are renewed, the company will continue to produce steam internally and stands to gain an upside potential of 27.0% over the base case. SCENARIOS Non‐Renewal of GSC Renewal of GSC Steam 2031 Perpetual Electricity Perpetual Perpetual FCFE 6.30 8.00
- 48. DDM 5.00 5.60 Source: Team estimates PAGE 10 MINIMAL IMPACT OF NON‐IFRIC 12 ACCOUNTING POLIC Y We also consider the possibility that the company fails to meet the requirements of IFRIC 12. We do not foresee a significant effect on EDC’s intrinsic value as IFRIC 12 mainly covers the immediate recognition of noncash revenues upon construction. This is reflected in the minimal decrease in share price from Php 6.30 to Php 6.27 due to the minimal tax effects on earnings. INTRINSIC VALUE TO WITHSTAND NEGATIVE CONDITIO NS Finally, we test the financial consequences of certain risks through a scenario analysis of key variables. We observe a pessimistic case where we take into account a decrease in market share resulting from increased competition in the open market and low utilization rates due to plant shutdown or unforeseen
- 49. events. These variables are expected to take a toll on our revenue projections. These can be aggravated by unpredicted maintenance expenditures or labor problems, which substantially increase cash outflows. These operational issues could be coupled with an environment of currency depreciation and rising interest rates due to a rating downgrade of either the country or the company. An optimistic scenario of continued company dominance, high efficiency measures and favorable business climate has also been considered. This analysis gives a range of values which proceeds from a low of Php 4.80 per share to a high of Php 7.90. Under these circumstances, we maintain our BUY rating for EDC reflecting both the stability and potency inherent in its cash flows. SCENARIOS IFRIC 12 Non‐IFRIC 12 Steam 2031 2031 Electricity Perpetual Perpetual FCFE 6.30 6.27 DDM 5.00 5.02 Source: Team estimates Disclosures: Ownership and material conflicts of interest: The author(s) of this report does not hold a financial interest in
- 50. the securities of this company. The author(s) of this report does not know of the existence of an y conflicts of interest that might bias the content or publication of this report. Receipt of compensation: Compensation of the author(s) of this report is not based on inv estment banking revenue. Position as an officer or director: The author(s) does not act as an officer, director or advisory bo ard member of the subject company. Market making: The author(s) does not act as a market maker in the subject com pany‘s securities. Ratings guide: Banks rate companies as a BUY, HOLD or SELL. A BUY rating is given when the security is expected to deliver absolute return s of 15% or greater over the next 12 month period, and recommends that investors take a position above the security‘s weight in the Philippine Composite. A SELL rating i s given when the security is expected to de‐ liver negative returns over the next 12 months, while a HOLD ra ting implies flat returns over the next twelve months. Disclaimer: The information set forth herein has been obtained or derived fr om sources generally available to the public and believed by the author(s) to be reliable, but the au‐ thor(s) does not make any representation or warranty, express or implied, as to its accuracy or completeness. The information is not intended to be used as the basis of any investment decisions by any person or entity. This informati on does not constitute investment advice, nor is it an offer or a s olicitation of an offer to buy or sell any security. This report should not be considered to be a recommen dation by any individual affiliated with the CFA Philippines or t he Investment Research Challenge with regard to this company‘s stock.
- 51. RISKS DETAIL VARIABLE Optimistic Base Pessimistic Operational Open market Market share 5% ‐ (5%) Natural occurrences Utilization rates 5% ‐ (5%) Equipment failures Maintenance costs (5%) ‐ 5% Exchange Rate Foreign currency exposure Peso depreciation (5%) ‐ 5% Market Rising interest rates Interest costs (2%) ‐ 2% INTRINSIC VALUE (Php per share) 7.90 6.30 4.80 Source: Team estimates PAGE 11 APPENDIX APPENDIX A – FINANCIAL STATEMENTS STATEMENT OF PROFIT OR LOSS Php millions 2007 2008 2009 E 2010 E 2011 E 2012 E 2013 E 2014 E Electricity 11,509 12,518 18,158 23,647 24,633 24,392 27,522 28,309 Steam 4,521 4,242 4,850 1,696 3,196 3,424 1,227 1,301 Interest 2,237 2,108 1,970 1,706 1,556 1,449 1,336 1,216
- 52. Drilling 625 726 1,041 1,127 1,224 1,219 1,153 1,180 Construction 109 932 2,617 5,373 6,435 6,293 5,172 6,083 REVENUES 19,001 20,527 28,635 33,550 37,043 36,777 36,410 38,089 Service costs (3,111) (1,524) (1,646) (1,625) (1,765) (1,758) (1,777) (1,821) Construction (101) (804) (2,405) (4,938) (5,914) (5,783) (4,753) (5,590) Operations (3,079) (5,046) (6,272) (6,922) (7,514) (7,502) (7,678) (7,884) Administration (2,426) (1,313) (2,762) (2,639) (2,742) (2,848) (2,948) (3,039) EBITDA 10,283 11,841 15,551 17,426 19,109 18,885 19,254 19,755 Depreciation (244) (657) (687) (1,374) (1,525) (1,542) (2,070) (2,082) EBIT 10,039 11,183 14,864 16,051 17,584 17,343 17,184 17,673 Interest income 650 333 333 333 333 333 333 333 Interest expense (1,600) (2,153) (2,334) (3,483) (3,954) (4,349) (4,500) (4,570) Translation losses 3,996 (9,357) (939) (352) (272) (280) (230) (182) Other line items (148) 2,646 ‐ ‐ ‐ ‐ ‐ ‐ PRETAX PROFIT 12,937 2,653 11,924 12,549 13,690 13,047 12,786 13,254 Income tax (4,168) (1,308) (1,179) (1,223) (1,329) (1,265) (1,127) (1,175) NET PROFIT 8,768 1,345 10,745 11,326 12,361 11,782 11,659 12,079 STATEMENT OF FINANCIAL POSITION
- 53. Php millions 2007 2008 2009 E 2010 E 2011 E 2012 E 2013 E 2014 E Cash 3,297 957 5,471 2,485 6,600 6,506 6,143 6,331 Receivables 42,022 40,108 39,825 35,195 33,967 31,925 30,013 27,986 Inventories 1,141 1,563 1,941 1,955 1,966 1,958 2,577 2,744 Intangibles 11,329 11,883 24,837 32,824 38,120 43,418 47,053 51,601 Fixed assets 4,712 5,280 7,110 7,568 7,837 7,411 7,563 7,342 Exploration costs 1,172 1,000 1,466 10,460 17,805 20,000 23,155 30,301 Other assets 8,317 8,555 6,757 6,757 6,757 6,757 6,757 6,757 TOTAL ASSETS 71,990 69,346 87,408 97,244 113,052 117,976 123,262 133,061 Trade payables 4,243 3,065 5,599 9,920 15,457 20,840 26,115 30,906 Royalty fees 1,734 1,688 1,489 699 498 282 112 127 Long term debt 25,733 32,229 48,712 47,096 52,626 53,542 53,524 57,283 Other liabilities 5,748 3,628 1,628 1,628 1,628 1,628 1,628 1,628 TOTAL DEBT 37,457 40,610 57,427 59,343 70,209 76,291 81,379 89,943 Retained profits 13,172 9,978 11,164 18,687 23,388 22,304 22,547 23,772 Minority interest 3,345 1,484 1,543 1,941 2,182 2,108 2,063 2,072 Other equities 18,015 17,273 17,273 17,273 17,273 17,273 17,273 17,273 TOTAL EQUITIES 34,532 28,735 29,981 37,901 42,843 41,685 41,883 43,118
- 54. TOTAL CAPITAL 71,990 69,346 87,408 97,244 113,052 117,976 123,262 133,061 PAGE 12 APPENDIX B – DISCOUNT RATE ASSUMPTIONS ASSUMPTIONS VARIABLE VALUE REFERENCE EQUITY FINANCING Levered beta 1.13 Group's calculations using market data ‐ Jan 2007 to June 200 9 Riskless return 9.25% 03 Nov 2009 auction for 25‐year on‐the‐run Treasury Bond Market return 12.86% Group's calculations using market data ‐ Jan 1987 to June 200 9 Terminal growth 4.40% International Monetary Fund, CAGR from 1999 to 2008 DEBT FINANCING Pretax cost of debt 8.64% 12 Nov 2009 final prospectus for 5.5‐year Fixed Rate Bonds New tax rate 10.00% RA 9513 ‐ Renewable Energy Act of 2008 Historical tax rate 30.00% PD 1158 as amended ‐ National Internal Revenue Code of 199 7 LT Debt‐to‐equity 1.22 30 Sep 2009 Quarterly Report ‐ Note 34 on Capital Manageme nt
- 55. STATEMENT OF CASH FLOWS Php millions 2007 2008 2009 E 2010 E 2011 E 2012 E 2013 E 2014 E Cash revenues 21,857 24,244 26,308 29,457 31,837 32,526 32,524 33,866 Cash expenses (10,396) (18,300) (12,918) (16,524) (17,776) (18,086) (17,191) (18,173) ST financing (1,058) (1,508) 839 3,044 4,191 4,461 4,374 3,824 CORE CFO 10,403 4,436 14,229 15,978 18,252 18,901 19,707 19,517 Exploration costs 462 264 (348) 277 ‐ 143 143 145 Fixed assets (183) (1,073) (2,128) (840) (676) ‐ (564) (204) Intangibles (109) (932) (10,747) (277) ‐ (143) (143) (145) CORE CFI 170 (1,741) (13,223) (840) (676) ‐ (564) (204) Loan principals (9,843) (528) 13,421 (11,158) (2,019) (1,589) (3,422) (3,583) Dividends (1,485) (5,303) (9,499) (3,405) (7,419) (12,940) (11,461) (10,844) Interest (1,170) (1,825) (2,334) (3,483) (3,954) (4,349) (4,500) (4,570) CORE CFF (12,498) (7,656) 1,587 (18,046) (13,393) (18,878) (19,383) (18,997) Translation effect (8) 2 122 (78) (68) (116) (123) (128) Other line items (4,770) 2,619 1,798 ‐ ‐ ‐ ‐ ‐ CASH INC (DEC) (6,703) (2,339) 4,514 (2,986) 4,115 (93) (363) 188
- 56. PAGE 13 APPENDIX C – CONTRACTS The power industry has long been regulated by the government, resulting in several long‐term contractual arrangements existing between EDC and various government entities. Two particular k inds of contracts significantly affect the company’s operations: (1) GSCs give EDC the right to extract steam from steam fields (als o known as geothermal service areas) for a period of 25 years. In return, EDC remits to the government royalty fees com puted based on a percentage of steam sales. The last of these contracts will expire by 2031 and we assume that they will not be renewed for our base case. (2) Sales agreements with NPC, a government‐owned and controlle d corporation, impose pre‐determined prices and volumes with regard to EDC’s steam and electricity sales. These agreeme nts however, are slowly being replaced by bilateral con‐ tracts and spot market sales to private companies as part of the privatization of the energy industry. The table below illu‐ strates the transition from EDC’s current contracts with NPC to spot market contracts which it plans to enter into in the fu‐ ture. SALES CONTRACTS OF EDC
- 57. Field or Plant Present ‐ 2012 2013 ‐ 2022 2023‐2024 2025 ‐ 2031 Tongonan Bilateral Contracts*** Unified Leyte Electricity Sales Agreement* Bilateral Contracts*** Northern Negros Electricity Sales Agreement** Bilateral Contracts*** Palinpinon I Bilateral Contracts*** Palinpinon II Bilateral Contracts*** BacMan I Steam Sales Agreement* BacMan II Steam Sales Agreement* Mindanao I Electricity Sales Agreement* Bilateral Contracts*** Mindanao II Electricity Sales Agreement* Bilateral Contracts*** *With NPC **With private cooperatives ***EDC’s stated pre ference over spot sales Source: Company data Eberhardt Student Investment Fund
- 58. Company Name (Ticker): Sumitomo (SMFG) Country: Japan Sector/Industry: Financials Stock Exchange (NASDAQ and NYSE ONLY): Your group members: Date: Step 1: Search for Country and Industry Information · CIA World Factbook: https://www.cia.gov/library/publications/the-world-factbook/ · World Bank Open Data: https://data.worldbank.org/ · Country credit rating: http://www.tradingeconomics.com/country-list/rating · World Bank Doing Business Survey database http://www.doingbusiness.org/data · Country governance and corruption: http://www.transparency.org/ · World Investment Report: http://unctad.org/en/pages/PublicationWebflyer.aspx?publicatio nid=1782 · Due date to decide the country and industry: October 13, 2017 (Friday) Step 2: Screen for ADRs · Based on your country and industry/sector research above, screen the ADRs in the country and industry/sector · Website:https://www.adr.com/Investors/Markets · Due date to decide your ADR company:November 17, 2017 (Friday)
- 59. Step 3: Search for company filings and financials · Search for ADR company’s annual reports (in English) and financial data · EDGAR website: https://www.sec.gov/edgar/searchedgar/companysearch.html · Yahoo.finance website: https://finance.yahoo.com/ · Bloomberg terminal (USD library): search for the company in Bloomberg equity function Step 4. Document your data and analyses in the following template, write up your research report · Final presentation: December 11 – 15, 2017 · Final research report due date: December 15, 2017 Company Description (Brief description of the company’s products and/or services) Country Research Explain why you choose to invest in this country or region. Try to collect data from various sources to address the following issues: · GDP growth in the last five years
- 60. · Political risk · Exchange rate policy and risk · Major exports and foreign investment in the country · Comparative advantage of certain industry/sector of the country · Economic outlook of the country (or region) · Any other relevant evidences to support your selection of the country Industry Overview and Competitive Positioning Briefly explain why you choose to invest in this industry and what is the competitive position of this company within the industry. · Industry economic growth and outlook · Industry export and foreign investments · Major competitors (domestic and international) · Entry barriers, key technology and resources, government policies of the industry · Relative power to the supplier and customer industries · Any other relevant evidences to support your selection of the industry Company analysis · Sales performance of current services or products · Strategic focuses and future directions · Market outlook ad new service/product developments · Competitive advantage of the company in the global economy · Key suppliers and customers · Recent financial performance and performance drivers Industry Competitive Analysis Discuss major competitors – how are they similar; how are they different. (Example from Entergy)
- 61. ETR AEP CNP SO Industry Market Cap: 23.08B 18.87B 5.35B 27.06B 3.31B Revenue: 11.20B 12.89B 9.54B 15.17B 2.94B Rev Growth: 5.40% 7.20% 10.30% 6.20% 7.10% Gross Margin: 30.54% 34.44% 21.79% 51.38% 30.50% Operating Margins: 16.43% 16.92% 11.56% 22.33% 12.89% Net Income Margin:
- 62. 6% 5% 4% 5.5% 4.5% EPS: 5.463 2.252 1.039 2.27 1.42 Earnings growth: 2% 3% 1% 0.3% 1.2% Dividend Payout (%): 20% 10% 30% 25% 22% P/E: 21.59 20.99 16.04 15.68 17.53 P /B: 2.5 1.3 4.3 2.3 3.3 Debt/Equity (%):
- 63. 100% 120% 80% 90% 95% Operating Cash Flow to Sales (%) 12% 13% 11% 14% 11% Assets Turnover 2.3 2.2 1.2 2.4 2.0 ROE (%): 12% 22% 13% 15% 16% Source: Yahoo.finance or Bloomberg Financial Performance Annual Performance (Fiscal year end: ) ($ millions) 2016 2015 2014 2013 2012 Revenue
- 64. Net Income Revenue growth (%) Gross profit margin (%) Operating profit margin (%) Net Profit Margin (%) Assets turnover
- 65. Debt / Equity (%) ROE (%) EPS Dividend Payout (%) P/E P/B
- 66. Operating Cash Flow to Sales (%) Data Source: Yahoo.finance or Bloomberg Discuss recent performance (strength and weakness) and future outlook Recent Stock Performance Discussion of performance over the past year relative to S&P, and the country or sector ETF performance. Recent News and Events Discuss the most important and recent news and events of the industry and the company that would affect the investment value of the company’s stock. · General Electric to Sell Commercial Lending Business in Japan · Dec. 15, 2015 HONG KONG - General Electric agreed to sell its commercial lending business in Japan to Sumitomo Mitsui Finance and Leasing, one of Japan’s largest leasing companies, for 575 billion yen, or about $4.8 billion. · Johnson & Johnson, Sumitomo Mitsui Financial Group, and Diebold Nixdorf Join Work-Bench as Enterprise-In-Residence Partners · Nov. 28, 2017 NEW YORK - Work-Bench, an enterprise technology venture fund in New York City, is excited to announce their three newest Enterprise-In-Residence Partners: Johnson & Johnson, a global pharmaceuticals company, Sumitomo Mitsui Financial Group (SMFG), Japan's leading financial services company, and Diebold Nixdorf, a global
- 67. financial and retail self-service, software and services corporation. · Introduction of new stock compensation · http://www.smfg.co.jp/news_e/e110061_01.html List environmental, social, or governance controversies that arise in the news bellow. · Japanese Banks Failing to Respond to Climate Change Risks, New Reports Finds · June 22, 2017 TOKYO — A report released today by four NGOs - Rainforest Action Network, BankTrack, Sierra Club and Oil Change International - revealed that the world’s biggest banks, including Japan’s three megabanks, are failing to respond to climate risks through their continued financing of extreme fossil fuels. · https://www.ran.org/mizuho_bank_presented_with_2017_irresp onsible_bank_japan_award_in_front_of_annual_shareholder_me eting· Investors Urge Banks to Support Re-routing Dakota Access Pipeline, Protect Water · February 17, 2017 BOSTON – A coalition of over 130 investors representing over $685 Billion in assets under management called on banks financing the Dakota Access Pipeline (DAPL) to address or support the Standing Rock Sioux Tribe’s request to reroute the pipeline and avoid their treaty territory. Lead investor Boston Common Asset Management is joined by Storebrand Asset Management and Calvert Research and Management, with support from First Peoples Worldwide— along with CalPERS and the Comptroller of the City of New York. In a statement today, the investors encourage the banks to take urgent action and arrive at a peaceful solution that is acceptable to all parties. · http://news.bostoncommonasset.com/banks-dapl/ · Japanese Banks ill-Equipped to Reform Banking Practices in Line with the Paris Agreement · Oct. 12, 2017 TOKYO - Japan has revealed how Japan’s seven
- 68. biggest banks are inadequately prepared to meet the rising demand for environmentally responsible banking practices. Six of seven banks responded with dissatisfying answers to the My Bank My Future petition which urged banks to stop funding fossil fuels and nuclear power in line with the Paris Agreement. · https://www.banktrack.org/news/japanese_banks_illequipped_to _reform_banking_practices_in_line_with_the_paris_agreement · Banks and Responsible Finance · Sustainalytics - Even those companies showing comprehensive programmes continue to be the target of severe criticism. BNP Paribas, Credit Agricole, HSBC, Royal Bank of Canada, SocGen, Standard Chartered and Sumitomo Mitsui Financial are banks that, despite having rolled out best-in-class lending standards, have been repeatedly cited by civil society groups for their financial transactions with the coal industry and the weapons producing sector. · https://www.cfaboston.org/docs/ESG/Sustainalytics%20- %20Banks_ResponsibleFinance.pdf Has the company been involved in litigation that might impact its share price? See the Annual Report’s litigation section. · SMFG is party to routine litigation incidental to the business, none of which is currently expected to have a material adverse effect on the financial condition or results of operations. However, there can be no assurance that an adverse decision in one or more of these lawsuits will not have a material adverse effect. · The SMFG Group is engaged in various legal proceedings in Japan and a number of overseas jurisdictions, involving claims by and against it, which arise in the normal course of business. The SMFG Group does not expect that the outcome of these proceedings will have a significant adverse effect on the consolidated financial statements of the SMFG Group. The SMFG Group has recorded adequate provisions with respect to litigation arising out of normal business operations. The SMFG
- 69. Group has not disclosed any contingent liability associated with these legal actions because it cannot reliably be estimated. · https://www.sec.gov/Archives/edgar/data/1022837/00011931251 7217355/d409110d20f.htm Valuation Model · A full Discounted Cash Flow (DCF) model is NOT required for this report. · A target price evaluation is NOT required for this report You could use the simplest evaluation methods, such as the comparable valuation multiples (P/E, P/B). If the company pays stable dividends, you could also use the dividend discount method. More sophisticated methods, such as the free cash flow to firm (FCFF) or free cash flow to equity (FCFE) methods can be also used (although not required) in this analysis. · Comparable valuation multiples (P/E, P/B). A valuation model will help investors to determine if is SMFG’s stock is a good buy. The valuation multiple is calculated by dividing stock price (P) by earnings per share (EPS). A company with a high P/E ratio is trading at a higher price per dollar of earnings than the industry and is overvalued. And a company with a low P/E ratio is trading at a lower price per dollar of EPS and is considered undervalued. · https://www.investopedia.com/terms/r/relative-valuation- model.asp · SMFG’s stock price is 8.17 with an Earnings Per Share of 0.892. This gives us a PE ratio of 9.15. · The Price-to-Book ratio is used to compare the stock market’s value to its book value. It is calculated by dividing the current closing price of the stock by the latest quarter’s book value per share where the book value per share is equals the difference between total assets and total liabilities divided by the total number of shares. SMFG’s current closing price of their is stock is $8.16 or. The total assets as of 2017, for the fiscal year ended
- 70. at March 31st is $1,715,436,000 while total liabilities is $1,622,262,000. Capital stock is $20,981,000. This would give us a book value per share of $4.44Price-to-Book ratio is roughly ¥181.71 or $1.61. Investment Risk Highlight the investment risk (if any) in the foreign country, industry and in the company’s ADR stock. Sector Outlook and Holding Update Page Page