Recommended

Recommended
More Related Content
What's hot
What's hot (20)
Similar to The Interaction of Polyfluorinated Compounds with Filter Media: Implications for Phase Partitioning Studies
Similar to The Interaction of Polyfluorinated Compounds with Filter Media: Implications for Phase Partitioning Studies (20)
Recently uploaded
Recently uploaded (20)
The Interaction of Polyfluorinated Compounds with Filter Media: Implications for Phase Partitioning Studies
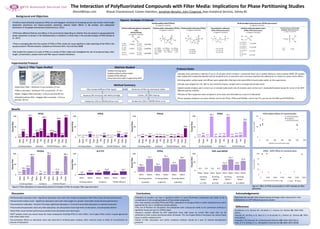
- 1. Bharat Chandramouli, Coreen Hamilton, Jonathan Benskin, John Cosgrove, Axys Analytical Services, Sidney BC The Interaction of Polyfluorinated Compounds with Filter Media: Implications for Phase Partitioning Studies Discussion Acknowledgements References Conclusions bharat@axys.com Figure 2: Filter Types Studied Figure1: Analytes of Interest •Glass Fiber Filter – Sterlitech 0.5 µm porosity, 47 mm •Teflon Laminated – Sterlitech 0.45 µm porosity , 47 mm •Nylon- Nalgene filter assembly – 0.45 µm porosity 90 mm •Polyethersulfone (PES) – Nalgene filter assembly – 0.45 µm porosity 90 mm •Polyfluorinated alkylated substances (PFAS) are anthropogenic chemicals of increasing concern due to their chain-length dependent persistence and bioaccumulation potentials, adverse health effects in lab animals, and widespread distribution in the global environment (Lindstrom et al., 2011) •PFAS have different lifetimes and effects in the environment depending on whether they are present in aqueous/particle phase. Separation of phases in the field/laboratory is therefore a critical step in the accurate analysis of PFAS (Houde et al., 2011) •There is emerging data that the sorption of PFAS on filter media can cause significant under-reporting of the PFAS in the aqueous phase In filtered samples. (Labadie and Chevreuil 2011, Arp and Goss 2008) •We studied the sorption of a suite of PFAS on a variety of filter media and investigated the role of compound type, chain length, concentration, sample matrix and filter type on sorption behaviour. Background and Objectives Filter Sample (Different filter types) Aqueous SPE Extraction with WAX Cartridge Analyze by (-ESI) LC-MS/MS (three runs) Extraction of Filter by mechanical shaker Carbon, SPE WAX cleanup Analyze by (-ESI) LC-MS/MS (three runs) Method Summary •Samples were extracted in batches of up to 18 samples which included 1 procedural blank and a spiked reference matrix sample (SPM). All samples were spiked with isotopically-labeled internal standards prior to extraction and a recovery standard was added prior to analysis to assess matrix effects. •Drinking water, surface water and effluent were spiked after filtering to eliminate effect of particulate matter on the experiments. •Sample sizes ranged from 50- 500 mL and varied by analysis, sample matrix and expected sample levels •Spiked sample analyses were carried out at multiple spike levels and all analyses were carried out in duplicate/triplicate except for some of the AFFF affected aqueous samples •Rinsates of filter equipment were analysed in some cases and eliminated as a source of adsorption •Three separate analytical runs were utilized, one for the PFCAs, PFSAs and FOSAMs, one for the FTS, and one for the PAPs and PFPiA/PFPAs Protocol Notes Results PAP and DiPAP 0.0 0.0 0.0 0.0 33.3 65.7 33.8 55.8 0 50 100 Glass Nylon Glass Nylon Glass Nylon Glass Nylon Drinking Water Drinking Water Drinking Water Drinking Water 6:2 PAP 8:2 PAP 6:2 diPAP 8:2 diPAP PercentFilter PFOA 0.3 1.4 0.0 15.7 0.5 1.2 0.0 9.5 0.9 1.7 0.0 17.6 4.1 11.6 0 50 100 Glass Nylon PES Teflon Glass Nylon PES Teflon Glass Nylon PES Teflon Glass Nylon Drinking Water Ambient POTW Effluent AFFF PercentFilter PFOS 2.4 27.6 4.2 95.1 7.0 24.3 30.0 86.7 7.8 23.0 18.1 80.4 10.2 93.9 0 50 100 Glass Nylon PES Teflon Glass Nylon PES Teflon Glass Nylon PES Teflon Glass Nylon Drinking Water Ambient POTW Effluent AFFF PercentFilter PFHxS 0.2 5.4 0.0 7.7 0.3 5.2 5.2 3.5 0.5 4.9 3.2 7.4 3.1 42.6 0 50 100 Glass Nylon PES Teflon Glass Nylon PES Teflon Glass Nylon PES Teflon Glass Nylon Drinking Water Ambient POTW Effluent AFFF PercentFilter PFDA 2.9 9.5 2.5 98.3 4.9 7.2 7.8 97.1 5.5 9.3 12.1 74.8 0 50 100 Glass Nylon PES Teflon Glass Nylon PES Teflon Glass Nylon PES Teflon Drinking Water Ambient POTW Effluent PercentFilter 8:2 FTS 3.8 10.4 9.9 16.8 7.1 16.4 0 50 100 Glass Nylon Glass Nylon Glass Nylon Drinking Water Ambient POTW Effluent PercentFilter PFOSA 3.0 23.3 32.4 86.8 1.5 7.5 3.5 94.1 3.2 17.2 3.5 88.3 0 50 100 Glass Nylon PES Teflon Glass Nylon PES Teflon Glass Nylon PES Teflon Drinking Water Ambient POTW Effluent PercentFilter PFPiA 28.5 71.1 32.4 76.1 41.2 69.1 0 50 100 Glass Nylon Glass Nylon Glass Nylon Drinking Water Drinking Water Drinking Water 6:6PFPiA 6:8PFPiA 8:8PFPiA PercentFilter •Perfluorinated carboxylic acids – Significant adsorption seen with chain length 8 and greater. Glass filters show the best performance •Perluorinated sulfonic acids – Significant adsorption seen with chain length 6 or greater. Glass filters show the best performance •Fluorotelomer sulfonates – Only 8:2 FTS shows significant adsorption. 4:2 and 6:2 show little adsorption in matrices measured •Fluorinated phosphonates show very little adsorption, but phospinates show high levels of adsorption, and phosphate diesters •Glass filters show the best performance overall across all analyte and matrix types •AFFF samples show very severe losses for many compounds including PFOS on nylon filters. Use of glass filters results in good agreement with whole water tests •Concentration effects on adsorption were only observed in drinking water analyses, other matrices show no effect of concentration on amount of adsorption •Filtration of samples can have a significant effect on many fluorinated compounds and needs to be a consideration in the sampling/analysis of fluorinated compounds. •For most analytes including PFCAs and PFSAs, adsorption on the glass filters is within analytical error and is appropriate for use in multiphase sample analyses. •The use of filtration for phosphinic and phosphate ester compounds needs to be considered carefully as significant losses are seen on all filter types •Aqueous samples affected by AFFF application show high losses on certain filter types that can be attributed to their surface activity/emulsion formation. The use of glass filters if necessary can reduce these losses to within analytical error. •Study of filter adsorption and similar analytical artefacts should be a part of method development protocols Figure 4: Effect of PFOS concentration in AFFF samples on filter adsorption Figure 3: Filter adsorption as measured by percent of analyte on filter by analyte, filter type and matrix PFOS-Nylon Effect of concentration 0 20 40 0 100 200 300 400 500 600 Spiked Concentration (ng) PercentFilter Drinking Water Ambient POTW Effluent PFOS - AFFF Effect of concentration 0 25 50 75 100 0 1000 2000 3000 4000 5000 6000 Total Concentration (ng) PercentFilter Glass Nylon •Spiked drinking water •Spiked ambient surface water •Spiked POTW effluent •Ground/surface water impacted by AFFF Matrices Studied •We thank the Jennifer Field research group at Oregon State University for their collaboration on AFFF affected aqueous samples •Lindstrom, A. B., Strynar, M. J. & Libelo, E. L. Environ. Sci. Technol. 45, 7954–7961 (2011) •Houde, M., De Silva, A. O., Muir, D. C. G. & Letcher, R. J. Environ. Sci. Technol. 45, 7962– 7973 (2011). •Labadie, P. & Chevreuil, M. Environmental Pollution 159, 3634–3639 (2011). •Arp, H. P. H. & Goss, K.-U.. Atmospheric Environment 42, 6869–6872 (2008). Experimental Protocol Perfluoroalkyl acids (PFAAs) 19 congeners monitored Perfluoroalkyl acid-precursors (PFAA-precursors) 8 congeners monitored Perfluoroalkyl phosphonic/ phosphinic acids (PFPiAs/PFPAs) 6 congeners monitored Perfluoroalkyl carboxylates (PFCAs) 9 congeners monitored Perfluoroalkyl sulfonates (PFSAs) 3 congeners monitored Fluorotelomer sulfonates (FTSs; PFCA-precursors) 3 congeners monitored Polyfluoroalkyl phosphate esters (PAPs; PFCA-precursors) 4 congeners monitored Perfluorooctane sulfonamides (FOSAMs; PFOS-precursors) 1 congenor monitored F F F F F O O - n F F F F F S O - O O n R2 OHR1 O P O O 6:2 PAP 8:2 PAP 6:2 diPAP 8:2 diPAP n=3, PFBS n=5, PFHxS n=7, PFOS R1=C2H4C6F13 R2=H R1=C2H4C8F17 R2=H R1=C2H4C6F13 R2=C2H4C6F13 R1=C2H4C8F17 R2=C2H4C8F17 n=3, 4:2 FTS n=5, 6:2 FTS n=7, 8:2 FTS F F F F F S O - O O n R1 R2 OH P O PFHxPA PFOPA R1=OH R2=C6F13 R1=OH R2=C8F17 R1=OH R2=C10F21 PFDPA R1=C6F13 R2=C6F13 R1=C6F13 R2=C8F17 R1=C8F17 R2=C8F17 6:6 PFPiA6:6 PFPiA 6:8 PFPiA6:8 PFPiA 8:8 PFPiA8:8 PFPiA n=2, PFBA; n=3, PFPeA; n=4, PFHxA; n=5, PFHpA; n=6, PFOA; n=7, PFNA; n=8, PFDA; n=9, PFUnA; n=10, PFDoA R2 R1 NS O O F17C8 R1=H R2=H FOSA