SlideShare a Scribd company logo
1 of 1
First Steps Toward a Comparative Index of Seaport Resilience
What is resilience?
Resilience is the capacity to:
•Prepare
•Resist
•Recover
•Adapt  
To a disturbance such as a
major storm event (CARRI
2013).
Why Marine Transportation?
•Seaports are complex economic and
infrastructural systems that are highly
exposed to the projected impacts of
climate change (Becker 2011).
•Ports play a key role in the global
economy as more than 90% of global
trade is carried by sea (Becker 2011).
•Waterborne cargo and associated
activities contribute more than 649
billion annually to the U.S. GDP
(NOAA 2014).
•By 2020 total freight moved through
U.S. ports will increased by more than
50% (NOAA 2014).
What are the consequences of not
addressing coastal hazards?
Introduction Lessons & Results
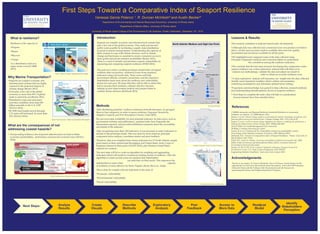
This research contribute to indicator-based index development:
•Although data was collected and a numerical score was produce we believe
that is not the most accurate result as available data were low quality,
inconsistent and not always available for all the ports.
•We highlighted and compared some of the data collected using
Principal Component Analysis and Correction Matrix to understand
the correlations among the resilience indicators.
•We conclude that the first steps towards developing this comparative index
seaport resilience was a data exploratory analysis that will allow us to
reassess our methodology, validate the data and adjust our model in
order to obtain an accurate resilience score.
•A data exploratory analysis will maximize our insight into the data collected,
identify more important variables; detect outliers and anomalies;
underlying assumptions; and determine optimal factor settings.
•Experience and knowledge was gained in data collection, research methods
and understanding interdisciplinary factors of seaports resilience.
• Next Steps to complete the index ,that will take in consideration
lessons learned, have been identify below.
Methods
After identifying potential resilience indicators from the literature, we grouped
them in four categories, in order to assess resilience: Exposure, Sensitivity,
Adaptive Capacity and Port Descriptors (Turner, Clark 2003).
We surveyed data availability for each potential indicator, its data source such as
government websites and publications , reported units, how frequently the
information reported and provided additional comments about the accessibility
and details of the indicator.
After recognizing more than 120 indicators, it was necessary to select indicators to
include in the prototype model. This was done by factor analysis, principal
component factor analysis, correlation matrix and peer feedback.
Therefore, data was compiled from chosen indicators for 23 North Atlantic sample
ports based on their annual total throughput and United States Army Corps of
Engineers interest in these ports (USACE 2015), plus Western United States
seaports for contrast.
The next steps will be to create an algorithm for weighing and aggregating
indicators which will result in a numerical ranking system of resilience. After the
algorithm is create several scores are produce that stakeholders
can rank base on their needs. This empowers the
stakeholders to select what capacity
of resilience is more effective for them: Prepare, Resist ,Recover, Adapt.
This is done by compile relevant indicators in the areas of:
•Economic vulnerability
•Environmental vulnerability
•Social vulnerability
References
Acknowledgements
CARRI(Community and Regional Resilience Institute)Definitions of community
resilience: an analysis. A CARRI Report. 2013
Becker, A.,et al., Climate Change impacts on international seaports: knowledge, perceptions, and
planning efforts among port administrators. Climate Change, 2011. 110 (1-2):p.5-29
Becker, A.,et al., A note on climate change adaptation for seaports: a challenge for global ports, a
challenge for global society. Climate Change, 2013. 120(4):p.683-695.
NOAA Office of Coastal Management Port Tomorrow
2014http://webqa.coast.noaa.gov/port/
Turner, B.,et al., A framework for vulnerability analysis in sustainability science.
Proceedings of the National Academy of Sciences, 2003.100(14) p.8074
McIntosh, R.D. "Toward a Comparative Index of Seaport Resilience." Thesis. University of
Rhode Island, 2015. Print.,
Clark, W.C. and E.A. Parson. Assessing vulnerability to global environmental risks. 2000:
Belfer Center for Science and International Affairs, John F. Kennedy School of
Government, Harvard University
Rosati, J.D. Ph. D, PE, D.CE, Coastal & Hydraulic Laboratory, Engineer Research &
Development Center, U.S. Army Corps of Engineers. 2015 USACE
Engineering Statistics Handbook Exploratory Data Analysis 2015
Thanks to my mentor, R. Duncan McIntosh. Also to Professor Austin Becker for the
opportunity to work in his lab and learn about his projects. And to the URI Extension
Outreach Center and the College of the Environment and Life Sciences for
sponsoring the Science and Engineering Fellows Program.
• Incorporating resiliency into long term infrastructure can lead to better
economic predictability, performance and prevent economic loses (NOAA
2014).
Vanessa Garcia Polanco ¹, R. Duncan McIntosh² and Austin Becker²
¹ Department of Environmental and Natural Resources Economics, University of Rhode Island,
²Department of Marine Affairs, University of Rhode Island
University of Rhode Island College of the Environment & Life Sciences Poster Celebration, December 14th
, 2015
Seaports are complex economic and infrastructural systems that
play a key role in the global economy. They make private and
public trade possible by facilitating a supply chain distribution
of goods in marine transportation .Understanding the capacity of
these systems to cope with climate stressors, such as climate
change and hurricanes ,is essential to ensure consumers access to
basic goods and private industry profitability (Becker 2013).
There is a need to identify and prioritize seaport vulnerability by
measuring and comparing seaports resilience (WMO 2014) .
Our goal is to create a working prototype model index of seaport
resilience that can produce numerical scores from empirical
indicators using real-world data. These scores will help
government officials, scientists, researchers, and the respective
stakeholders learn more about the resilience and vulnerability
factors for each port. We hope that they will be able to utilize this
tool to increase their resilience, enhance effective decision
making on port improvement projects and prepare better to
combat climate stressors (McIntosh 2015).
NOAA Port Tomorrow Marine Transportation Info Graphic
By Duncan McIntosh
Principal Component Analysis By Duncan McIntosh
Correlation Matrix By Duncan McIntosh
NOAA Port Tomorrow Marine Transportation Info Graphic
NOAA Office of Coastal Management Info Graphic

More Related Content

Similar to VGarcia_SEFPoster_Final.emf

ICLR Friday Forum: Edmonton's approach to stormwater flood mgmt (July 16, 2021)
ICLR Friday Forum: Edmonton's approach to stormwater flood mgmt (July 16, 2021)ICLR Friday Forum: Edmonton's approach to stormwater flood mgmt (July 16, 2021)
ICLR Friday Forum: Edmonton's approach to stormwater flood mgmt (July 16, 2021)glennmcgillivray
 
Supporting community resilience (public)
Supporting community resilience (public)Supporting community resilience (public)
Supporting community resilience (public)Md.Asif Rahman
 
Hurricane Katrina still ranks among the most expensive disasters in .docx
Hurricane Katrina still ranks among the most expensive disasters in .docxHurricane Katrina still ranks among the most expensive disasters in .docx
Hurricane Katrina still ranks among the most expensive disasters in .docxeugeniadean34240
 
UNEP FI CRS Climate Risk Results.pptx
UNEP FI CRS Climate Risk Results.pptxUNEP FI CRS Climate Risk Results.pptx
UNEP FI CRS Climate Risk Results.pptxpekka28
 
Get the most out of your accident reports
Get the most out of your accident reportsGet the most out of your accident reports
Get the most out of your accident reportsNASBLA
 
El Kharraz - water information systems
El Kharraz - water information systemsEl Kharraz - water information systems
El Kharraz - water information systemsWANA forum
 
El Kharraz - Water Information Systems
El Kharraz - Water Information SystemsEl Kharraz - Water Information Systems
El Kharraz - Water Information SystemsLaura Haddad
 
El Kharraz - Water Information Systems
El Kharraz - Water Information SystemsEl Kharraz - Water Information Systems
El Kharraz - Water Information SystemsLaura Haddad
 
Water Management Strategies Using Multi-Criteria Decision Analysis in Santa C...
Water Management Strategies Using Multi-Criteria Decision Analysis in Santa C...Water Management Strategies Using Multi-Criteria Decision Analysis in Santa C...
Water Management Strategies Using Multi-Criteria Decision Analysis in Santa C...Scientific Review SR
 
Get the most out of your accident reports version 9 8-10
Get the most out of your accident reports version 9 8-10Get the most out of your accident reports version 9 8-10
Get the most out of your accident reports version 9 8-10NASBLA
 
Water safety plans & catchment management
Water safety plans & catchment managementWater safety plans & catchment management
Water safety plans & catchment managementIwl Pcu
 
Risk cost benefit analysis of colision aversion model 74 f493
Risk cost benefit analysis of colision aversion model 74 f493Risk cost benefit analysis of colision aversion model 74 f493
Risk cost benefit analysis of colision aversion model 74 f493Oladokun Sulaiman Olanrewaju
 
Risk cost benefit analysis of colision aversion model 74 f493
Risk cost benefit analysis of colision aversion model 74 f493Risk cost benefit analysis of colision aversion model 74 f493
Risk cost benefit analysis of colision aversion model 74 f493Oladokun Sulaiman
 
Risk cost benefit analysis of colision aversion model 74 f493
Risk cost benefit analysis of colision aversion model 74 f493Risk cost benefit analysis of colision aversion model 74 f493
Risk cost benefit analysis of colision aversion model 74 f493Oladokun Sulaiman
 
Risk cost beefit of colision aversion 74 f493
Risk cost beefit  of  colision aversion 74 f493Risk cost beefit  of  colision aversion 74 f493
Risk cost beefit of colision aversion 74 f493Oladokun Sulaiman
 
Risk cost benefit of colision aversion 74 f493
Risk cost benefit  of  colision aversion 74 f493Risk cost benefit  of  colision aversion 74 f493
Risk cost benefit of colision aversion 74 f493Oladokun Sulaiman
 
Water security background paper by GWP Technical Committee Members
Water security background paper by GWP Technical Committee MembersWater security background paper by GWP Technical Committee Members
Water security background paper by GWP Technical Committee MembersGlobal Water Partnership
 
Research + Private Sector Partnerships - Climate information for social and e...
Research + Private Sector Partnerships - Climate information for social and e...Research + Private Sector Partnerships - Climate information for social and e...
Research + Private Sector Partnerships - Climate information for social and e...UCAR - Atmospheric & Earth System Science
 

Similar to VGarcia_SEFPoster_Final.emf (20)

ICLR Friday Forum: Edmonton's approach to stormwater flood mgmt (July 16, 2021)
ICLR Friday Forum: Edmonton's approach to stormwater flood mgmt (July 16, 2021)ICLR Friday Forum: Edmonton's approach to stormwater flood mgmt (July 16, 2021)
ICLR Friday Forum: Edmonton's approach to stormwater flood mgmt (July 16, 2021)
 
Scotsem-Economic Resilience_F.PDF
Scotsem-Economic Resilience_F.PDFScotsem-Economic Resilience_F.PDF
Scotsem-Economic Resilience_F.PDF
 
Supporting community resilience (public)
Supporting community resilience (public)Supporting community resilience (public)
Supporting community resilience (public)
 
Hurricane Katrina still ranks among the most expensive disasters in .docx
Hurricane Katrina still ranks among the most expensive disasters in .docxHurricane Katrina still ranks among the most expensive disasters in .docx
Hurricane Katrina still ranks among the most expensive disasters in .docx
 
UNEP FI CRS Climate Risk Results.pptx
UNEP FI CRS Climate Risk Results.pptxUNEP FI CRS Climate Risk Results.pptx
UNEP FI CRS Climate Risk Results.pptx
 
Stockton Wednesday8am 102809
Stockton Wednesday8am 102809Stockton Wednesday8am 102809
Stockton Wednesday8am 102809
 
Get the most out of your accident reports
Get the most out of your accident reportsGet the most out of your accident reports
Get the most out of your accident reports
 
El Kharraz - water information systems
El Kharraz - water information systemsEl Kharraz - water information systems
El Kharraz - water information systems
 
El Kharraz - Water Information Systems
El Kharraz - Water Information SystemsEl Kharraz - Water Information Systems
El Kharraz - Water Information Systems
 
El Kharraz - Water Information Systems
El Kharraz - Water Information SystemsEl Kharraz - Water Information Systems
El Kharraz - Water Information Systems
 
Water Management Strategies Using Multi-Criteria Decision Analysis in Santa C...
Water Management Strategies Using Multi-Criteria Decision Analysis in Santa C...Water Management Strategies Using Multi-Criteria Decision Analysis in Santa C...
Water Management Strategies Using Multi-Criteria Decision Analysis in Santa C...
 
Get the most out of your accident reports version 9 8-10
Get the most out of your accident reports version 9 8-10Get the most out of your accident reports version 9 8-10
Get the most out of your accident reports version 9 8-10
 
Water safety plans & catchment management
Water safety plans & catchment managementWater safety plans & catchment management
Water safety plans & catchment management
 
Risk cost benefit analysis of colision aversion model 74 f493
Risk cost benefit analysis of colision aversion model 74 f493Risk cost benefit analysis of colision aversion model 74 f493
Risk cost benefit analysis of colision aversion model 74 f493
 
Risk cost benefit analysis of colision aversion model 74 f493
Risk cost benefit analysis of colision aversion model 74 f493Risk cost benefit analysis of colision aversion model 74 f493
Risk cost benefit analysis of colision aversion model 74 f493
 
Risk cost benefit analysis of colision aversion model 74 f493
Risk cost benefit analysis of colision aversion model 74 f493Risk cost benefit analysis of colision aversion model 74 f493
Risk cost benefit analysis of colision aversion model 74 f493
 
Risk cost beefit of colision aversion 74 f493
Risk cost beefit  of  colision aversion 74 f493Risk cost beefit  of  colision aversion 74 f493
Risk cost beefit of colision aversion 74 f493
 
Risk cost benefit of colision aversion 74 f493
Risk cost benefit  of  colision aversion 74 f493Risk cost benefit  of  colision aversion 74 f493
Risk cost benefit of colision aversion 74 f493
 
Water security background paper by GWP Technical Committee Members
Water security background paper by GWP Technical Committee MembersWater security background paper by GWP Technical Committee Members
Water security background paper by GWP Technical Committee Members
 
Research + Private Sector Partnerships - Climate information for social and e...
Research + Private Sector Partnerships - Climate information for social and e...Research + Private Sector Partnerships - Climate information for social and e...
Research + Private Sector Partnerships - Climate information for social and e...
 

VGarcia_SEFPoster_Final.emf

  • 1. First Steps Toward a Comparative Index of Seaport Resilience What is resilience? Resilience is the capacity to: •Prepare •Resist •Recover •Adapt   To a disturbance such as a major storm event (CARRI 2013). Why Marine Transportation? •Seaports are complex economic and infrastructural systems that are highly exposed to the projected impacts of climate change (Becker 2011). •Ports play a key role in the global economy as more than 90% of global trade is carried by sea (Becker 2011). •Waterborne cargo and associated activities contribute more than 649 billion annually to the U.S. GDP (NOAA 2014). •By 2020 total freight moved through U.S. ports will increased by more than 50% (NOAA 2014). What are the consequences of not addressing coastal hazards? Introduction Lessons & Results This research contribute to indicator-based index development: •Although data was collected and a numerical score was produce we believe that is not the most accurate result as available data were low quality, inconsistent and not always available for all the ports. •We highlighted and compared some of the data collected using Principal Component Analysis and Correction Matrix to understand the correlations among the resilience indicators. •We conclude that the first steps towards developing this comparative index seaport resilience was a data exploratory analysis that will allow us to reassess our methodology, validate the data and adjust our model in order to obtain an accurate resilience score. •A data exploratory analysis will maximize our insight into the data collected, identify more important variables; detect outliers and anomalies; underlying assumptions; and determine optimal factor settings. •Experience and knowledge was gained in data collection, research methods and understanding interdisciplinary factors of seaports resilience. • Next Steps to complete the index ,that will take in consideration lessons learned, have been identify below. Methods After identifying potential resilience indicators from the literature, we grouped them in four categories, in order to assess resilience: Exposure, Sensitivity, Adaptive Capacity and Port Descriptors (Turner, Clark 2003). We surveyed data availability for each potential indicator, its data source such as government websites and publications , reported units, how frequently the information reported and provided additional comments about the accessibility and details of the indicator. After recognizing more than 120 indicators, it was necessary to select indicators to include in the prototype model. This was done by factor analysis, principal component factor analysis, correlation matrix and peer feedback. Therefore, data was compiled from chosen indicators for 23 North Atlantic sample ports based on their annual total throughput and United States Army Corps of Engineers interest in these ports (USACE 2015), plus Western United States seaports for contrast. The next steps will be to create an algorithm for weighing and aggregating indicators which will result in a numerical ranking system of resilience. After the algorithm is create several scores are produce that stakeholders can rank base on their needs. This empowers the stakeholders to select what capacity of resilience is more effective for them: Prepare, Resist ,Recover, Adapt. This is done by compile relevant indicators in the areas of: •Economic vulnerability •Environmental vulnerability •Social vulnerability References Acknowledgements CARRI(Community and Regional Resilience Institute)Definitions of community resilience: an analysis. A CARRI Report. 2013 Becker, A.,et al., Climate Change impacts on international seaports: knowledge, perceptions, and planning efforts among port administrators. Climate Change, 2011. 110 (1-2):p.5-29 Becker, A.,et al., A note on climate change adaptation for seaports: a challenge for global ports, a challenge for global society. Climate Change, 2013. 120(4):p.683-695. NOAA Office of Coastal Management Port Tomorrow 2014http://webqa.coast.noaa.gov/port/ Turner, B.,et al., A framework for vulnerability analysis in sustainability science. Proceedings of the National Academy of Sciences, 2003.100(14) p.8074 McIntosh, R.D. "Toward a Comparative Index of Seaport Resilience." Thesis. University of Rhode Island, 2015. Print., Clark, W.C. and E.A. Parson. Assessing vulnerability to global environmental risks. 2000: Belfer Center for Science and International Affairs, John F. Kennedy School of Government, Harvard University Rosati, J.D. Ph. D, PE, D.CE, Coastal & Hydraulic Laboratory, Engineer Research & Development Center, U.S. Army Corps of Engineers. 2015 USACE Engineering Statistics Handbook Exploratory Data Analysis 2015 Thanks to my mentor, R. Duncan McIntosh. Also to Professor Austin Becker for the opportunity to work in his lab and learn about his projects. And to the URI Extension Outreach Center and the College of the Environment and Life Sciences for sponsoring the Science and Engineering Fellows Program. • Incorporating resiliency into long term infrastructure can lead to better economic predictability, performance and prevent economic loses (NOAA 2014). Vanessa Garcia Polanco ¹, R. Duncan McIntosh² and Austin Becker² ¹ Department of Environmental and Natural Resources Economics, University of Rhode Island, ²Department of Marine Affairs, University of Rhode Island University of Rhode Island College of the Environment & Life Sciences Poster Celebration, December 14th , 2015 Seaports are complex economic and infrastructural systems that play a key role in the global economy. They make private and public trade possible by facilitating a supply chain distribution of goods in marine transportation .Understanding the capacity of these systems to cope with climate stressors, such as climate change and hurricanes ,is essential to ensure consumers access to basic goods and private industry profitability (Becker 2013). There is a need to identify and prioritize seaport vulnerability by measuring and comparing seaports resilience (WMO 2014) . Our goal is to create a working prototype model index of seaport resilience that can produce numerical scores from empirical indicators using real-world data. These scores will help government officials, scientists, researchers, and the respective stakeholders learn more about the resilience and vulnerability factors for each port. We hope that they will be able to utilize this tool to increase their resilience, enhance effective decision making on port improvement projects and prepare better to combat climate stressors (McIntosh 2015). NOAA Port Tomorrow Marine Transportation Info Graphic By Duncan McIntosh Principal Component Analysis By Duncan McIntosh Correlation Matrix By Duncan McIntosh NOAA Port Tomorrow Marine Transportation Info Graphic NOAA Office of Coastal Management Info Graphic