Download to read offline
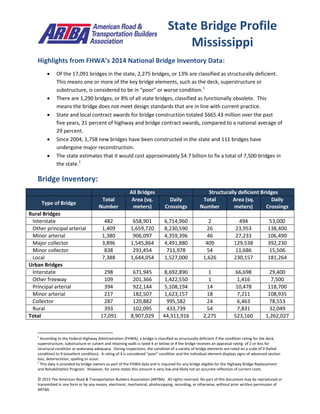
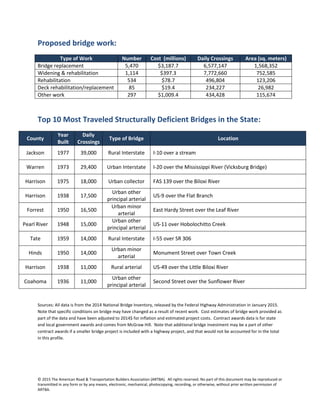

13% of Mississippi's 17,091 bridges are structurally deficient, meaning key elements are in poor condition. 8% are functionally obsolete as they do not meet current design standards. It would cost an estimated $4.7 billion to repair 7,500 deficient bridges in the state. The top 10 most traveled structurally deficient bridges include two interstate bridges built in the 1970s that carry over 29,000 vehicles daily.


