Download as PDF, PPTX
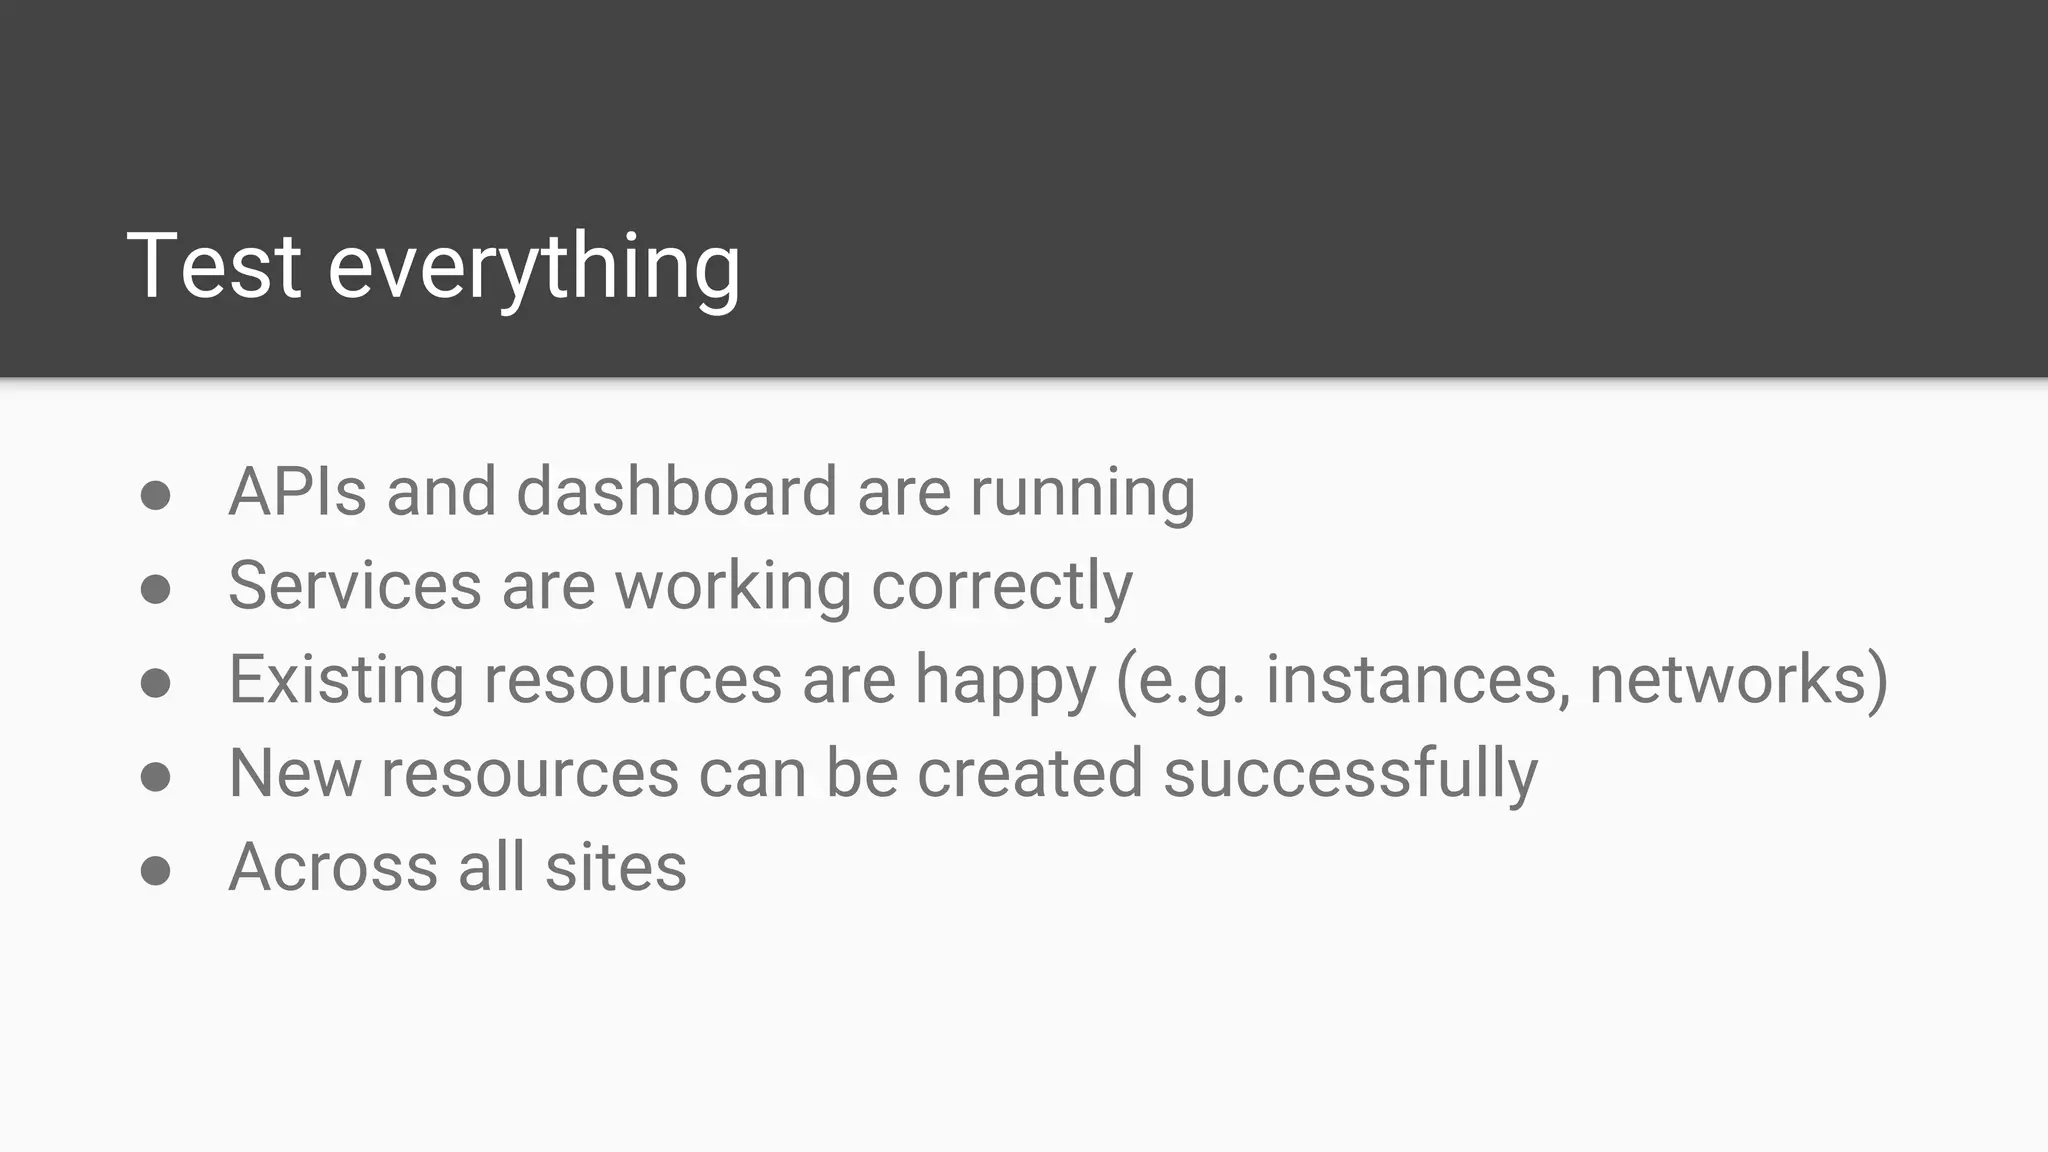
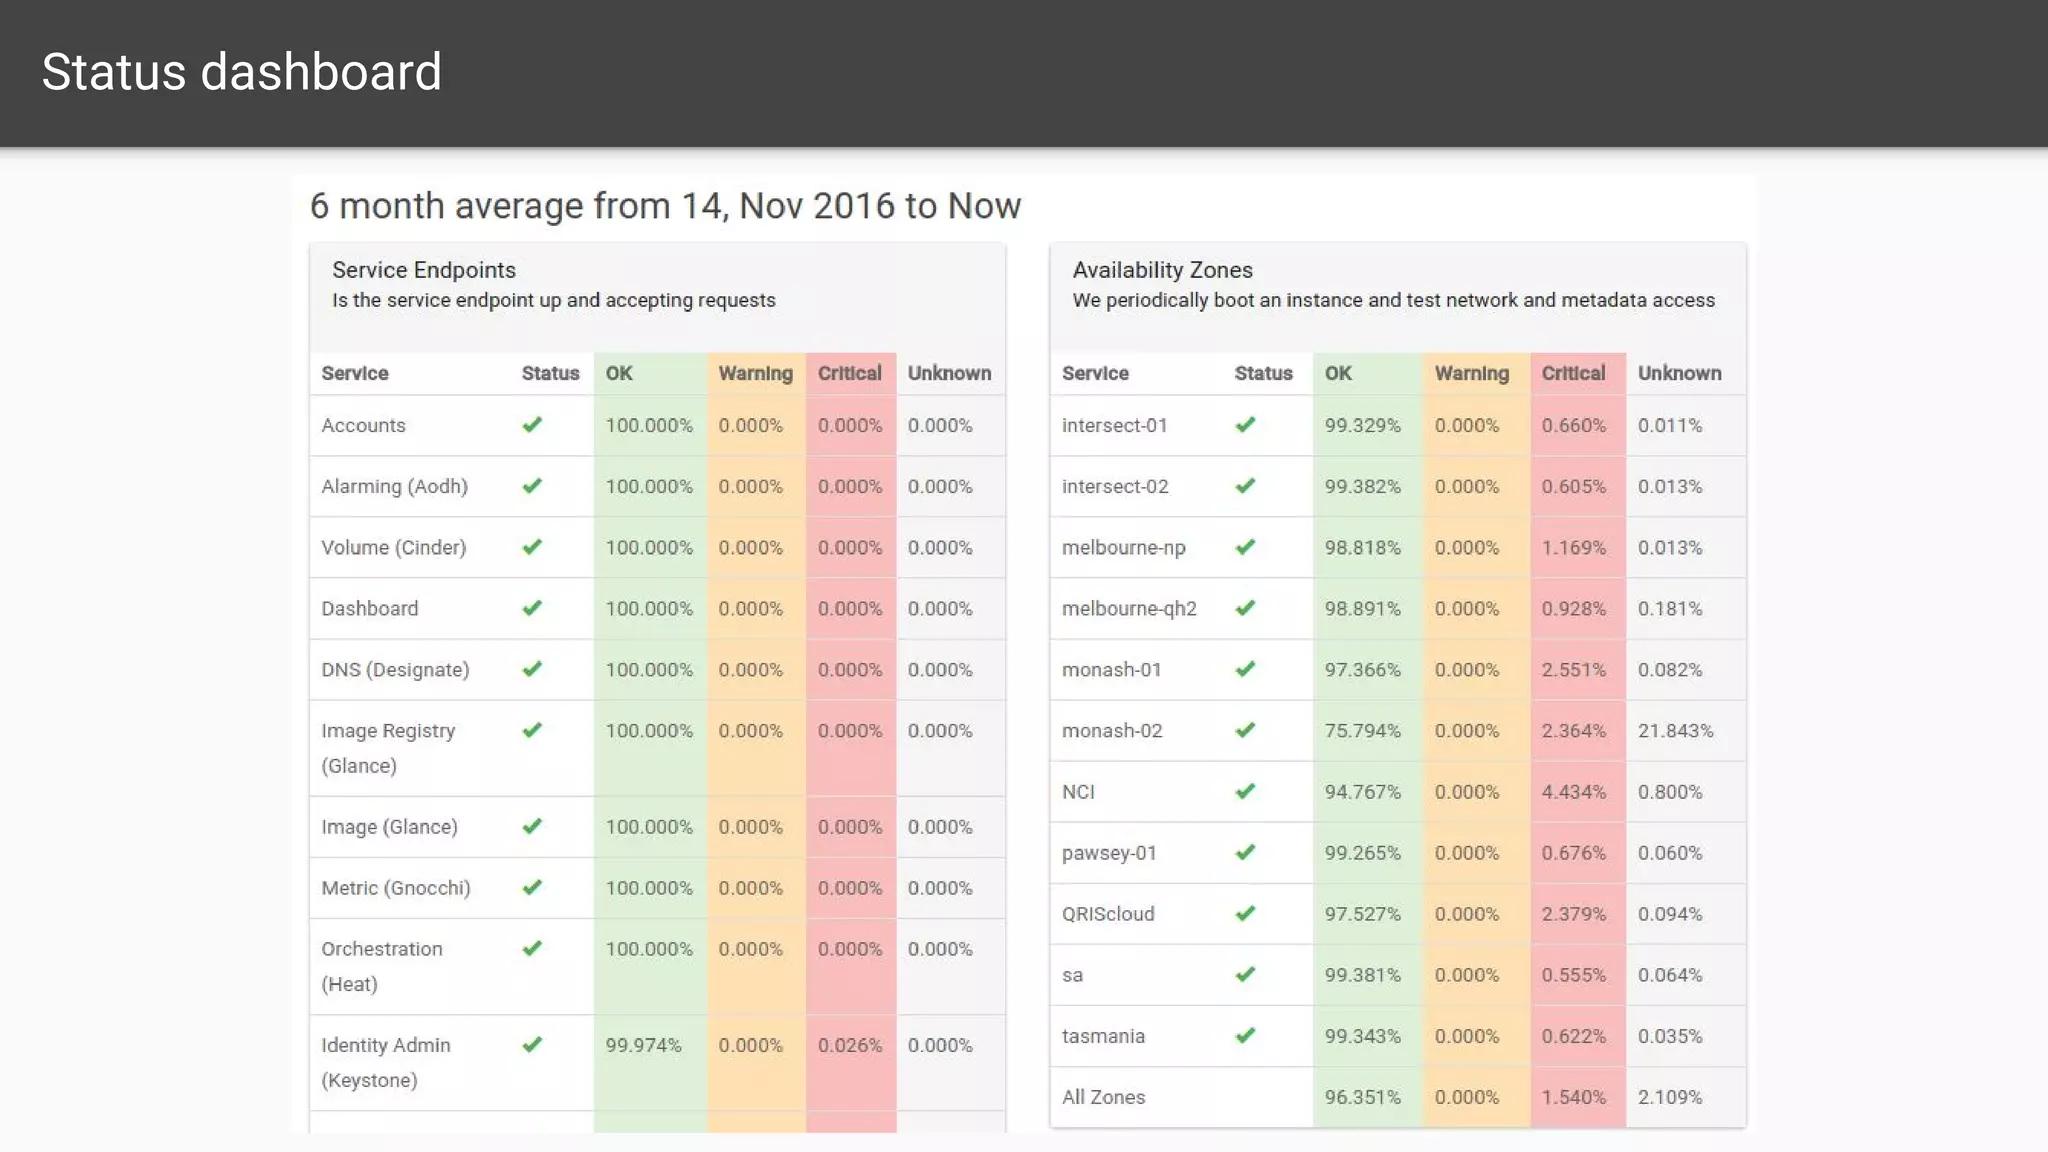
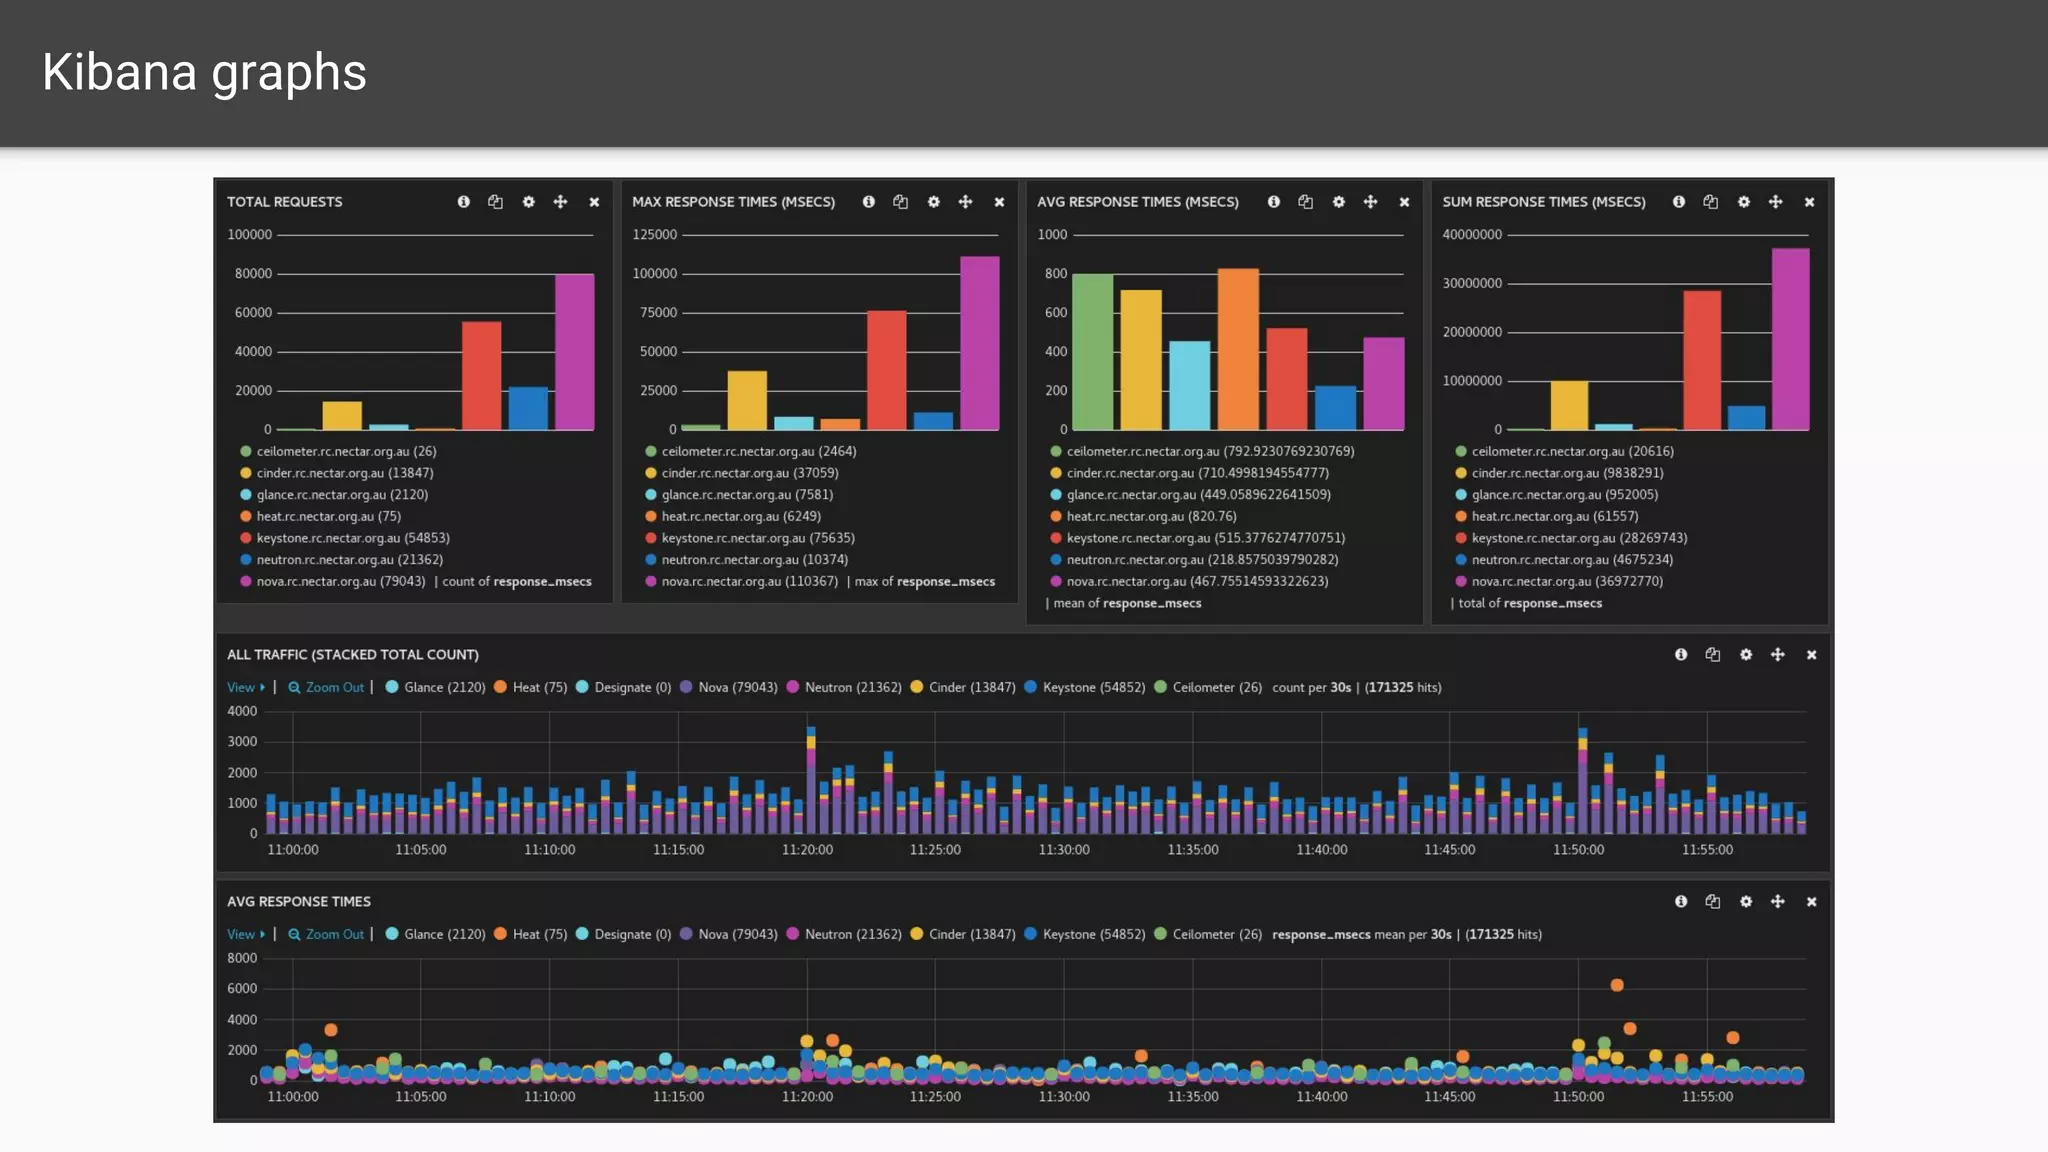

The document outlines a comprehensive monitoring system for the Nectar Research Cloud, detailing components such as uptime checks, health checks for APIs and services, and integration testing via Tempest. It highlights various monitoring tools like Nagios and ELK for logging and alert notifications, while also emphasizing configuration management through Puppet. The goal is to ensure all services function correctly and to facilitate quick diagnostics of any issues across multiple sites.


![Coded Agents – with UiPath SDK + LangGraph [Virtual Hands-on Workshop]](https://cdn.slidesharecdn.com/ss_thumbnails/codedagentsdeck-251215155422-5497c599-thumbnail.jpg?width=640&height=640&fit=bounds)


