Download as PDF, PPTX


![Electronic item analysis
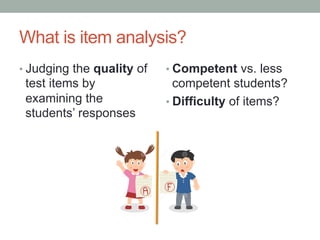
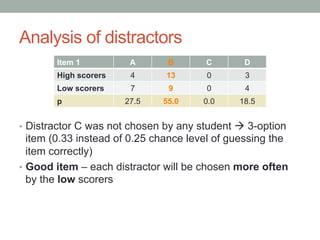
r = correlation of an option with the total score
p = percentage of students who chose that option (n = 65)
• Standard error (SE) = 1 / √ (number of students – 1)
= 0.12
• Any r > 2(SE) will be accepted as other than a chance
relationship between the item and the total score
Item 1: r = 0.25 > 0.24 [2(SE)] à very marginal but acceptable
Item A B C
1 r = -0.27
p = 13.89
r = 0.25
p = 50.00
r = -0.06
p = 36.11
2 r = -0.46
p = 5.56
r = 0.49
p = 88.86
r = -0.22
p = 5.56
3 r = -0.30
p = 16.67
r = -0.13
p = 27.78
r = 0.34
p = 55.56](https://image.slidesharecdn.com/13-itemanalysis-161127124647/85/Item-Analysis-7-320.jpg)


![Item analysis for essay tests
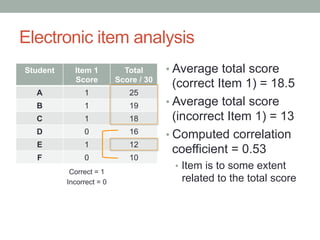
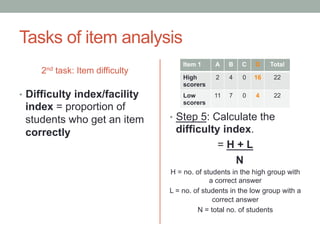
• Step 2: Compute for the following:
Disc. = (Sum of scores for highs – sum of score for lows)
N x (max. possible score on item)
= (162 – 78) / [(0.25 x 80) x 10] = 0.42
Satisfactory discrimination
Item Score
High Group Low Group
No. of Students No. of Students
x Score
No. of Students No. of Students
x Score
10 9 90 1 10
8 6 48 0 0
6 2 12 4 24
4 3 12 7 28
2 0 0 8 16
Total 20 162 20 78](https://image.slidesharecdn.com/13-itemanalysis-161127124647/85/Item-Analysis-16-320.jpg)
![Item analysis for essay tests
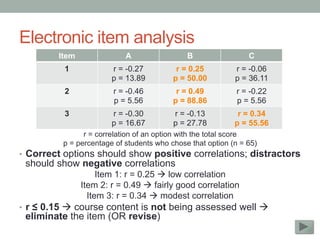
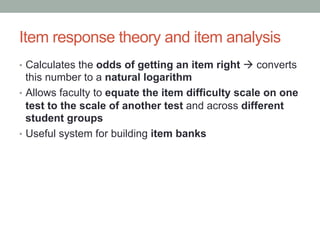
• Step 2: Compute for the following:
Diff. = (Sum of scores for highs + sum of score for lows)
2N x (max. possible score on item)
= (162 + 78) / [(2 x 0.25 x 80) x 10] = 0.60
Satisfactory difficulty
Item Score
High Group Low Group
No. of Students No. of Students
x Score
No. of Students No. of Students
x Score
10 9 90 1 10
8 6 48 0 0
6 2 12 4 24
4 3 12 7 28
2 0 0 8 16
Total 20 162 20 78](https://image.slidesharecdn.com/13-itemanalysis-161127124647/85/Item-Analysis-17-320.jpg)


Item analysis is a process to evaluate the quality and performance of individual test items. It involves analyzing students' responses to separate test items and their total test scores to evaluate item discrimination (how well items differentiate between more and less competent students) and difficulty. Item analysis can be done electronically by correlating student responses on individual items with their total scores, or manually by comparing responses of high-scoring and low-scoring student groups. The results are used to identify poorly performing items that may need revision or removal from tests.


![Field Study 2 (FS 2) - Episode 2 [2018]](https://cdn.slidesharecdn.com/ss_thumbnails/fs2-episode2-180914121852-thumbnail.jpg?width=640&height=640&fit=bounds)


