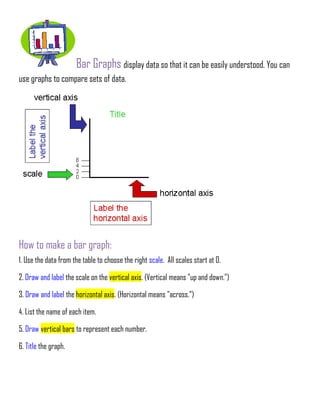
1. Bar Graphs display data so that it can be easily understood. You can
use graphs to compare sets of data.
How to make a bar graph:
1. Use the data from the table to choose the right scale. All scales start at 0.
2. Draw and label the scale on the vertical axis. (Vertical means "up and down.")
3. Draw and label the horizontal axis. (Horizontal means "across.")
4. List the name of each item.
5. Draw vertical bars to represent each number.
6. Title the graph.
2. Bar Graph
Favorite Sports
Sport Number of Students
Baseball 25
Basketball 18
Gymnastics 14
Soccer 28
Tennis 12
The data was organized in a table making it easier to read and interpret. The data from the table was used to create the
following bar graph.
A bar graph is a graph that uses bars to show data.
This vertical bar graph shows the number of fifth grade students that liked each sport.
Remember:
A bar graph is a graph that uses bars to show data. The bars on a bar graph can be horizontal or vertical.