SlideShare a Scribd company logo
1 of 4
Download to read offline
“ Various Charts in Excel “
Column charts
Data that is arranged in columns or rows on a worksheet (worksheet: The primary document that you
use in Excel to store and work with data Also called a spreadsheet a worksheet consists of cells that are
organized into columns and rows, a worksheet is always stored in a workbook.) can be plotted in a
column chart. Column charts are useful for showing data changes over a period of time or for illustrating
comparisons among items. In column charts, categories are typically organized along the horizontal axis
and values along the vertical axis.
Line charts
Data that is arranged in columns or rows on a worksheet can be plotted in a line chart. Line charts can
display continuous data over time, set against a common scale, and are therefore ideal for showing
trends in data at equal intervals. In a line chart, category data is distributed evenly along the horizontal
axis, and all value data is distributed evenly along the vertical axis.
Pie charts
Data that is arranged in one column or row only on a worksheet can be plotted in a pie chart. Pie charts
show the size of items in one data series, proportional to the sum of the items. The data points in a pie
chart are displayed as a percentage of the whole pie.
Consider using a pie chart when
-You only have one data series that you want to plot. None of the values that you want to plot are
negative.
-Almost none of the values that you want to plot are zero values.
-You do not have more than seven categories.
-The categories represent parts of the whole pie.
Bar charts
Data that is arranged in columns or rows on a worksheet can be plotted in a bar chart. Bar charts
illustrate comparisons among individual items.
Consider using a bar chart when:
-The axis labels are long.
-The values that are shown are durations.
Area charts
Data that is arranged in columns or rows on a worksheet can be plotted in an area chart. Area charts
emphasize the magnitude of change over time, and can be used to draw attention to the total value
across a trend. For example, data that represents profit over time can be plotted in an area chart to
emphasize the total profit.
By displaying the sum of the plotted values, an area chart also shows the relationship of parts to a
whole.
Surface charts
Data that is arranged in columns or rows on a worksheet can be plotted in a surface chart. A surface
chart is useful when you want to find optimum combinations between two sets of data. As in a
topographic map, colors and patterns indicate areas that are in the same range of values.
You can use a surface chart when both categories and data series are numeric values.
1.
2.

More Related Content

What's hot

Fundamentals of database system - Relational data model and relational datab...
Fundamentals of database system  - Relational data model and relational datab...Fundamentals of database system  - Relational data model and relational datab...
Fundamentals of database system - Relational data model and relational datab...Mustafa Kamel Mohammadi
 
Spreadsheets and Database Packages
Spreadsheets and Database PackagesSpreadsheets and Database Packages
Spreadsheets and Database PackagesSURBHI SAROHA
 
Html links
Html linksHtml links
Html linksJayjZens
 
Calculated Fields in Tableau
Calculated Fields in TableauCalculated Fields in Tableau
Calculated Fields in TableauKanika Nagpal
 
Excel Database Function
Excel Database FunctionExcel Database Function
Excel Database FunctionAnita Shah
 
Introduction to data structure
Introduction to data structureIntroduction to data structure
Introduction to data structureadeel hamid
 
Lesson 1 Excel Introduction
Lesson 1 Excel IntroductionLesson 1 Excel Introduction
Lesson 1 Excel Introductionwats300
 
Data structure & its types
Data structure & its typesData structure & its types
Data structure & its typesRameesha Sadaqat
 
String Library Functions
String Library FunctionsString Library Functions
String Library FunctionsNayan Sharma
 
Linked list in Data Structure and Algorithm
Linked list in Data Structure and Algorithm Linked list in Data Structure and Algorithm
Linked list in Data Structure and Algorithm KristinaBorooah
 

What's hot (20)

MySQL Views
MySQL ViewsMySQL Views
MySQL Views
 
Excel for beginner
Excel for beginnerExcel for beginner
Excel for beginner
 
Fundamentals of database system - Relational data model and relational datab...
Fundamentals of database system  - Relational data model and relational datab...Fundamentals of database system  - Relational data model and relational datab...
Fundamentals of database system - Relational data model and relational datab...
 
Spreadsheets and Database Packages
Spreadsheets and Database PackagesSpreadsheets and Database Packages
Spreadsheets and Database Packages
 
Html links
Html linksHtml links
Html links
 
Html
HtmlHtml
Html
 
Calculated Fields in Tableau
Calculated Fields in TableauCalculated Fields in Tableau
Calculated Fields in Tableau
 
Linked List
Linked ListLinked List
Linked List
 
Data dictionaries
Data dictionariesData dictionaries
Data dictionaries
 
Excel Database Function
Excel Database FunctionExcel Database Function
Excel Database Function
 
Introduction to RDBMS
Introduction to RDBMSIntroduction to RDBMS
Introduction to RDBMS
 
MS Excel - Charts
MS Excel - ChartsMS Excel - Charts
MS Excel - Charts
 
Introduction to data structure
Introduction to data structureIntroduction to data structure
Introduction to data structure
 
Lesson 1 Excel Introduction
Lesson 1 Excel IntroductionLesson 1 Excel Introduction
Lesson 1 Excel Introduction
 
Data structure & its types
Data structure & its typesData structure & its types
Data structure & its types
 
String Library Functions
String Library FunctionsString Library Functions
String Library Functions
 
Linked list in Data Structure and Algorithm
Linked list in Data Structure and Algorithm Linked list in Data Structure and Algorithm
Linked list in Data Structure and Algorithm
 
ER MODEL
ER MODELER MODEL
ER MODEL
 
Basic html structure
Basic html structureBasic html structure
Basic html structure
 
1D Array
1D Array1D Array
1D Array
 

Similar to Assignment 3 charts in excel

Similar to Assignment 3 charts in excel (20)

Computer midterms
Computer midtermsComputer midterms
Computer midterms
 
Charts in excel
Charts in excelCharts in excel
Charts in excel
 
Types of charts in Excel and How to use them
Types of charts in Excel and How to use themTypes of charts in Excel and How to use them
Types of charts in Excel and How to use them
 
Types of Chart
Types of ChartTypes of Chart
Types of Chart
 
Bar chart
Bar chartBar chart
Bar chart
 
Understanding on graph in bpo
Understanding on graph in bpoUnderstanding on graph in bpo
Understanding on graph in bpo
 
Graphing Data
Graphing DataGraphing Data
Graphing Data
 
Spreadsheet terminology
Spreadsheet terminologySpreadsheet terminology
Spreadsheet terminology
 
Column chart
Column chartColumn chart
Column chart
 
Simple graph types
Simple graph typesSimple graph types
Simple graph types
 
Graphing data
Graphing dataGraphing data
Graphing data
 
Microsoft Excel.pptx
Microsoft Excel.pptxMicrosoft Excel.pptx
Microsoft Excel.pptx
 
Line & Bar Graphs 97
Line & Bar Graphs 97Line & Bar Graphs 97
Line & Bar Graphs 97
 
Types of Microsoft Chart.docx
Types of Microsoft Chart.docxTypes of Microsoft Chart.docx
Types of Microsoft Chart.docx
 
MS-EXCEL Assignment Help
MS-EXCEL Assignment HelpMS-EXCEL Assignment Help
MS-EXCEL Assignment Help
 
Displaying data using charts and graphs
Displaying data using charts and graphsDisplaying data using charts and graphs
Displaying data using charts and graphs
 
GIS Ostrava 2018 – Insights for ArGIS
GIS Ostrava 2018 – Insights for ArGISGIS Ostrava 2018 – Insights for ArGIS
GIS Ostrava 2018 – Insights for ArGIS
 
Các loại biểu đồ trình bày dữ liệu kinh doanh
Các loại biểu đồ trình bày dữ liệu kinh doanhCác loại biểu đồ trình bày dữ liệu kinh doanh
Các loại biểu đồ trình bày dữ liệu kinh doanh
 
Bigdata
BigdataBigdata
Bigdata
 
Graphical Displays of Data
Graphical Displays of DataGraphical Displays of Data
Graphical Displays of Data
 

Recently uploaded

Science lesson Moon for 4th quarter lesson
Science lesson Moon for 4th quarter lessonScience lesson Moon for 4th quarter lesson
Science lesson Moon for 4th quarter lessonJericReyAuditor
 
How to Configure Email Server in Odoo 17
How to Configure Email Server in Odoo 17How to Configure Email Server in Odoo 17
How to Configure Email Server in Odoo 17Celine George
 
Paris 2024 Olympic Geographies - an activity
Paris 2024 Olympic Geographies - an activityParis 2024 Olympic Geographies - an activity
Paris 2024 Olympic Geographies - an activityGeoBlogs
 
Sanyam Choudhary Chemistry practical.pdf
Sanyam Choudhary Chemistry practical.pdfSanyam Choudhary Chemistry practical.pdf
Sanyam Choudhary Chemistry practical.pdfsanyamsingh5019
 
How to Make a Pirate ship Primary Education.pptx
How to Make a Pirate ship Primary Education.pptxHow to Make a Pirate ship Primary Education.pptx
How to Make a Pirate ship Primary Education.pptxmanuelaromero2013
 
Alper Gobel In Media Res Media Component
Alper Gobel In Media Res Media ComponentAlper Gobel In Media Res Media Component
Alper Gobel In Media Res Media ComponentInMediaRes1
 
Proudly South Africa powerpoint Thorisha.pptx
Proudly South Africa powerpoint Thorisha.pptxProudly South Africa powerpoint Thorisha.pptx
Proudly South Africa powerpoint Thorisha.pptxthorishapillay1
 
The Most Excellent Way | 1 Corinthians 13
The Most Excellent Way | 1 Corinthians 13The Most Excellent Way | 1 Corinthians 13
The Most Excellent Way | 1 Corinthians 13Steve Thomason
 
18-04-UA_REPORT_MEDIALITERAСY_INDEX-DM_23-1-final-eng.pdf
18-04-UA_REPORT_MEDIALITERAСY_INDEX-DM_23-1-final-eng.pdf18-04-UA_REPORT_MEDIALITERAСY_INDEX-DM_23-1-final-eng.pdf
18-04-UA_REPORT_MEDIALITERAСY_INDEX-DM_23-1-final-eng.pdfssuser54595a
 
Kisan Call Centre - To harness potential of ICT in Agriculture by answer farm...
Kisan Call Centre - To harness potential of ICT in Agriculture by answer farm...Kisan Call Centre - To harness potential of ICT in Agriculture by answer farm...
Kisan Call Centre - To harness potential of ICT in Agriculture by answer farm...Krashi Coaching
 
Hybridoma Technology ( Production , Purification , and Application )
Hybridoma Technology  ( Production , Purification , and Application  ) Hybridoma Technology  ( Production , Purification , and Application  )
Hybridoma Technology ( Production , Purification , and Application ) Sakshi Ghasle
 
_Math 4-Q4 Week 5.pptx Steps in Collecting Data
_Math 4-Q4 Week 5.pptx Steps in Collecting Data_Math 4-Q4 Week 5.pptx Steps in Collecting Data
_Math 4-Q4 Week 5.pptx Steps in Collecting DataJhengPantaleon
 
Employee wellbeing at the workplace.pptx
Employee wellbeing at the workplace.pptxEmployee wellbeing at the workplace.pptx
Employee wellbeing at the workplace.pptxNirmalaLoungPoorunde1
 
internship ppt on smartinternz platform as salesforce developer
internship ppt on smartinternz platform as salesforce developerinternship ppt on smartinternz platform as salesforce developer
internship ppt on smartinternz platform as salesforce developerunnathinaik
 
Crayon Activity Handout For the Crayon A
Crayon Activity Handout For the Crayon ACrayon Activity Handout For the Crayon A
Crayon Activity Handout For the Crayon AUnboundStockton
 
Painted Grey Ware.pptx, PGW Culture of India
Painted Grey Ware.pptx, PGW Culture of IndiaPainted Grey Ware.pptx, PGW Culture of India
Painted Grey Ware.pptx, PGW Culture of IndiaVirag Sontakke
 
History Class XII Ch. 3 Kinship, Caste and Class (1).pptx
History Class XII Ch. 3 Kinship, Caste and Class (1).pptxHistory Class XII Ch. 3 Kinship, Caste and Class (1).pptx
History Class XII Ch. 3 Kinship, Caste and Class (1).pptxsocialsciencegdgrohi
 
SOCIAL AND HISTORICAL CONTEXT - LFTVD.pptx
SOCIAL AND HISTORICAL CONTEXT - LFTVD.pptxSOCIAL AND HISTORICAL CONTEXT - LFTVD.pptx
SOCIAL AND HISTORICAL CONTEXT - LFTVD.pptxiammrhaywood
 

Recently uploaded (20)

Science lesson Moon for 4th quarter lesson
Science lesson Moon for 4th quarter lessonScience lesson Moon for 4th quarter lesson
Science lesson Moon for 4th quarter lesson
 
How to Configure Email Server in Odoo 17
How to Configure Email Server in Odoo 17How to Configure Email Server in Odoo 17
How to Configure Email Server in Odoo 17
 
Paris 2024 Olympic Geographies - an activity
Paris 2024 Olympic Geographies - an activityParis 2024 Olympic Geographies - an activity
Paris 2024 Olympic Geographies - an activity
 
Model Call Girl in Tilak Nagar Delhi reach out to us at 🔝9953056974🔝
Model Call Girl in Tilak Nagar Delhi reach out to us at 🔝9953056974🔝Model Call Girl in Tilak Nagar Delhi reach out to us at 🔝9953056974🔝
Model Call Girl in Tilak Nagar Delhi reach out to us at 🔝9953056974🔝
 
Sanyam Choudhary Chemistry practical.pdf
Sanyam Choudhary Chemistry practical.pdfSanyam Choudhary Chemistry practical.pdf
Sanyam Choudhary Chemistry practical.pdf
 
How to Make a Pirate ship Primary Education.pptx
How to Make a Pirate ship Primary Education.pptxHow to Make a Pirate ship Primary Education.pptx
How to Make a Pirate ship Primary Education.pptx
 
Alper Gobel In Media Res Media Component
Alper Gobel In Media Res Media ComponentAlper Gobel In Media Res Media Component
Alper Gobel In Media Res Media Component
 
Proudly South Africa powerpoint Thorisha.pptx
Proudly South Africa powerpoint Thorisha.pptxProudly South Africa powerpoint Thorisha.pptx
Proudly South Africa powerpoint Thorisha.pptx
 
The Most Excellent Way | 1 Corinthians 13
The Most Excellent Way | 1 Corinthians 13The Most Excellent Way | 1 Corinthians 13
The Most Excellent Way | 1 Corinthians 13
 
18-04-UA_REPORT_MEDIALITERAСY_INDEX-DM_23-1-final-eng.pdf
18-04-UA_REPORT_MEDIALITERAСY_INDEX-DM_23-1-final-eng.pdf18-04-UA_REPORT_MEDIALITERAСY_INDEX-DM_23-1-final-eng.pdf
18-04-UA_REPORT_MEDIALITERAСY_INDEX-DM_23-1-final-eng.pdf
 
Kisan Call Centre - To harness potential of ICT in Agriculture by answer farm...
Kisan Call Centre - To harness potential of ICT in Agriculture by answer farm...Kisan Call Centre - To harness potential of ICT in Agriculture by answer farm...
Kisan Call Centre - To harness potential of ICT in Agriculture by answer farm...
 
Hybridoma Technology ( Production , Purification , and Application )
Hybridoma Technology  ( Production , Purification , and Application  ) Hybridoma Technology  ( Production , Purification , and Application  )
Hybridoma Technology ( Production , Purification , and Application )
 
_Math 4-Q4 Week 5.pptx Steps in Collecting Data
_Math 4-Q4 Week 5.pptx Steps in Collecting Data_Math 4-Q4 Week 5.pptx Steps in Collecting Data
_Math 4-Q4 Week 5.pptx Steps in Collecting Data
 
Model Call Girl in Bikash Puri Delhi reach out to us at 🔝9953056974🔝
Model Call Girl in Bikash Puri  Delhi reach out to us at 🔝9953056974🔝Model Call Girl in Bikash Puri  Delhi reach out to us at 🔝9953056974🔝
Model Call Girl in Bikash Puri Delhi reach out to us at 🔝9953056974🔝
 
Employee wellbeing at the workplace.pptx
Employee wellbeing at the workplace.pptxEmployee wellbeing at the workplace.pptx
Employee wellbeing at the workplace.pptx
 
internship ppt on smartinternz platform as salesforce developer
internship ppt on smartinternz platform as salesforce developerinternship ppt on smartinternz platform as salesforce developer
internship ppt on smartinternz platform as salesforce developer
 
Crayon Activity Handout For the Crayon A
Crayon Activity Handout For the Crayon ACrayon Activity Handout For the Crayon A
Crayon Activity Handout For the Crayon A
 
Painted Grey Ware.pptx, PGW Culture of India
Painted Grey Ware.pptx, PGW Culture of IndiaPainted Grey Ware.pptx, PGW Culture of India
Painted Grey Ware.pptx, PGW Culture of India
 
History Class XII Ch. 3 Kinship, Caste and Class (1).pptx
History Class XII Ch. 3 Kinship, Caste and Class (1).pptxHistory Class XII Ch. 3 Kinship, Caste and Class (1).pptx
History Class XII Ch. 3 Kinship, Caste and Class (1).pptx
 
SOCIAL AND HISTORICAL CONTEXT - LFTVD.pptx
SOCIAL AND HISTORICAL CONTEXT - LFTVD.pptxSOCIAL AND HISTORICAL CONTEXT - LFTVD.pptx
SOCIAL AND HISTORICAL CONTEXT - LFTVD.pptx
 

Assignment 3 charts in excel

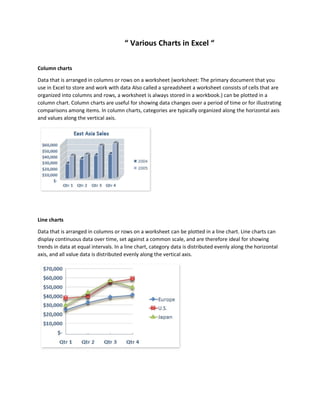
  • 1. “ Various Charts in Excel “ Column charts Data that is arranged in columns or rows on a worksheet (worksheet: The primary document that you use in Excel to store and work with data Also called a spreadsheet a worksheet consists of cells that are organized into columns and rows, a worksheet is always stored in a workbook.) can be plotted in a column chart. Column charts are useful for showing data changes over a period of time or for illustrating comparisons among items. In column charts, categories are typically organized along the horizontal axis and values along the vertical axis. Line charts Data that is arranged in columns or rows on a worksheet can be plotted in a line chart. Line charts can display continuous data over time, set against a common scale, and are therefore ideal for showing trends in data at equal intervals. In a line chart, category data is distributed evenly along the horizontal axis, and all value data is distributed evenly along the vertical axis.
  • 2. Pie charts Data that is arranged in one column or row only on a worksheet can be plotted in a pie chart. Pie charts show the size of items in one data series, proportional to the sum of the items. The data points in a pie chart are displayed as a percentage of the whole pie. Consider using a pie chart when -You only have one data series that you want to plot. None of the values that you want to plot are negative. -Almost none of the values that you want to plot are zero values. -You do not have more than seven categories. -The categories represent parts of the whole pie. Bar charts Data that is arranged in columns or rows on a worksheet can be plotted in a bar chart. Bar charts illustrate comparisons among individual items. Consider using a bar chart when: -The axis labels are long. -The values that are shown are durations.
  • 3. Area charts Data that is arranged in columns or rows on a worksheet can be plotted in an area chart. Area charts emphasize the magnitude of change over time, and can be used to draw attention to the total value across a trend. For example, data that represents profit over time can be plotted in an area chart to emphasize the total profit. By displaying the sum of the plotted values, an area chart also shows the relationship of parts to a whole. Surface charts Data that is arranged in columns or rows on a worksheet can be plotted in a surface chart. A surface chart is useful when you want to find optimum combinations between two sets of data. As in a topographic map, colors and patterns indicate areas that are in the same range of values. You can use a surface chart when both categories and data series are numeric values.