Blinkit: Revolutionizing the On-Demand Grocery Delivery Service.pptx
P56138144.pdf
1. American International Journal of Business Management (AIJBM)
ISSN- 2379-106X, www.aijbm.com Volume 5, Issue 06 (June-2022), PP 138-144
*Corresponding Author: OLALERE, Sunday Shina 1
www.aijbm.com 138 | Page
OIL PRICE VOLATILITY AND INDUSTRIAL OUTPUT IN
NIGERIA
OLALERE, Sunday Shina (Ph.D), AKODE, Thomas Ojo (Ph.D)
Lecturer in the Department of Economics, Faculty of the Social Sciences, Ekiti State University, Ado-Ekiti, Nigeria.
Lecturer in the Department of Economics, Faculty of the Social Sciences, Ekiti State University, Ado-Ekiti, Nigeria.
Abstract: This study examines the impact of Oil Price Volatility on Industrial Output in Nigeria between 1980 and
2019. The study makes use of both descriptive and quantitative analyses. The data for the variables were sourced
from World Development Indicator (WDI, 2022). From the descriptive analysis, the graph shows that both oil price
Volatility and Industrial Output are fluctuating throughout the period under review. While under the qualitative
analysis, GARCH is employed in one hand to establish the presence or otherwise of Volatility in Oil Price in Nigeria
and ARDL is also used in other hand to investigate the impact of Oil Price Volatility on Industrial Output in Nigeria.
The results shows from GARCH confirm the presence of Volatility in Oil Price in Nigeria, while the ARDL results
indicate that, Oil Price Volatility has positive impact on Industrial Output in Nigeria both in short-run and long-run.
Based on these findings, the study therefore recommends that government should put-in-place policies that promote
macroeconomic stability and also refocus her attention on how to make our local refineries functional and produced
up to their installed capacity in Nigeria.
KEYWORDS: Oil Price, Volatility, Industrial Output, GARCH and ARDL.
I. Introduction
It is the desire of every developing nation to attain certain level of development through industrialization.
Therefore, the role of energy especially oil price in the path of industrialization of any Economy cannot be
overemphasized. It has been noted that, the industrial infrastructure is affected by fluctuations in oil price which in
turn hindered the industrial output of developing Economies (Shahbaz, M; Sarwar, S; Chen, W. & Malik, M. N.,
2017; Sarwar, S. Khalfaoui, R. Waheed, R. & Dashgerdi, H. G., 2019 and Alao, R; Payaslioglu, C. & Alhassan, A.
2021). The recent invasion of Ukraine by Russia has forced the global oil price to move above $100 per barrel.
Fluctuations in oil price has generated a lot of concern among the policy makers across the globe because of its
negative impact on the net-importing countries like Nigeria, as it affects the output growth of a nation by negatively
impacted on its major determinants and industrial output (Muhammad, F. R; Magbool, H. S. & Samia, N. 2016).
Despite various policies put-in-place by successive governments in Nigeria in order to stimulate Industrial output
growth, the industrial output level in Nigeria still leave much to be desired. This might be as a result of volatility in
global oil price. Therefore, this study is out to examine the trend of oil price volatility and industrial output as well
as investigating the impact of oil price volatility on industrial output in Nigeria between 1980 and 2019.
II. Methodology
To achieve the objective of this study, the study employs a linear equation model which is specified thus;
)
,
,
,
,
( TRD
LEDgr
INF
REER
OPV
f
INDOgr
Where, INDOPgr = Industrial Output Growth Rate
OPV = Oil Price Volatility
REER = Real Effective Exchange Rate
INF = Inflation
LEDgr = Lending Growth Rate
TRD = Trade
III. Estimation Techniques
This study make use of GARCH to establish of the presence of volatility or otherwise in oil price as well as
ARDL cointegration to investigate the impact of oil price volatility on industrial output in Nigeria. Data on
industrial output, oil price, exchange rate, inflation and interest rate all sourced from World Development Indicator
(WDI) (2022) while data on Oil Price Volatility is generated from GARCH output.
2. OIL PRICE VOLATILITY AND INDUSTRIAL OUTPUT IN NIGERIA
*Corresponding Author: OLALERE, Sunday Shina 1
www.aijbm.com 139 | Page
IV. Results and Discussion of Findings
1.4.1 Descriptive Statistics
Table 1.1: Descriptive Statistics of Variables
Variables Observations Mean Std. Dev. Minimum Maximum Prob.
INDOPgr 42 2.1071 6.9999 -13.0910 22.1189 0.0473
OPV 42 0.4196 0.4135 -0.5189 0.8256 0.0199
INF 42 19.0024 16.8726 5.3822 72.8355 0.0000
LEDgr 42 17.4516 4.9414 8.4317 31.6500 0.6578
REER 42 149.0897 119.2801 49.7773 546.4059 0.0000
TRD 42 51.9945 15.8812 21.1244 81.8129 0.4100
Source: Author’s Computation, 2022
In Table 1.1 above, the results of the estimated mean value which shows the data distribution indicates that
of Real Effective Exchange Rate (REER) recorded the highest mean value of about 149.09 followed by value of
Inflation (INF) of about 19.00, value of Lending growth rate (LEDgr) of about 17.045, value of Industrial Output
growth rate (INDOPgr) of about 2.11 while the value of Oil Price Volatility (OPV) has the lowest mean value of
about 0.42. One major observation is standard deviation which measures the variability of the data and all values of
standard deviation are positive. Variable like REER (119.28) has higher standard deviation which means it
demonstrates higher variability while other variables like INF (16.87), INDOPgr (7.00), LEDgr (4.94) and OPV
(0.41) have low standard deviation with low variability respectively.
1.4..2 Volatility Test
Since one of the issues in this study is to check for volatility clustering in the exchange rate, the study starts
by checking for Heteroscedasticity in the real effective exchange rate data series. The lag length was selected at 5.
The result of the ARCH LM test is presented in Table 1.2
Table 1.2: Heteroskedasticity Test: ARCH ON OIL PRICE?
F-statistic 12.08027 Prob. F(5,277) 0.0000
Obs*R-squared 50.66247 Prob. Chi-Square(5) 0.0000
Test Equation:
Dependent Variable: RESID^2
Method: Least Squares
Date: 09/13/17 Time: 12:12
Sample (adjusted): 6 288
Included observations: 283 after adjustments
Source: Author’s Computation, 2021
Table 1.2 shows the results of ARCH(5) test. The probability of F-statistics and T*R2
are both zero, the
null hypothesis of no heteroskedsticity is rejected. This indicates the presence of ARCH (volatility) in OPV (Oil
Price Volatility) in Nigeria. With this result, the study then proceeds to test for degree of volatility in the data using
the ARCH/GARCH method. The results of the ARCH/GARCH are presented in Table 1.3.
3. OIL PRICE VOLATILITY AND INDUSTRIAL OUTPUT IN NIGERIA
*Corresponding Author: OLALERE, Sunday Shina 1
www.aijbm.com 140 | Page
Table 1.3: ARCH/GARCH Volatility Test
Dependent Variable: REER
Method: ML ARCH - Normal distribution (OPG - BHHH / Marquardt steps)
Presample variance: backcast (parameter = 0.7)
GARCH = C(4) + C(5)*RESID(-1)^2 + C(6)*GARCH(-1)
Variable Coefficient Std. Error
z-
Statistic Prob.
C 12.9963 11.8694 1.0949 0.2735
Resid(-1)^2 1.22028 0.49542 2.46312 0.0138
GARCH(-1) 0.5237 0.31738 0.03992 0.0282
R-squared -0.5874 Mean dependent var 43.469
Adjusted R-squared -0.5874 S.D. dependent var 30.9698
S.E. of regression 39.0194 Akaike info criterion 8.5039
Sum squared resid 59377.9 Schwarz criterion 8.6728
Log likelihood -166.078 Hannan-Quinn criter. 8.56496
Durbin-Watson stat 0.14206
Source: Author’s Computation, 2021
The GARCH
2
1
t
term is the volatility from previous period measures as the lag of the square residual
from the mean equation is 1.2202 and the GARCH term
2
1
t
is the last period forecast variance is 0.5237 in Table
1.3. They are both significant at 5% level.
The rule of thumb for determining the presence of volatility after summing the root of autoregressive model is that:
If
is less than 0.5, there is no volatility; If
fall between 0.5 and 1, there is volatility and If
is
greater than 1, this is a case of overshooting.
The sum of the two coefficients is 1.2202, which is greater than 1.0. This shows that Oil Price Volatility in Nigeria
is overshooting, that is, high level of volatility is present in Oil Price. To test the effect of this volatile nature on
economic growth in Nigeria our technique model a new series is generated designated as Oil Price Volatility
coefficient (OPV).
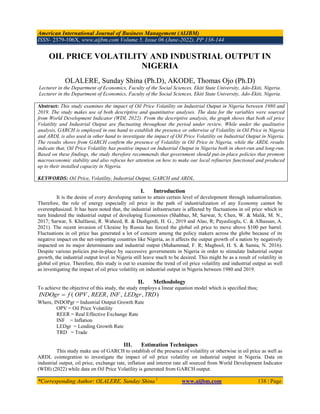
1.2 Trend Analysis of Oil Price Volatility and Industrial Output Growth in Nigeria
Figure 1.1: Trend of Oil Price Volatility and Industrial Output Growth Rate in Nigeria
-15
-10
-5
0
5
10
15
20
25
1980
1982
1984
1986
1988
1990
1992
1994
1996
1998
2000
2002
2004
2006
2008
2010
2012
2014
2016
2018
R
A
T
E
YEAR
TREND OF OIL PRICE VOLATILITY AND INDUSTRIAL OUTPUT
GROWTH IN NIGERIA
INDOPgr
OILPV
4. OIL PRICE VOLATILITY AND INDUSTRIAL OUTPUT IN NIGERIA
*Corresponding Author: OLALERE, Sunday Shina 1
www.aijbm.com 141 | Page
Figure 1.2: Trend of Industrial Output Growth Rate in Nigeria
Figure 1.3: Trend of Oil Price Volatility in Nigeria
The graphs in Fig. 1.1, 1.2 and 1.3 above show the trend of Oil Price Volatility and Industrial Output
growth rate in Nigeria. The Figures indicate, that industrial output growth rate is fluctuating throughout the period
while Oil Price Volatility is relatively stable between 1980 and 2002 and thereafter, started declining sharply until
2005 when marginal increase was recorded and further decline again in 2008. In 2011, some levels of appreciable
increase are recorded and this continues till 2015 when the trend started falling again. Comparatively, the industrial
output growth rate is relatively stable while that of oil price volatility keeps fluctuating during this period.
-15
-10
-5
0
5
10
15
20
25
1980
1982
1984
1986
1988
1990
1992
1994
1996
1998
2000
2002
2004
2006
2008
2010
2012
2014
2016
2018
R
A
T
E
YEAR
TREND OF INDUSTRIAL OUTPUT GROWTH RATE IN NIGERIA
INDOPgr
-0.6
-0.4
-0.2
0
0.2
0.4
0.6
0.8
1
1980
1982
1984
1986
1988
1990
1992
1994
1996
1998
2000
2002
2004
2006
2008
2010
2012
2014
2016
2018
R
A
T
E
YEAR
TREND OF OIL PRICE VOLATILITY IN NIGERIA
OILPV
5. OIL PRICE VOLATILITY AND INDUSTRIAL OUTPUT IN NIGERIA
*Corresponding Author: OLALERE, Sunday Shina 1
www.aijbm.com 142 | Page
1.3 Unit Root Test
Phillips-Perron Unit root test was carried out and the results are presented in Table 1.4 below.
Table 1.4: Unit Root Test
AT LEVEL FIRST DIFFERENCE
Variables PP
Statistics
1%
Critical
Value
5%
Critical
Value
PP
Statistics
1%
Critical
Value
5%
Critical
Value
Order
Integration
INDOPgr -5.20869 -3.6105 -2.9389 -------- --------- -------- I (0)
OPV -1.5320 -3.6105 -2.9390 -5.1695 -3.6156 -2.9412 I (1)
INF -2.8890 -3.6105 -2.9390 -11.9333 -3.6156 -2.9412 I (1)
REER -1.9753 -3.6105 -2.9390 -4.1352 -3.6156 -2.9412 I (1)
LEDgr -2.4000 -3.6105 -2.9390 -6.9079 -3.6156 -2.9412 I (1)
TRD -2.8308 -3.6105 -2.9390 -8.7876 -3.6156 -2.9412 I (1)
Source: Author’s Computation, 2022
The results of unit root test as shown on Table 1.4 examine the statistical prosperities of all the variables.
The Phillips-Perron t-Statistics for unit root was conducted for all the variables in the model. The null hypothesis
tested for the ADF is 0
: 1
0
H for all the variables while the alternative hypothesis is 0
: 1
1
H , for at least
one of the variables. The lag lengths are selected using the Akaike Information Criterion. The results of the test at
level and first difference are presented accordingly, the null hypothesis is that there is a unit in each series, that is,
each variable is non-stationary. The rule of thumb is that, the null hypothesis should be accepted if the Phillips-
Perront-statistics are less negative, meaning that, greater than the critical value at any chosen level of significance.
The results of Phillips-Perron on Table 1.4 therefore indicate that, all the variables are integrated of order one, that
is, I(1) except INDOPgr which is found to be integrated of order zero, that is, I(0). The results of unit root test thus
suggest the use of ARDL Co-integration test based on the fact that all variables in the model are not stationary of the
same order.
Table 1.5: Bound Test Result
ARDL Bounds Test
Included observations: 38
Null Hypothesis: No long-run relationships exist
Test Statistic Value K
F-statistic 5.9238 4
Critical Value Bounds
Significance I0 Bound I1 Bound
10% 2.45 3.52
5% 2.86 4.01
2.50% 3.25 4.49
1% 3.74 5.06
Source: Author’s Computation, 2022
The rule of thumb is that, if the computed F-statistics falls below the lower bound value I(0), the null
hypothesis, that is (no-cointegration) is accepted. But if the computed F-statistics exceeds the upper bound value
I(1), the null hypothesis is rejected thus, there is existence of long-run relationship. If the computed result falls
between the lower and upper bounds, then the test is inconclusive. Based on this, the result of Bound test from Table
1.5 shows that, the null hypothesis of no cointegration is rejected since the F- statistic value is5.9238whichis higher
than the upper bound critical value of 3.99 (restricted) at 1% level from Table 1.6. the study therefore concludes
that, there is cointegration among the estimated variables.
6. OIL PRICE VOLATILITY AND INDUSTRIAL OUTPUT IN NIGERIA
*Corresponding Author: OLALERE, Sunday Shina 1
www.aijbm.com 143 | Page
Table 1.6: Bound Test for Cointegration
5% Critical Value 1% Critical Values
Lower Upper Lower Upper
Restricted Intercept No trend 2.27 3.28 2.88 3.99
Unrestricted Intercept No trend 2.45 3.16 3.15 4.43
Source: Pesaran, et al, 2001
1.4.1 ARDL Long-Run and Short-Run Analyses
Table 1.5: ARDL Long Run and Short Run Results
Dependent Variable: INDOPgr
Dynamic regressors (2 lags, automatic): OPV, REER, LEDgr, INF, TRD
Selected Model: ARDL(1, 0, 2, 0, 1, 0)
Variable Coefficient Std. Error t-Statistics Prob.
Long Run Equation
OPV 1.0822 3.2880 0.3291 0.7445
REER -0.0245 0.0182 -1.3430 0.1901
LEDgr 0.2692 0.4129 0.6519 0.5198
INF -0.0031 0.0865 -0.0359 0.9717
TRD -0.0345 0.0803 -0.4292 0.6711
C 2.4282 9.3675 0.2592 0.7974
Short Run Equation
D(OPV) 1.2226 3.7454 0.3264 0.7465
D(REER) -0.0510 0.0211 -2.4172 0.0224
D(REER(-1)) 0.0409 0.0244 1.6735 0.1054
D(LEDgr) 0.3041 0.4686 0.6489 0.5217
D(INF) -0.1630 0.1002 -1.6259 0.1152
D(TRD) -0.0389 0.0920 -0.4235 0.6752
CointEq(-1) -1.1298 0.1821 6.2024 0.0000
Akaike Info Criterion 5.537692
Schwarz Criterion 6.199060
Hannan-Quinn Criterion 5.802728
Source: Author’s Computation, 2022
Note: * is 10 % level significance, ** 5% level of Significance and *** is 1% level of significance.
From Table 1.7 above, the long run equation result indicates that variables such as; REER, INF and TRD
show a negative insignificant relationship with the industrial growth rate in Nigeria. However, OPV and LEDgr
exhibit positive but also insignificant relationship with industrial output growth in Nigeria. This implies that a unit
increase in the level REER, INF and TRD lead to about 25, 3 and 3.5 per cent decrease respectively in the level of
industrial output growth in Nigeria, and a unit increase in OPV and LEDgr bring about an increase of about 108.22
and 27 per cent increase respectively in the level of industrial output growth rate in Nigeria in the long run. The
finding of this study is also supported by Akinlo and Apanisile (2015) who confirmed that, oil price volatility has
insignificant positive impact on economic growth in 20 selected non-oil producing countries in sub-Saharan Africa.
Again, the short run results indicate that, there is co-integration among the variables adopted in the equation. The
results further show that, changes in Oil Price Volatility D(OPV), change in Real Effective Exchange Rate in the
previous year D(REER(-1) and change in Lending growth rate D(LEDgr) are all found to have shown a positive but
insignificant impact on Industrial Output in Nigeria. However, Real Effective Exchange Rate D(REER), change in
Inflation D(INF) and change in Trade D(TRD) are said to have a negative but insignificant relationship with
Industrial Output except change in Real Effective Exchange Rate D(REER) that is said to be significant at 5 per cent
level. This implies that, a unit increase in changes in D(OPV), D(REER(-1)) and D(LEDgr) bring about 1.22, 0.04
and 0.30 increase in the level of industrial output in Nigeria in the short run. Again, the finding of this study is also
supported by Akinlo and Apanisile (2015) who confirmed that, oil price volatility has insignificant positive impact
on economic growth in 20 selected non-oil producing countries in sub-Saharan Africa. The coefficient of ECM
which measures the speed of adjustment back to equilibrium is -1.1298 and it is significant at 1% level with the
negative sign. This indicates that about 112.98% of previous disequilibrium in Nigeria is adjusted in the model in
the short run.
7. OIL PRICE VOLATILITY AND INDUSTRIAL OUTPUT IN NIGERIA
*Corresponding Author: OLALERE, Sunday Shina 1
www.aijbm.com 144 | Page
V. Discussion of Findings
Various econometric tests were conducted in this study. First of all, the study confirms the presence of
volatility in Oil Price. In line with the first objective of this research work, examine the trend of Oil Price Volatility
and Industrial Output growth rate in Nigeria. The result shows that Industrial Output growth rate show high degree
of oscillation throughout the period while the trend of Oil Price Volatility stable for the better part of the half of this
period under review before started declining. This implies that, Volatility in Oil Price has little or no impact on
industrial output in Nigeria. This might be as a result of the fact that bye products of oil that were consumed by the
industrial sector were produced locally during this period therefore fluctuations in Oil Price at international marker
has little or no effect on industrial output in Nigeria. And the fluctuations experienced in the later period of this
study were as a result of breaking down in our local refineries we started import the refined product. This result is in
conformity with the findings of Akinlo and Apanisile (2015) who confirmed that, oil price volatility has
insignificant positive impact on economic growth in 20 selected non-oil producing countries in sub-Saharan Africa.
To achieve the second objective of the study, stationary test was conducted first to avoid spurious regression, using
Phillips-Perron Statistical test. The results revealed that the series are not integrated of the same order. While
OILPV, INF, REER, LEDgr and TRD said to stationary at first difference, INDOPgr was found to be stationary at
level. Based on this, the condition for co-integration has not been met, therefore, the study proceeds to make use of
Autoregressive Distributed Lag (ARDL). The short run and long run ARDL results show that Oil Price Volatility
has an insignificant positive relationship with Industrial Output growth rate (INDOPgr) both in the short run and in
the long run. However, inflation (INF) and Real Effective Exchange Rate (REER) both show a negative impact on
Industrial Output growth rate both in the short run and in long run but only REER said to be significant in the short
run in Nigeria. This might be as a result of failure of some monetary policies to achieve certain macro objective
policies such as price and exchange rate stability. The finding of this study is also supported by Akinlo and
Apanisile (2015) who confirmed that, oil price volatility has insignificant positive impact on economic growth in 20
selected non-oil producing countries in sub-Saharan Africa. The long-run analysis from the ARDL results was
carried out. The results show that REER, INF, and TRD have an insignificant negative impact on industrial output
growth. This implies that a unit increase in REER, INF and TRD leads to a reduction in the level of industrial output
growth rate in Nigeria in the long run.
VI. Conclusion
Based on the results and findings of this study, the following conclusions were made: Judging from the
analysis of the impact of oil price volatility on industrial output growth rate in Nigeria, the study revealed that oil
price volatility has an insignificant positive impact on industrial output growth rate in Nigeria. Sequel to the findings
of insensitivity of industrial output growth rate to oil price volatility in Nigeria both in the short run and in the long
run, the following recommendations are made.
In view of all the aforementioned findings in this research work, the following recommendations are therefore
put forward: as the relationship between oil price volatility and industrial output growth rate in Nigeria found to be
positive but insignificant, it is therefore recommended that, government should put-in-place policies that promote
macroeconomic stability in Nigeria; for the fact that, oil price volatility demonstrates a positive impact on the
industrial output growth rate in Nigeria, government should refocus her attention on how to make our local
refineries functional and produced up to their installed capacity; inflation, though insignificant demonstrated that, it
has capacity to reduce poverty level in Nigeria. Therefore, government needs to formulate policies that will promote
moderate inflation so as to reduce poverty in Nigeria.
REFERENCES
[1]. Akinlo, T. & Apanisile, O. T. (2015): The Impact of volatility of Oil Price on the economic Growth in
Sub-Saharan Countries. Journal of Economics, Management and Trade. Pp 338-349
[2]. Alao, R.; Payaslioglu, C. & Alhassan, A. (2021): Oil Price Volatility and Industrial Production Nexus in
OPEC + Countries. ResearchGate. NIER International Conference Kollam. Pp 45-56.
[3]. Sarwar, S. Khalfaoui, R. Waheed, R. & Dashgerdi, H. G. (2019): Volatility Spillover Hedging: Evidence
from Asian Oil-Importing Countries. Resources Policy. 61. 479-488.
[4]. Shahbaz, M; Sarwar, S; Chen, W. & Malik, M. N. (2017): Dynamics of Electricity consumption, Oil Price
and Economic Growth: Global Perspective. Energy Policy.108. 256-270.
[5]. Muhammad, F. R; Magbool, H. S. & Samia, N. (2016): Impact of Oil Price Volatility on Manufacturing in
Pakistan. Bulletin of Energy Economics. 4(1). Pp 23-34.
[6]. World Development Indicator (WDI) (2022).