Day 4 trouble-shooting. SPSS
•
0 likes•134 views

This document contains instructions for 8 problems involving analyzing hospital patient data, car data, survey data, and other datasets using SPSS. For problem 1, the tasks include entering hospital patient data into SPSS, recoding variables, and extracting subsets of variables. For problem 2, the tasks involve recoding variables in car data like model year and country of origin. Other problems involve merging datasets, plotting charts, conducting statistical tests, and preparing SPSS syntax.
Report
Share
Report
Share
Download to read offline

Recommended
Recommended
More Related Content
Similar to Day 4 trouble-shooting. SPSS
Similar to Day 4 trouble-shooting. SPSS (16)
This project is made up of 4 different parts. The dataset for al
This project is made up of 4 different parts. The dataset for al
InstructionDue Date 6 pm on October 28 (Wed)Part IProbability a.docx
InstructionDue Date 6 pm on October 28 (Wed)Part IProbability a.docx
AbstractKnowledge-Based computerized management information syst.docx
AbstractKnowledge-Based computerized management information syst.docx
AbstractKnowledge-Based computerized management information syst.docx
AbstractKnowledge-Based computerized management information syst.docx
IE332Engineering Statistics IINOTES· Show your work,
IE332Engineering Statistics IINOTES· Show your work,
EMPIRICAL PROJECTObjective to help students put in practice w.docx
EMPIRICAL PROJECTObjective to help students put in practice w.docx
Points 250Assignment 3Biggest Challenges Facing Organizations .docx
Points 250Assignment 3Biggest Challenges Facing Organizations .docx
As mentioned earlier, the mid-term will have conceptual and quanti.docx
As mentioned earlier, the mid-term will have conceptual and quanti.docx
Suppose you are interested in selecting a group of six households Experience...
Suppose you are interested in selecting a group of six households Experience...
Answer all 20 questions. Make sure your answers are as complet.docx
Answer all 20 questions. Make sure your answers are as complet.docx
More from abir hossain
More from abir hossain (20)
Line staff, responsiblity of hrm lecture_ 02 class
Line staff, responsiblity of hrm lecture_ 02 class
Recently uploaded
God is a creative God Gen 1:1. All that He created was “good”, could also be translated “beautiful”. God created man in His own image Gen 1:27. Maths helps us discover the beauty that God has created in His world and, in turn, create beautiful designs to serve and enrich the lives of others.
Explore beautiful and ugly buildings. Mathematics helps us create beautiful d...
Explore beautiful and ugly buildings. Mathematics helps us create beautiful d...christianmathematics
APM Welcome
Tuesday 30 April 2024
APM North West Network Conference, Synergies Across Sectors
Presented by:
Professor Adam Boddison OBE, Chief Executive Officer, APM
Conference overview:
https://www.apm.org.uk/community/apm-north-west-branch-conference/
Content description:
APM welcome from CEO
The main conference objective was to promote the Project Management profession with interaction between project practitioners, APM Corporate members, current project management students, academia and all who have an interest in projects.APM Welcome, APM North West Network Conference, Synergies Across Sectors
APM Welcome, APM North West Network Conference, Synergies Across SectorsAssociation for Project Management
This presentation was provided by William Mattingly of the Smithsonian Institution, during the fourth segment of the NISO training series "AI & Prompt Design." Session Four: Structured Data and Assistants, was held on April 25, 2024.Mattingly "AI & Prompt Design: Structured Data, Assistants, & RAG"
Mattingly "AI & Prompt Design: Structured Data, Assistants, & RAG"National Information Standards Organization (NISO)
Recently uploaded (20)
Explore beautiful and ugly buildings. Mathematics helps us create beautiful d...
Explore beautiful and ugly buildings. Mathematics helps us create beautiful d...
BAG TECHNIQUE Bag technique-a tool making use of public health bag through wh...
BAG TECHNIQUE Bag technique-a tool making use of public health bag through wh...
APM Welcome, APM North West Network Conference, Synergies Across Sectors
APM Welcome, APM North West Network Conference, Synergies Across Sectors
Z Score,T Score, Percential Rank and Box Plot Graph
Z Score,T Score, Percential Rank and Box Plot Graph
Kisan Call Centre - To harness potential of ICT in Agriculture by answer farm...
Kisan Call Centre - To harness potential of ICT in Agriculture by answer farm...
Mattingly "AI & Prompt Design: Structured Data, Assistants, & RAG"
Mattingly "AI & Prompt Design: Structured Data, Assistants, & RAG"
Day 4 trouble-shooting. SPSS
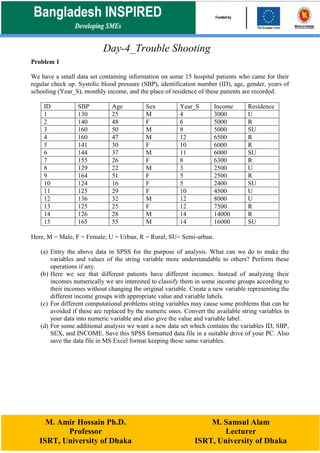
- 1. M. Amir Hossain Ph.D. Professor ISRT, University of Dhaka Day-4_Trouble Shooting M. Samsul Alam Lecturer ISRT, University of Dhaka Problem 1 We have a small data set containing information on some 15 hospital patients who came for their regular check up. Systolic blood pressure (SBP), identification number (ID), age, gender, years of schooling (Year_S), monthly income, and the place of residence of these patients are recorded. ID SBP Age Sex Year_S Income Residence 1 130 25 M 4 3000 U 2 140 48 F 6 5000 R 3 160 50 M 8 5000 SU 4 160 47 M 12 6500 R 5 141 30 F 10 6000 R 6 144 37 M 11 6000 SU 7 155 26 F 8 6300 R 8 129 22 M 3 2500 U 9 164 51 F 5 2500 R 10 124 16 F 5 2400 SU 11 125 29 F 10 4500 U 12 136 32 M 12 8000 U 13 125 25 F 12 7500 R 14 126 28 M 14 14000 R 15 165 55 M 14 16000 SU Here, M = Male, F = Female; U = Urban; R = Rural; SU= Semi-urban. (a) Entry the above data in SPSS for the purpose of analysis. What can we do to make the variables and values of the string variable more understandable to others? Perform these operations if any. (b) Here we see that different patients have different incomes. Instead of analyzing their incomes numerically we are interested to classify them in some income groups according to their incomes without changing the original variable. Create a new variable representing the different income groups with appropriate value and variable labels. (c) For different computational problems string variables may cause some problems that can be avoided if these are replaced by the numeric ones. Convert the available string variables in your data into numeric variable and also give the value and variable label. (d) For some additional analysis we want a new data set which contains the variables ID, SBP, SEX, and INCOME. Save this SPSS formatted data file in a suitable drive of your PC. Also save the data file in MS Excel format keeping these same variables.
- 2. M. Amir Hossain Ph.D. Professor ISRT, University of Dhaka Day-4_Trouble Shooting M. Samsul Alam Lecturer ISRT, University of Dhaka Problem 2 A SPSS formatted dataset ‘Car.sav’ is given. There are eight variables giving information on some 406 cars namely mpg (Miles per Gallon), engine (Engine Displacement in cubic inches), horse (Horsepower), weight (Vehicle Weight in lbs.), accel (Time to Accelerate from 0 to 60 mph in seconds), year (Model Year), origin (Country of Origin), and cylinder (Number of Cylinders). Answer the followings: (a) Instead of representing model in year we may be interested in type of model which is defined as follows: Type of Model Model Year Old 70-75 Modern 76-80 Ultramodern 81-82 Now create a new variable which defines the type without altering the original year variable according to the above instruction. (b) Create a variable n_origin from existing variable origin where the values of origin 1, 2, 3 are replaced by 10, 20, and 30 respectivly. (c) Compute a new variable named hiwgt whose value is ‘good’ if weight is more than 3000 lb. (d) Find out the price (variable name should be price) of the car if the price is determined on the basis of the number of cylinders given as follows: (e) Additionally $500 more to be added to the cars with horsepower > 100. Now calculate the final price of the cars creating a new variable with the consideration of this additional price. (f) From the given dataset ‘Cars’ create the following datasets using the sub setting conditions given below and save them all in D drive of your computer: Name of data set Sub setting Conditions amercar only for origin: America japcar only for origin: Japanese Cyl4 For cylinder = 8 and Keep variables mpg, engine, horse, and weight Number of cylinders in car Price 3 $ 10,000 4 $ 12,000 5 $ 14,000 6 $ 16,000 8 $ 18,000
- 3. M. Amir Hossain Ph.D. Professor ISRT, University of Dhaka Day-4_Trouble Shooting M. Samsul Alam Lecturer ISRT, University of Dhaka Problem 3 a) Two data sets Anxiety1.sav and Anxiety2.sav contain information of six trials performed on twelve subjects. The first data set containing the information on first four trial and the other data set containing the remaining. Merge these two data set and save the new data as Anxiety.sav. b) The Anxietya.sav file containing information on few variables from 30 individuals whereas the Anxietyb.sav file containing information on the same variables but from another 18 individuals. Append the data to obtain a single data file that will contain information of all the 48 individuals. Problem 4 A SPSS formatted dataset ‘Demo.sav’ is given. There are eight variables giving information on some 6400 cases namely age (age in years), income (household income in thousands), inccat (income category in thousands), car (price of primary vehicle), carcat (primary vehicle price category), jobsat (job satisfaction), gender (gender) and reside (number of people in household). Answer the followings: (a) Draw a bar chart of mean income with carcat and mean income with jobsat. Comment on the result. (b) Draw histogram of age and income with normal curve. Comment on the result. (c) Draw a pie chart of reside. (d) Draw boxplot of income for gender. Can we use arithmetic mean to calculate the average income for gender? (e) Make frequency table for age, taking class interval 10 starting from age 18. Also find the mean, median, mode, quartiles, 90th percentile and standard deviation. Problem 5 Glaucoma is a leading cause of blindness in the US. The following table gives the measurement of the corneal thickness, in microns, of eight patients who had glaucoma in one eye but not in the other. Patient Normal Glaucoma 1 2 3 4 5 6 7 8 484 478 492 444 436 399 464 476 488 479 480 426 440 410 458 460 At the 10% level of significance, do the data provide sufficient evidence to conclude that mean corneal thickness is greater in normal eyes than in eyes with glaucoma?
- 4. M. Amir Hossain Ph.D. Professor ISRT, University of Dhaka Day-4_Trouble Shooting M. Samsul Alam Lecturer ISRT, University of Dhaka Problem 6 A corporation is trying to decide which of the three makes of automobile to order for its fleet- domestic, Japanese, or European. Five cars of each type were ordered, and after 10,000 miles of driving, the operating cost per mile of each was assessed. The accompanying results in cents per mile were obtained. Domestic Japanese European 18.0 17.6 15.4 19.2 16.9 20.1 15.6 16.1 15.3 15.4 19.3 17.4 15.1 18.6 16.1 (a) Set out the analysis of variance table. (b) Test the null hypothesis that the population mean operating costs per miles are the same for these three types of cars. Problem 7 Using the data ‘hsb.sav’ solve the following problems. (a) Suppose that the general population consists of 10% Hispanic, 10% Asian, 10% African American and 70% White folks. Test whether the observed proportions from our sample population differ significantly from these hypothesized proportions? (b) Test whether there is any association between the type of school attended and the student’s gender? Also test whether there is any association between the student’s gender and their socio-economic status?
- 5. M. Amir Hossain Ph.D. Professor ISRT, University of Dhaka Day-4_Trouble Shooting M. Samsul Alam Lecturer ISRT, University of Dhaka Problem 8 Do the subsequent tasks using SPSS based on the following sample questionnaire: a) Construct a SPSS data entry layout for the questions listed in the given sample questionnaire with suitable variable names and description. b) Add appropriate value labels for the variables when required. c) Specify the scale of measurements for all the variables. d) Assign user defined missing values for every variable. e) Change the settings so that the data view window will show the value labels.
- 6. M. Amir Hossain Ph.D. Professor ISRT, University of Dhaka Day 4: Second Session Trouble Shooting: I M. Samsul Alam Lecturer ISRT, University of Dhaka