SlideShare a Scribd company logo
1 of 14
Preparedby
Volkan OBAN
BOXPLOT EXAMPLES in R
AND BEESWARM:
CODES:
1-str(airquality)
'data.frame': 153 obs. of 6 variables:
$ Ozone : int 41 36 12 18 NA 28 23 19 8 NA ...
$ Solar.R: int 190 118 149 313 NA NA 299 99 19 194 ...
$ Wind : num 7.4 8 12.6 11.5 14.3 14.9 8.6 13.8 20.1 8.6 ...
$ Temp : int 67 72 74 62 56 66 65 59 61 69 ...
$ Month : int 5 5 5 5 5 5 5 5 5 5 ...
$ Day : int 1 2 3 4 5 6 7 8 9 10 ...
> boxplot(airquality$Ozone)
> boxplot(airquality$Ozone,
+ main="Mean ozone in parts per billion at Roosevelt Island",
+ xlab="Parts Per Billion",
+ ylab="Ozone",
+ col="orange",
+ border="brown",
+ horizontal=TRUE,
+ notch=TRUE
+ )
> ozone <- airquality$Ozone
> temp <- airquality$Temp
> ozone_norm <- rnorm(200,mean=mean(ozone, na.rm=TRUE), sd=sd(ozone, na.rm=
TRUE))
> temp_norm <- rnorm(200,mean=mean(temp, na.rm=TRUE), sd=sd(temp, na.rm=TRU
E))
> boxplot(ozone, ozone_norm, temp, temp_norm,
+ main="Multiple boxplots for comparision",
+ at=c(1,2,4,5),
+ names=c("ozone", "normal", "temp", "normal"),
+ las=2,
+ col=c("orange","red"),
+ border="brown",
+ horizontal=TRUE,
+ notch=TRUE)
Example:
2-qplot(class, hwy, fill=factor(year), data=mpg, geom="boxplot", position
="dodge")+theme_bw()
3-data<-data.frame(Stat11=rnorm(100,mean=3,sd=2),
+ Stat21=rnorm(100,mean=4,sd=1),
+ Stat31=rnorm(100,mean=6,sd=0.5),
+ Stat41=rnorm(100,mean=10,sd=0.5),
+ Stat12=rnorm(100,mean=4,sd=2),
+ Stat22=rnorm(100,mean=4.5,sd=2),
+ Stat32=rnorm(100,mean=7,sd=0.5),
+ Stat42=rnorm(100,mean=8,sd=3),
+ Stat13=rnorm(100,mean=6,sd=0.5),
+ Stat23=rnorm(100,mean=5,sd=3),
+ Stat33=rnorm(100,mean=8,sd=0.2),
+ Stat43=rnorm(100,mean=4,sd=4))
> boxplot(data)
4-> library(ggplot2)
> a <- runif(10)
> b <- runif(12)
> c <- runif(7)
> d <- runif(15)
> group <- factor(rep(1:4, c(10, 12, 7, 15)))
> mydata <- data.frame(c(a,b,c,d), group)
> names(mydata) <- c("value", "group")
> min.mean.sd.max <- function(x) {
+ r <- c(min(x), mean(x) - sd(x), mean(x), mean(x) + sd(x), max(x))
+ names(r) <- c("ymin", "lower", "middle", "upper", "ymax")
+ r
+ }
> p1 <- ggplot(aes(y = value, x = factor(group)), data = mydata)
> p1 <- p1 + stat_summary(fun.data = min.mean.sd.max, geom = "boxplot") + g
eom_jitter(position=position_jitter(width=.2), size=3) + ggtitle("Boxplot c
on media, 95%CI, valore min. e max.") + xlab("Gruppi") + ylab("Valori")
> p1
5-install.packages("GGally")
ds = read.csv("http://www.math.smith.edu/r/data/help.csv")
> ds$sex = as.factor(ifelse(ds$female==1, "female", "male"))
> ds$housing = as.factor(ifelse(ds$homeless==1, "homeless", "housed"))
> smallds = subset(ds, select=c("housing", "sex", "i1", "cesd"))
library(GGally)
> ggpairs(smallds, diag=list(continuous="density", discrete="bar"), axisLab
els="show") #1.graph
>ggpairs(ds, columns=c("housing", "sex", "i1", "cesd"),
+ diag=list(continuous="density", discrete="bar"), axisLabels="sh
ow") [#2.graph]
1.graph
Secondgraph
6-
uData <- rnorm(20)
> vData <- rnorm(20,mean=5)
> wData <- uData + 2*vData + rnorm(20,sd=0.5)
> xData <- -2*uData+rnorm(20,sd=0.1)
> yData <- 3*vData+rnorm(20,sd=2.5)
> d <- data.frame(u=uData,v=vData,w=wData,x=xData,y=yData)
> pairs(d)
7- library(ggplot2)
>
> # Plot Skeleton
> p <- ggplot(diamonds, aes(x=factor(color), y=carat))
>
> # Boxplot of diamond carat as a function of diamond color
> p + geom_boxplot()
LAST EXAMPLE:
install.packages("beeswarm")
#data
set.seed(1234)
bimodal <- c(rnorm(250, -2, 0.6), rnorm(250, 2, 0.6))
uniform <- runif(500, -4, 4)
normal <- rnorm(500, 0, 1.5)
dataf <- data.frame (group = rep(c("bimodal","uniform", "normal"), each =
500), xv = c(bimodal, uniform, normal), cg = rep( c("A","B"), 750))
require(beeswarm)
beeswarm(xv ~ group, data = dataf,method = 'swarm',
pch = 16, pwcol = as.numeric(cg),
xlab = '', ylab = 'xv', labels = c('bimodal', 'uniform', 'normal'))
Boxplot and Beeswarm Plots in R

More Related Content

What's hot

Stefan Kanev: Clojure, ClojureScript and Why They're Awesome at I T.A.K.E. Un...
Stefan Kanev: Clojure, ClojureScript and Why They're Awesome at I T.A.K.E. Un...Stefan Kanev: Clojure, ClojureScript and Why They're Awesome at I T.A.K.E. Un...
Stefan Kanev: Clojure, ClojureScript and Why They're Awesome at I T.A.K.E. Un...Mozaic Works
 
Oscilador de duffing forzado - coficación en fortran 90
Oscilador de duffing forzado - coficación en fortran 90Oscilador de duffing forzado - coficación en fortran 90
Oscilador de duffing forzado - coficación en fortran 90Jose Leon
 
Зависимые типы в GHC 8. Максим Талдыкин
Зависимые типы в GHC 8. Максим ТалдыкинЗависимые типы в GHC 8. Максим Талдыкин
Зависимые типы в GHC 8. Максим ТалдыкинЮрий Сыровецкий
 
The groovy puzzlers (as Presented at JavaOne 2014)
The groovy puzzlers (as Presented at JavaOne 2014)The groovy puzzlers (as Presented at JavaOne 2014)
The groovy puzzlers (as Presented at JavaOne 2014)GroovyPuzzlers
 
Clustering com numpy e cython
Clustering com numpy e cythonClustering com numpy e cython
Clustering com numpy e cythonAnderson Dantas
 
dplyr and torrents from cpasbien
dplyr and torrents from cpasbiendplyr and torrents from cpasbien
dplyr and torrents from cpasbienRomain Francois
 
Bar plots.ipynb colaboratory
Bar plots.ipynb   colaboratoryBar plots.ipynb   colaboratory
Bar plots.ipynb colaboratoryGokuldhev mony
 
A gentle introduction to functional programming through music and clojure
A gentle introduction to functional programming through music and clojureA gentle introduction to functional programming through music and clojure
A gentle introduction to functional programming through music and clojurePaul Lam
 

What's hot (18)

Om (Cont.)
Om (Cont.)Om (Cont.)
Om (Cont.)
 
RHadoop の紹介
RHadoop の紹介RHadoop の紹介
RHadoop の紹介
 
Introduction to R
Introduction to RIntroduction to R
Introduction to R
 
Bmpread
BmpreadBmpread
Bmpread
 
Py lecture5 python plots
Py lecture5 python plotsPy lecture5 python plots
Py lecture5 python plots
 
Stefan Kanev: Clojure, ClojureScript and Why They're Awesome at I T.A.K.E. Un...
Stefan Kanev: Clojure, ClojureScript and Why They're Awesome at I T.A.K.E. Un...Stefan Kanev: Clojure, ClojureScript and Why They're Awesome at I T.A.K.E. Un...
Stefan Kanev: Clojure, ClojureScript and Why They're Awesome at I T.A.K.E. Un...
 
dplyr
dplyrdplyr
dplyr
 
Oscilador de duffing forzado - coficación en fortran 90
Oscilador de duffing forzado - coficación en fortran 90Oscilador de duffing forzado - coficación en fortran 90
Oscilador de duffing forzado - coficación en fortran 90
 
03
0303
03
 
Coding
CodingCoding
Coding
 
Polar plots with R
Polar plots with RPolar plots with R
Polar plots with R
 
Зависимые типы в GHC 8. Максим Талдыкин
Зависимые типы в GHC 8. Максим ТалдыкинЗависимые типы в GHC 8. Максим Талдыкин
Зависимые типы в GHC 8. Максим Талдыкин
 
The groovy puzzlers (as Presented at JavaOne 2014)
The groovy puzzlers (as Presented at JavaOne 2014)The groovy puzzlers (as Presented at JavaOne 2014)
The groovy puzzlers (as Presented at JavaOne 2014)
 
Clustering com numpy e cython
Clustering com numpy e cythonClustering com numpy e cython
Clustering com numpy e cython
 
dplyr and torrents from cpasbien
dplyr and torrents from cpasbiendplyr and torrents from cpasbien
dplyr and torrents from cpasbien
 
Bar plots.ipynb colaboratory
Bar plots.ipynb   colaboratoryBar plots.ipynb   colaboratory
Bar plots.ipynb colaboratory
 
A gentle introduction to functional programming through music and clojure
A gentle introduction to functional programming through music and clojureA gentle introduction to functional programming through music and clojure
A gentle introduction to functional programming through music and clojure
 
Card pack
Card packCard pack
Card pack
 

Similar to Boxplot and Beeswarm Plots in R

Артём Акуляков - F# for Data Analysis
Артём Акуляков - F# for Data AnalysisАртём Акуляков - F# for Data Analysis
Артём Акуляков - F# for Data AnalysisSpbDotNet Community
 
Advanced Data Visualization Examples with R-Part II
Advanced Data Visualization Examples with R-Part IIAdvanced Data Visualization Examples with R-Part II
Advanced Data Visualization Examples with R-Part IIDr. Volkan OBAN
 
The Ring programming language version 1.10 book - Part 81 of 212
The Ring programming language version 1.10 book - Part 81 of 212The Ring programming language version 1.10 book - Part 81 of 212
The Ring programming language version 1.10 book - Part 81 of 212Mahmoud Samir Fayed
 
Clojure for Data Science
Clojure for Data ScienceClojure for Data Science
Clojure for Data Sciencehenrygarner
 
Surface3d in R and rgl package.
Surface3d in R and rgl package.Surface3d in R and rgl package.
Surface3d in R and rgl package.Dr. Volkan OBAN
 
Send + More = Money – Let’s mash 2 monads to solve a simple CSP
Send + More = Money – Let’s mash 2 monads to solve a simple CSPSend + More = Money – Let’s mash 2 monads to solve a simple CSP
Send + More = Money – Let’s mash 2 monads to solve a simple CSPFilippo Vitale
 
ASFWS 2012 - Obfuscator, ou comment durcir un code source ou un binaire contr...
ASFWS 2012 - Obfuscator, ou comment durcir un code source ou un binaire contr...ASFWS 2012 - Obfuscator, ou comment durcir un code source ou un binaire contr...
ASFWS 2012 - Obfuscator, ou comment durcir un code source ou un binaire contr...Cyber Security Alliance
 
数学カフェ 確率・統計・機械学習回 「速習 確率・統計」
数学カフェ 確率・統計・機械学習回 「速習 確率・統計」数学カフェ 確率・統計・機械学習回 「速習 確率・統計」
数学カフェ 確率・統計・機械学習回 「速習 確率・統計」Ken'ichi Matsui
 
{shiny}と{leaflet}による地図アプリ開発Tips
{shiny}と{leaflet}による地図アプリ開発Tips{shiny}と{leaflet}による地図アプリ開発Tips
{shiny}と{leaflet}による地図アプリ開発TipsTakashi Kitano
 
Plot3D package in R-package-for-3d-and-4d-graph-Data visualization.
Plot3D package in R-package-for-3d-and-4d-graph-Data visualization.Plot3D package in R-package-for-3d-and-4d-graph-Data visualization.
Plot3D package in R-package-for-3d-and-4d-graph-Data visualization.Dr. Volkan OBAN
 
Using R for Building a Simple and Effective Dashboard
Using R for Building a Simple and Effective DashboardUsing R for Building a Simple and Effective Dashboard
Using R for Building a Simple and Effective DashboardAndrea Gigli
 
第13回数学カフェ「素数!!」二次会 LT資料「乱数!!」
第13回数学カフェ「素数!!」二次会 LT資料「乱数!!」第13回数学カフェ「素数!!」二次会 LT資料「乱数!!」
第13回数学カフェ「素数!!」二次会 LT資料「乱数!!」Ken'ichi Matsui
 
SAT/SMT solving in Haskell
SAT/SMT solving in HaskellSAT/SMT solving in Haskell
SAT/SMT solving in HaskellMasahiro Sakai
 
Haskellで学ぶ関数型言語
Haskellで学ぶ関数型言語Haskellで学ぶ関数型言語
Haskellで学ぶ関数型言語ikdysfm
 

Similar to Boxplot and Beeswarm Plots in R (20)

Артём Акуляков - F# for Data Analysis
Артём Акуляков - F# for Data AnalysisАртём Акуляков - F# for Data Analysis
Артём Акуляков - F# for Data Analysis
 
CLIM Undergraduate Workshop: (Attachment) Performing Extreme Value Analysis (...
CLIM Undergraduate Workshop: (Attachment) Performing Extreme Value Analysis (...CLIM Undergraduate Workshop: (Attachment) Performing Extreme Value Analysis (...
CLIM Undergraduate Workshop: (Attachment) Performing Extreme Value Analysis (...
 
Joclad 2010 d
Joclad 2010 dJoclad 2010 d
Joclad 2010 d
 
Advanced Data Visualization Examples with R-Part II
Advanced Data Visualization Examples with R-Part IIAdvanced Data Visualization Examples with R-Part II
Advanced Data Visualization Examples with R-Part II
 
CLUSTERGRAM
CLUSTERGRAMCLUSTERGRAM
CLUSTERGRAM
 
The Ring programming language version 1.10 book - Part 81 of 212
The Ring programming language version 1.10 book - Part 81 of 212The Ring programming language version 1.10 book - Part 81 of 212
The Ring programming language version 1.10 book - Part 81 of 212
 
Clojure for Data Science
Clojure for Data ScienceClojure for Data Science
Clojure for Data Science
 
Surface3d in R and rgl package.
Surface3d in R and rgl package.Surface3d in R and rgl package.
Surface3d in R and rgl package.
 
Send + More = Money – Let’s mash 2 monads to solve a simple CSP
Send + More = Money – Let’s mash 2 monads to solve a simple CSPSend + More = Money – Let’s mash 2 monads to solve a simple CSP
Send + More = Money – Let’s mash 2 monads to solve a simple CSP
 
ASFWS 2012 - Obfuscator, ou comment durcir un code source ou un binaire contr...
ASFWS 2012 - Obfuscator, ou comment durcir un code source ou un binaire contr...ASFWS 2012 - Obfuscator, ou comment durcir un code source ou un binaire contr...
ASFWS 2012 - Obfuscator, ou comment durcir un code source ou un binaire contr...
 
数学カフェ 確率・統計・機械学習回 「速習 確率・統計」
数学カフェ 確率・統計・機械学習回 「速習 確率・統計」数学カフェ 確率・統計・機械学習回 「速習 確率・統計」
数学カフェ 確率・統計・機械学習回 「速習 確率・統計」
 
{shiny}と{leaflet}による地図アプリ開発Tips
{shiny}と{leaflet}による地図アプリ開発Tips{shiny}と{leaflet}による地図アプリ開発Tips
{shiny}と{leaflet}による地図アプリ開発Tips
 
Plot3D package in R-package-for-3d-and-4d-graph-Data visualization.
Plot3D package in R-package-for-3d-and-4d-graph-Data visualization.Plot3D package in R-package-for-3d-and-4d-graph-Data visualization.
Plot3D package in R-package-for-3d-and-4d-graph-Data visualization.
 
Using R for Building a Simple and Effective Dashboard
Using R for Building a Simple and Effective DashboardUsing R for Building a Simple and Effective Dashboard
Using R for Building a Simple and Effective Dashboard
 
第13回数学カフェ「素数!!」二次会 LT資料「乱数!!」
第13回数学カフェ「素数!!」二次会 LT資料「乱数!!」第13回数学カフェ「素数!!」二次会 LT資料「乱数!!」
第13回数学カフェ「素数!!」二次会 LT資料「乱数!!」
 
Python grass
Python grassPython grass
Python grass
 
Pop3ck sh
Pop3ck shPop3ck sh
Pop3ck sh
 
SAT/SMT solving in Haskell
SAT/SMT solving in HaskellSAT/SMT solving in Haskell
SAT/SMT solving in Haskell
 
Perl6 one-liners
Perl6 one-linersPerl6 one-liners
Perl6 one-liners
 
Haskellで学ぶ関数型言語
Haskellで学ぶ関数型言語Haskellで学ぶ関数型言語
Haskellで学ぶ関数型言語
 

More from Dr. Volkan OBAN

Conference Paper:IMAGE PROCESSING AND OBJECT DETECTION APPLICATION: INSURANCE...
Conference Paper:IMAGE PROCESSING AND OBJECT DETECTION APPLICATION: INSURANCE...Conference Paper:IMAGE PROCESSING AND OBJECT DETECTION APPLICATION: INSURANCE...
Conference Paper:IMAGE PROCESSING AND OBJECT DETECTION APPLICATION: INSURANCE...Dr. Volkan OBAN
 
Covid19py Python Package - Example
Covid19py  Python Package - ExampleCovid19py  Python Package - Example
Covid19py Python Package - ExampleDr. Volkan OBAN
 
Object detection with Python
Object detection with Python Object detection with Python
Object detection with Python Dr. Volkan OBAN
 
Python - Rastgele Orman(Random Forest) Parametreleri
Python - Rastgele Orman(Random Forest) ParametreleriPython - Rastgele Orman(Random Forest) Parametreleri
Python - Rastgele Orman(Random Forest) ParametreleriDr. Volkan OBAN
 
Linear Programming wi̇th R - Examples
Linear Programming wi̇th R - ExamplesLinear Programming wi̇th R - Examples
Linear Programming wi̇th R - ExamplesDr. Volkan OBAN
 
"optrees" package in R and examples.(optrees:finds optimal trees in weighted ...
"optrees" package in R and examples.(optrees:finds optimal trees in weighted ..."optrees" package in R and examples.(optrees:finds optimal trees in weighted ...
"optrees" package in R and examples.(optrees:finds optimal trees in weighted ...Dr. Volkan OBAN
 
k-means Clustering in Python
k-means Clustering in Pythonk-means Clustering in Python
k-means Clustering in PythonDr. Volkan OBAN
 
Naive Bayes Example using R
Naive Bayes Example using  R Naive Bayes Example using  R
Naive Bayes Example using R Dr. Volkan OBAN
 
k-means Clustering and Custergram with R
k-means Clustering and Custergram with Rk-means Clustering and Custergram with R
k-means Clustering and Custergram with RDr. Volkan OBAN
 
Data Science and its Relationship to Big Data and Data-Driven Decision Making
Data Science and its Relationship to Big Data and Data-Driven Decision MakingData Science and its Relationship to Big Data and Data-Driven Decision Making
Data Science and its Relationship to Big Data and Data-Driven Decision MakingDr. Volkan OBAN
 
Data Visualization with R.ggplot2 and its extensions examples.
Data Visualization with R.ggplot2 and its extensions examples.Data Visualization with R.ggplot2 and its extensions examples.
Data Visualization with R.ggplot2 and its extensions examples.Dr. Volkan OBAN
 
Scikit-learn Cheatsheet-Python
Scikit-learn Cheatsheet-PythonScikit-learn Cheatsheet-Python
Scikit-learn Cheatsheet-PythonDr. Volkan OBAN
 
Python Pandas for Data Science cheatsheet
Python Pandas for Data Science cheatsheet Python Pandas for Data Science cheatsheet
Python Pandas for Data Science cheatsheet Dr. Volkan OBAN
 
Pandas,scipy,numpy cheatsheet
Pandas,scipy,numpy cheatsheetPandas,scipy,numpy cheatsheet
Pandas,scipy,numpy cheatsheetDr. Volkan OBAN
 
ReporteRs package in R. forming powerpoint documents-an example
ReporteRs package in R. forming powerpoint documents-an exampleReporteRs package in R. forming powerpoint documents-an example
ReporteRs package in R. forming powerpoint documents-an exampleDr. Volkan OBAN
 
ReporteRs package in R. forming powerpoint documents-an example
ReporteRs package in R. forming powerpoint documents-an exampleReporteRs package in R. forming powerpoint documents-an example
ReporteRs package in R. forming powerpoint documents-an exampleDr. Volkan OBAN
 
R-ggplot2 package Examples
R-ggplot2 package ExamplesR-ggplot2 package Examples
R-ggplot2 package ExamplesDr. Volkan OBAN
 
R Machine Learning packages( generally used)
R Machine Learning packages( generally used)R Machine Learning packages( generally used)
R Machine Learning packages( generally used)Dr. Volkan OBAN
 
treemap package in R and examples.
treemap package in R and examples.treemap package in R and examples.
treemap package in R and examples.Dr. Volkan OBAN
 

More from Dr. Volkan OBAN (20)

Conference Paper:IMAGE PROCESSING AND OBJECT DETECTION APPLICATION: INSURANCE...
Conference Paper:IMAGE PROCESSING AND OBJECT DETECTION APPLICATION: INSURANCE...Conference Paper:IMAGE PROCESSING AND OBJECT DETECTION APPLICATION: INSURANCE...
Conference Paper:IMAGE PROCESSING AND OBJECT DETECTION APPLICATION: INSURANCE...
 
Covid19py Python Package - Example
Covid19py  Python Package - ExampleCovid19py  Python Package - Example
Covid19py Python Package - Example
 
Object detection with Python
Object detection with Python Object detection with Python
Object detection with Python
 
Python - Rastgele Orman(Random Forest) Parametreleri
Python - Rastgele Orman(Random Forest) ParametreleriPython - Rastgele Orman(Random Forest) Parametreleri
Python - Rastgele Orman(Random Forest) Parametreleri
 
Linear Programming wi̇th R - Examples
Linear Programming wi̇th R - ExamplesLinear Programming wi̇th R - Examples
Linear Programming wi̇th R - Examples
 
"optrees" package in R and examples.(optrees:finds optimal trees in weighted ...
"optrees" package in R and examples.(optrees:finds optimal trees in weighted ..."optrees" package in R and examples.(optrees:finds optimal trees in weighted ...
"optrees" package in R and examples.(optrees:finds optimal trees in weighted ...
 
k-means Clustering in Python
k-means Clustering in Pythonk-means Clustering in Python
k-means Clustering in Python
 
Naive Bayes Example using R
Naive Bayes Example using  R Naive Bayes Example using  R
Naive Bayes Example using R
 
R forecasting Example
R forecasting ExampleR forecasting Example
R forecasting Example
 
k-means Clustering and Custergram with R
k-means Clustering and Custergram with Rk-means Clustering and Custergram with R
k-means Clustering and Custergram with R
 
Data Science and its Relationship to Big Data and Data-Driven Decision Making
Data Science and its Relationship to Big Data and Data-Driven Decision MakingData Science and its Relationship to Big Data and Data-Driven Decision Making
Data Science and its Relationship to Big Data and Data-Driven Decision Making
 
Data Visualization with R.ggplot2 and its extensions examples.
Data Visualization with R.ggplot2 and its extensions examples.Data Visualization with R.ggplot2 and its extensions examples.
Data Visualization with R.ggplot2 and its extensions examples.
 
Scikit-learn Cheatsheet-Python
Scikit-learn Cheatsheet-PythonScikit-learn Cheatsheet-Python
Scikit-learn Cheatsheet-Python
 
Python Pandas for Data Science cheatsheet
Python Pandas for Data Science cheatsheet Python Pandas for Data Science cheatsheet
Python Pandas for Data Science cheatsheet
 
Pandas,scipy,numpy cheatsheet
Pandas,scipy,numpy cheatsheetPandas,scipy,numpy cheatsheet
Pandas,scipy,numpy cheatsheet
 
ReporteRs package in R. forming powerpoint documents-an example
ReporteRs package in R. forming powerpoint documents-an exampleReporteRs package in R. forming powerpoint documents-an example
ReporteRs package in R. forming powerpoint documents-an example
 
ReporteRs package in R. forming powerpoint documents-an example
ReporteRs package in R. forming powerpoint documents-an exampleReporteRs package in R. forming powerpoint documents-an example
ReporteRs package in R. forming powerpoint documents-an example
 
R-ggplot2 package Examples
R-ggplot2 package ExamplesR-ggplot2 package Examples
R-ggplot2 package Examples
 
R Machine Learning packages( generally used)
R Machine Learning packages( generally used)R Machine Learning packages( generally used)
R Machine Learning packages( generally used)
 
treemap package in R and examples.
treemap package in R and examples.treemap package in R and examples.
treemap package in R and examples.
 

Recently uploaded

BigBuy dropshipping via API with DroFx.pptx
BigBuy dropshipping via API with DroFx.pptxBigBuy dropshipping via API with DroFx.pptx
BigBuy dropshipping via API with DroFx.pptxolyaivanovalion
 
Edukaciniai dropshipping via API with DroFx
Edukaciniai dropshipping via API with DroFxEdukaciniai dropshipping via API with DroFx
Edukaciniai dropshipping via API with DroFxolyaivanovalion
 
Al Barsha Escorts $#$ O565212860 $#$ Escort Service In Al Barsha
Al Barsha Escorts $#$ O565212860 $#$ Escort Service In Al BarshaAl Barsha Escorts $#$ O565212860 $#$ Escort Service In Al Barsha
Al Barsha Escorts $#$ O565212860 $#$ Escort Service In Al BarshaAroojKhan71
 
Week-01-2.ppt BBB human Computer interaction
Week-01-2.ppt BBB human Computer interactionWeek-01-2.ppt BBB human Computer interaction
Week-01-2.ppt BBB human Computer interactionfulawalesam
 
VidaXL dropshipping via API with DroFx.pptx
VidaXL dropshipping via API with DroFx.pptxVidaXL dropshipping via API with DroFx.pptx
VidaXL dropshipping via API with DroFx.pptxolyaivanovalion
 
Delhi Call Girls Punjabi Bagh 9711199171 ☎✔👌✔ Whatsapp Hard And Sexy Vip Call
Delhi Call Girls Punjabi Bagh 9711199171 ☎✔👌✔ Whatsapp Hard And Sexy Vip CallDelhi Call Girls Punjabi Bagh 9711199171 ☎✔👌✔ Whatsapp Hard And Sexy Vip Call
Delhi Call Girls Punjabi Bagh 9711199171 ☎✔👌✔ Whatsapp Hard And Sexy Vip Callshivangimorya083
 
Junnasandra Call Girls: 🍓 7737669865 🍓 High Profile Model Escorts | Bangalore...
Junnasandra Call Girls: 🍓 7737669865 🍓 High Profile Model Escorts | Bangalore...Junnasandra Call Girls: 🍓 7737669865 🍓 High Profile Model Escorts | Bangalore...
Junnasandra Call Girls: 🍓 7737669865 🍓 High Profile Model Escorts | Bangalore...amitlee9823
 
FESE Capital Markets Fact Sheet 2024 Q1.pdf
FESE Capital Markets Fact Sheet 2024 Q1.pdfFESE Capital Markets Fact Sheet 2024 Q1.pdf
FESE Capital Markets Fact Sheet 2024 Q1.pdfMarinCaroMartnezBerg
 
BPAC WITH UFSBI GENERAL PRESENTATION 18_05_2017-1.pptx
BPAC WITH UFSBI GENERAL PRESENTATION 18_05_2017-1.pptxBPAC WITH UFSBI GENERAL PRESENTATION 18_05_2017-1.pptx
BPAC WITH UFSBI GENERAL PRESENTATION 18_05_2017-1.pptxMohammedJunaid861692
 
Chintamani Call Girls: 🍓 7737669865 🍓 High Profile Model Escorts | Bangalore ...
Chintamani Call Girls: 🍓 7737669865 🍓 High Profile Model Escorts | Bangalore ...Chintamani Call Girls: 🍓 7737669865 🍓 High Profile Model Escorts | Bangalore ...
Chintamani Call Girls: 🍓 7737669865 🍓 High Profile Model Escorts | Bangalore ...amitlee9823
 
Generative AI on Enterprise Cloud with NiFi and Milvus
Generative AI on Enterprise Cloud with NiFi and MilvusGenerative AI on Enterprise Cloud with NiFi and Milvus
Generative AI on Enterprise Cloud with NiFi and MilvusTimothy Spann
 
Accredited-Transport-Cooperatives-Jan-2021-Web.pdf
Accredited-Transport-Cooperatives-Jan-2021-Web.pdfAccredited-Transport-Cooperatives-Jan-2021-Web.pdf
Accredited-Transport-Cooperatives-Jan-2021-Web.pdfadriantubila
 
Introduction-to-Machine-Learning (1).pptx
Introduction-to-Machine-Learning (1).pptxIntroduction-to-Machine-Learning (1).pptx
Introduction-to-Machine-Learning (1).pptxfirstjob4
 
Schema on read is obsolete. Welcome metaprogramming..pdf
Schema on read is obsolete. Welcome metaprogramming..pdfSchema on read is obsolete. Welcome metaprogramming..pdf
Schema on read is obsolete. Welcome metaprogramming..pdfLars Albertsson
 
Best VIP Call Girls Noida Sector 39 Call Me: 8448380779
Best VIP Call Girls Noida Sector 39 Call Me: 8448380779Best VIP Call Girls Noida Sector 39 Call Me: 8448380779
Best VIP Call Girls Noida Sector 39 Call Me: 8448380779Delhi Call girls
 
CebaBaby dropshipping via API with DroFX.pptx
CebaBaby dropshipping via API with DroFX.pptxCebaBaby dropshipping via API with DroFX.pptx
CebaBaby dropshipping via API with DroFX.pptxolyaivanovalion
 
Determinants of health, dimensions of health, positive health and spectrum of...
Determinants of health, dimensions of health, positive health and spectrum of...Determinants of health, dimensions of health, positive health and spectrum of...
Determinants of health, dimensions of health, positive health and spectrum of...shambhavirathore45
 
Zuja dropshipping via API with DroFx.pptx
Zuja dropshipping via API with DroFx.pptxZuja dropshipping via API with DroFx.pptx
Zuja dropshipping via API with DroFx.pptxolyaivanovalion
 
Carero dropshipping via API with DroFx.pptx
Carero dropshipping via API with DroFx.pptxCarero dropshipping via API with DroFx.pptx
Carero dropshipping via API with DroFx.pptxolyaivanovalion
 

Recently uploaded (20)

BigBuy dropshipping via API with DroFx.pptx
BigBuy dropshipping via API with DroFx.pptxBigBuy dropshipping via API with DroFx.pptx
BigBuy dropshipping via API with DroFx.pptx
 
Edukaciniai dropshipping via API with DroFx
Edukaciniai dropshipping via API with DroFxEdukaciniai dropshipping via API with DroFx
Edukaciniai dropshipping via API with DroFx
 
Al Barsha Escorts $#$ O565212860 $#$ Escort Service In Al Barsha
Al Barsha Escorts $#$ O565212860 $#$ Escort Service In Al BarshaAl Barsha Escorts $#$ O565212860 $#$ Escort Service In Al Barsha
Al Barsha Escorts $#$ O565212860 $#$ Escort Service In Al Barsha
 
Week-01-2.ppt BBB human Computer interaction
Week-01-2.ppt BBB human Computer interactionWeek-01-2.ppt BBB human Computer interaction
Week-01-2.ppt BBB human Computer interaction
 
VidaXL dropshipping via API with DroFx.pptx
VidaXL dropshipping via API with DroFx.pptxVidaXL dropshipping via API with DroFx.pptx
VidaXL dropshipping via API with DroFx.pptx
 
Delhi Call Girls Punjabi Bagh 9711199171 ☎✔👌✔ Whatsapp Hard And Sexy Vip Call
Delhi Call Girls Punjabi Bagh 9711199171 ☎✔👌✔ Whatsapp Hard And Sexy Vip CallDelhi Call Girls Punjabi Bagh 9711199171 ☎✔👌✔ Whatsapp Hard And Sexy Vip Call
Delhi Call Girls Punjabi Bagh 9711199171 ☎✔👌✔ Whatsapp Hard And Sexy Vip Call
 
Junnasandra Call Girls: 🍓 7737669865 🍓 High Profile Model Escorts | Bangalore...
Junnasandra Call Girls: 🍓 7737669865 🍓 High Profile Model Escorts | Bangalore...Junnasandra Call Girls: 🍓 7737669865 🍓 High Profile Model Escorts | Bangalore...
Junnasandra Call Girls: 🍓 7737669865 🍓 High Profile Model Escorts | Bangalore...
 
FESE Capital Markets Fact Sheet 2024 Q1.pdf
FESE Capital Markets Fact Sheet 2024 Q1.pdfFESE Capital Markets Fact Sheet 2024 Q1.pdf
FESE Capital Markets Fact Sheet 2024 Q1.pdf
 
(NEHA) Call Girls Katra Call Now 8617697112 Katra Escorts 24x7
(NEHA) Call Girls Katra Call Now 8617697112 Katra Escorts 24x7(NEHA) Call Girls Katra Call Now 8617697112 Katra Escorts 24x7
(NEHA) Call Girls Katra Call Now 8617697112 Katra Escorts 24x7
 
BPAC WITH UFSBI GENERAL PRESENTATION 18_05_2017-1.pptx
BPAC WITH UFSBI GENERAL PRESENTATION 18_05_2017-1.pptxBPAC WITH UFSBI GENERAL PRESENTATION 18_05_2017-1.pptx
BPAC WITH UFSBI GENERAL PRESENTATION 18_05_2017-1.pptx
 
Chintamani Call Girls: 🍓 7737669865 🍓 High Profile Model Escorts | Bangalore ...
Chintamani Call Girls: 🍓 7737669865 🍓 High Profile Model Escorts | Bangalore ...Chintamani Call Girls: 🍓 7737669865 🍓 High Profile Model Escorts | Bangalore ...
Chintamani Call Girls: 🍓 7737669865 🍓 High Profile Model Escorts | Bangalore ...
 
Generative AI on Enterprise Cloud with NiFi and Milvus
Generative AI on Enterprise Cloud with NiFi and MilvusGenerative AI on Enterprise Cloud with NiFi and Milvus
Generative AI on Enterprise Cloud with NiFi and Milvus
 
Accredited-Transport-Cooperatives-Jan-2021-Web.pdf
Accredited-Transport-Cooperatives-Jan-2021-Web.pdfAccredited-Transport-Cooperatives-Jan-2021-Web.pdf
Accredited-Transport-Cooperatives-Jan-2021-Web.pdf
 
Introduction-to-Machine-Learning (1).pptx
Introduction-to-Machine-Learning (1).pptxIntroduction-to-Machine-Learning (1).pptx
Introduction-to-Machine-Learning (1).pptx
 
Schema on read is obsolete. Welcome metaprogramming..pdf
Schema on read is obsolete. Welcome metaprogramming..pdfSchema on read is obsolete. Welcome metaprogramming..pdf
Schema on read is obsolete. Welcome metaprogramming..pdf
 
Best VIP Call Girls Noida Sector 39 Call Me: 8448380779
Best VIP Call Girls Noida Sector 39 Call Me: 8448380779Best VIP Call Girls Noida Sector 39 Call Me: 8448380779
Best VIP Call Girls Noida Sector 39 Call Me: 8448380779
 
CebaBaby dropshipping via API with DroFX.pptx
CebaBaby dropshipping via API with DroFX.pptxCebaBaby dropshipping via API with DroFX.pptx
CebaBaby dropshipping via API with DroFX.pptx
 
Determinants of health, dimensions of health, positive health and spectrum of...
Determinants of health, dimensions of health, positive health and spectrum of...Determinants of health, dimensions of health, positive health and spectrum of...
Determinants of health, dimensions of health, positive health and spectrum of...
 
Zuja dropshipping via API with DroFx.pptx
Zuja dropshipping via API with DroFx.pptxZuja dropshipping via API with DroFx.pptx
Zuja dropshipping via API with DroFx.pptx
 
Carero dropshipping via API with DroFx.pptx
Carero dropshipping via API with DroFx.pptxCarero dropshipping via API with DroFx.pptx
Carero dropshipping via API with DroFx.pptx
 

Boxplot and Beeswarm Plots in R

  • 2. CODES: 1-str(airquality) 'data.frame': 153 obs. of 6 variables: $ Ozone : int 41 36 12 18 NA 28 23 19 8 NA ... $ Solar.R: int 190 118 149 313 NA NA 299 99 19 194 ... $ Wind : num 7.4 8 12.6 11.5 14.3 14.9 8.6 13.8 20.1 8.6 ... $ Temp : int 67 72 74 62 56 66 65 59 61 69 ... $ Month : int 5 5 5 5 5 5 5 5 5 5 ... $ Day : int 1 2 3 4 5 6 7 8 9 10 ... > boxplot(airquality$Ozone) > boxplot(airquality$Ozone, + main="Mean ozone in parts per billion at Roosevelt Island", + xlab="Parts Per Billion", + ylab="Ozone", + col="orange", + border="brown", + horizontal=TRUE, + notch=TRUE + ) > ozone <- airquality$Ozone > temp <- airquality$Temp > ozone_norm <- rnorm(200,mean=mean(ozone, na.rm=TRUE), sd=sd(ozone, na.rm= TRUE)) > temp_norm <- rnorm(200,mean=mean(temp, na.rm=TRUE), sd=sd(temp, na.rm=TRU E)) > boxplot(ozone, ozone_norm, temp, temp_norm, + main="Multiple boxplots for comparision", + at=c(1,2,4,5), + names=c("ozone", "normal", "temp", "normal"), + las=2, + col=c("orange","red"), + border="brown", + horizontal=TRUE, + notch=TRUE)
  • 3.
  • 4.
  • 5.
  • 6. Example: 2-qplot(class, hwy, fill=factor(year), data=mpg, geom="boxplot", position ="dodge")+theme_bw()
  • 7. 3-data<-data.frame(Stat11=rnorm(100,mean=3,sd=2), + Stat21=rnorm(100,mean=4,sd=1), + Stat31=rnorm(100,mean=6,sd=0.5), + Stat41=rnorm(100,mean=10,sd=0.5), + Stat12=rnorm(100,mean=4,sd=2), + Stat22=rnorm(100,mean=4.5,sd=2), + Stat32=rnorm(100,mean=7,sd=0.5), + Stat42=rnorm(100,mean=8,sd=3), + Stat13=rnorm(100,mean=6,sd=0.5), + Stat23=rnorm(100,mean=5,sd=3), + Stat33=rnorm(100,mean=8,sd=0.2), + Stat43=rnorm(100,mean=4,sd=4)) > boxplot(data)
  • 8. 4-> library(ggplot2) > a <- runif(10) > b <- runif(12) > c <- runif(7) > d <- runif(15) > group <- factor(rep(1:4, c(10, 12, 7, 15))) > mydata <- data.frame(c(a,b,c,d), group) > names(mydata) <- c("value", "group") > min.mean.sd.max <- function(x) { + r <- c(min(x), mean(x) - sd(x), mean(x), mean(x) + sd(x), max(x)) + names(r) <- c("ymin", "lower", "middle", "upper", "ymax") + r + } > p1 <- ggplot(aes(y = value, x = factor(group)), data = mydata) > p1 <- p1 + stat_summary(fun.data = min.mean.sd.max, geom = "boxplot") + g eom_jitter(position=position_jitter(width=.2), size=3) + ggtitle("Boxplot c on media, 95%CI, valore min. e max.") + xlab("Gruppi") + ylab("Valori") > p1
  • 9. 5-install.packages("GGally") ds = read.csv("http://www.math.smith.edu/r/data/help.csv") > ds$sex = as.factor(ifelse(ds$female==1, "female", "male")) > ds$housing = as.factor(ifelse(ds$homeless==1, "homeless", "housed")) > smallds = subset(ds, select=c("housing", "sex", "i1", "cesd")) library(GGally) > ggpairs(smallds, diag=list(continuous="density", discrete="bar"), axisLab els="show") #1.graph >ggpairs(ds, columns=c("housing", "sex", "i1", "cesd"), + diag=list(continuous="density", discrete="bar"), axisLabels="sh ow") [#2.graph] 1.graph
  • 11. 6- uData <- rnorm(20) > vData <- rnorm(20,mean=5) > wData <- uData + 2*vData + rnorm(20,sd=0.5) > xData <- -2*uData+rnorm(20,sd=0.1) > yData <- 3*vData+rnorm(20,sd=2.5) > d <- data.frame(u=uData,v=vData,w=wData,x=xData,y=yData) > pairs(d)
  • 12. 7- library(ggplot2) > > # Plot Skeleton > p <- ggplot(diamonds, aes(x=factor(color), y=carat)) > > # Boxplot of diamond carat as a function of diamond color > p + geom_boxplot()
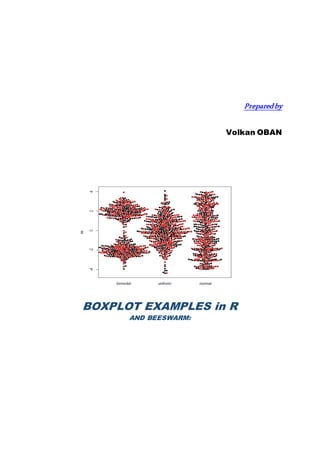
  • 13. LAST EXAMPLE: install.packages("beeswarm") #data set.seed(1234) bimodal <- c(rnorm(250, -2, 0.6), rnorm(250, 2, 0.6)) uniform <- runif(500, -4, 4) normal <- rnorm(500, 0, 1.5) dataf <- data.frame (group = rep(c("bimodal","uniform", "normal"), each = 500), xv = c(bimodal, uniform, normal), cg = rep( c("A","B"), 750)) require(beeswarm) beeswarm(xv ~ group, data = dataf,method = 'swarm', pch = 16, pwcol = as.numeric(cg), xlab = '', ylab = 'xv', labels = c('bimodal', 'uniform', 'normal'))