SlideShare a Scribd company logo
1 of 68
Download to read offline
LAB
MANUAL
Prepared By
Mr. Vipul Hingu
METROLOGY & INSTRUMENTATION
SUBJECT CODE :- 3341905
LAB PRACTICAL LIST S.B. POLYTECHNIC, SAVLI M & I (3341905)
Prepared By Mr. Vipul Hingu Page 1 of 1
PRACTICAL LIST
Practical No. Aim of Practical
1 Preperatory Activity
2 Linear Measurement - Vernier Caliper
3
Linear Measurement - Outside & Inside
Micrometer
4 Linear Measurement – Telescopic Gauge
5 Angular Measurement - Bevel protector
6 Angular Measurement - Sine Bar
7 To Study Straightness Testing
8 To Study Flatness Testing
9
To Study Squareness, Perpendicularity And
Parallity
10
To Study Roundness, Cylindricity,
Concentricity, Run Out and Ovality
11
To Study about Measurement of Surface
Roughness
12 To Study about Gear Measurement
13 To Study about Thread Measurement
14 To Study about Limit Gauges
15 To Study about Non-Destructive Testing-NDT
16 To Study about Temperature Measurement
17 To Study about Pressure Measurement
18 To Study about Flow Measurement
EXPERIMENT NO. 1 S.B. POLYTECHNIC, SAVLI M & I (3341905)
Prepared By Mr. Vipul Hingu Page 1 of 4
EXPERIMENT NO. 1
AIM: → Preperatory Activity.
In This Experiment We Study about S.I. basic, Supplementary and Derived units and their
conversions.
Objective :
 To Study about SI Units and their conversions.
Introduction
Throughout the centuries, many measurement systems have been developed. Evolving from
numerous origins, they have been modified by custom and local adaptations. Most therefore lack
rational structure. The Imperial system, which uses measurements such as the yard, quart, and
pound, is an example of poorly correlated units.
About 200 years ago, France invented the metric system to bring order to its measures.
Although strongly opposed at first, this new system proved effective and gained popularity, so
much so that 98 per cent of the world's population now lives in countries that have adopted or are
changing to the metric system. These countries include the USA, where conversion to SI is further
advanced than is superficially apparent
Finally, in 1960, the International System of Units was established as a result of a long series
of international discussions. This modernized metric system, called SI from the French name le
Systeme International d'unites replaced all former systems of measurement, including former
versions of the metric system. Canada, too, decided to adopt SI.
SI includes familiar metric units such as the metre and kilogram. There are, however, a
number of changes from former metric systems. For instance, the centigrade temperature scale is
called the Celsius scale. This is a change in name only, so that 20°C, formerly read as "twenty
degrees centigrade" is now read as "twenty degrees Celsius". No change occurs in the scale, only in
the name. Water still freezes at 0°C and boils at 100°C. This kind of change is not difficult for those
who are familiar with older metric systems. Other changes which are of a more specialized nature
will be examined later.
Before universal approval of SI, the Imperial and various metric systems were the prevalent
expressions of measurement in the world. The use of SI has eliminated confusion by:
1) Providing a coherent system of units.
2) Ensuring that quantities and units are uniform in concept and style.
3) Minimizing the number of multiples and submultiples in use.
Names and symbols for basic SI units
SI has three types of units:
(A) SI Base units.
(B) SI Derived units.
(C) SI Supplementary units.
EXPERIMENT NO. 1 S.B. POLYTECHNIC, SAVLI M & I (3341905)
Prepared By Mr. Vipul Hingu Page 2 of 4
(A) SI Base Units
SI is founded on seven units called "base units". All derived units are a
variation of these seven units. ANY PHYSICAL QUANTITY CAN BE EXPRESSED IN SI BY
APPROPRIATE COMBINATIONS OF THE BASE UNITS; as given in Table No. 1.1
(Table No. 1.1)
Base quantity
SI Base Units
Name Symbol
Length Meter m
Mass Kilogram kg
Time Second s
Electric current Ampere A
Thermodynamic Temperature Kelvin K
Amount of substance Mole mol
Luminous itensuty candela cd
(B) SI Derived units
Other quantities, called derived quantities, are defined in terms of the seven
base quantities via a system of quantity equations. The SI derived units for these
derived quantities are obtained from these equations and the seven SI base units.
Examples of such SI derived units are given in Table No. 1.2, where it should be
noted that the symbol 1 for quantities of dimension 1 such as mass fraction is
generally omitted.
(Table No. 1.2)
Derived quantity
SI Derived Units
Name Symbol
Area square meter m2
Volume cubic meter m3
Speed, Velocity meter per second m s-1
Acceleration meter per second squared m s-2
Wave number Reciprocal meter m-1
Mass density kilogram per cubic meter kg m-3
Specific volume cubic meter per kilogram m3
kg-1
Current density ampere per square meter A m-2
Magnetic field strength ampere per meter A m-1
Amount of substance
concentration
mole per cubic meter mol m-3
Luminance candela per square meter cd m-2
Mass fraction
kilogram per kilogram.
which may be
represented by the
number 1
kg kg-1
= 1
EXPERIMENT NO. 1 S.B. POLYTECHNIC, SAVLI M & I (3341905)
Prepared By Mr. Vipul Hingu Page 3 of 4
(C) Supplementary Units
For ease of understanding and convenience, 21 SI derived units have been
given special names and symbols, as shown in Table No 1.3
(Table No. 1.3)
Derived quantity
SI Derived Units
Name Symbol
Expression in
terms of
other SI
units
Expression in terms
of SI Base units
Plane angle radiana
rad - m m-1
=1b
Solid angle steradiana
src
- m2
m-2
=1b
Frequency hertz Hz - s-1
Force newton N - m kg s-2
Pressure, Stress pascal Pa N m2
m-1
kg s-2
Energy, Work, quantity of
heat
joule
J N-m
m2
kg s-2
Power, Radiant flux watt W J s-1
m2
kg s-3
Electric charge, Quantity of
electricity
coulomb
C -
s A
Electric potential
difference, Electromotive
force
volt
V W A-1
m2
kg s-3
A-1
Electric capacitance farad F C V-1
m-2
kg-1
s4
A2
Electric resistance ohm Ω V A-1
m2
kg s-3
A-2
Electric conductance siemens S A V-1
m-2
kg-1
s-3
A2
Magnetic flux weber Wb V s m2
kg s-2
A-1
Magnetic flux density tesla T Wb m-2
kg s-2
A-1
Inductance henry H Wb/A m2
kg s-2
A-2
Celsius temperature degree celsius C - K
Luminous flux lumen Lm Cd src
m2
m-2
cd = cd sr
Illumination lux lx Lm m-2
m2
m-4
cd = m-2
sr cd
Acticity (of a radionuclide) becquerels Bq - s-1
Absorbed dose, specific
energy (imparted), kerma
gray
Gy J kg-1
m2
s-2
Dose equivalent sievert Sv J-1
kg m2
s-2
Hear,
b
= In practice, the symbols rad and sr are used where appropriate, but the derived unit "1" is
generally omitted
c
= In photometry, the unit name steradian and the unit symbol sr are usually retained in
expressions for derived units.
EXPERIMENT NO. 1 S.B. POLYTECHNIC, SAVLI M & I (3341905)
Prepared By Mr. Vipul Hingu Page 4 of 4
Conversions
1) Length
Length Length
1 meter = _________ mm 1 inch = _________ mm
1 meter = _________ cm 1 inch = _________ cm
1 meter = _________ inch 1 inch = _________ meter
Length Length
1 yard = _________ foot 1 mm = _________ meter
1 foot = _________ inch 1 mm = _________ cm
1 mm = _________ micro 1 mm = _________ inch
1 mile = _________ km
1 km = _________ meter
2) Area
Area Area
1 mm2
= _________ inch2
1 inch2
= _________ mm2
1 mm2
= _________ cm2
1 inch2
= _________ cm2
1 mm2
= _________ meter2
1 inch2
= _________ meter2
Area
1 meter2
= _________ mm2
1 meter2
= _________ cm2
1 meter2
= _________ inch2
Define
1) Axis: An imaginary line about which a body rotates.
2) Center: The point that is equally distant from every point on the circumference of a circle or
sphere.
3) Angle: The space (usually measured in degrees) between two intersecting lines or surfaces
at or close to the point where they meet.
4) Plane: A flat surface on which a straight line joining any two points on it would wholly lie.
5) Solid angle: A three-dimensional analogue of an angle, such as that subtended by a cone or
formed by planes meeting at a point. It is measured in steradians.
EXPERIMENT NO. 2 S.B. POLYTECHNIC, SAVLI M & I (3341905)
Prepared By Mr. Vipul Hingu Page 1 of 3
EXPERIMENT NO. 2
AIM: → Linear Measurement - Vernier Caliper
To determine the Length, Width & Thickness of the given specimen by using Vernier Caliper.
Objective
 To understand the constructional parts of Vernier Caliper.
 How to calculate least count of Vernier Caliper?
 How to take measurement with the help of Vernier Caliper?
Apparatus Required
 Vernier Caliper,
 Work piece.
Procedure
1) Clean the main scale, Vernier scale and measuring jaws of the Vernier Caliper.
2) The Vernier Caliper is checked for zero error.
3) Place the measuring jaw such that it touches the surface to be measured from the Smooth
surface.
4) Measure the main scale reading and Vernier scale coincidence of the Vernier Caliper.
Least count
The smallest value that can be measured by the instrument is known as its least count.
There are two methods to find the least count of Vernier Caliper.
1. First Method
 Length of 49 divisions on main scale = Length of 50 divisions on Vernier
scale.
 It means it follows that for the same length if there is n division on main
scale then there should be n+1 division on Vernier Scale for the same
distance.
 Value of smallest division on main scale = 1 mm and
 Value of smallest division on Vernier scale = 49/50 = 0.98 mm
Therefore,
Least count = Value of smallest division – Value on smallest division
on main scale on Vernier scale
=1 – 0.98
= 0.02 mm
2. Second Method
Smallest division on Main scale = 1 mm
Total no. of divisions on Vernier Scale = 50 markings
EXPERIMENT NO. 2 S.B. POLYTECHNIC, SAVLI M & I (3341905)
Prepared By Mr. Vipul Hingu Page 1A
(Fig, 2.1) Basic Vernier Caliper
EXPERIMENT NO. 2 S.B. POLYTECHNIC, SAVLI M & I (3341905)
Prepared By Mr. Vipul Hingu Page 2 of 3
Therefore,
Least Count =
=
= 0.02 mm
Reading a Vernier Caliper
Formulae for calculating total reading with the help of Vernier caliper is
Total
Reading = (Main Scale
Reading) +
(Least
Count
of V.C.
X
Vernier division exactly
coincides with main
scale division)
= 12 + 0.02 X 0.42
= 12.84 mm
Formula & Calculation
Total
Reading =
(Main Scale
Reading) +
(Least
Count of
V.C.
X
Vernier division exactly
coincides with main
scale division)
= ____ + (____ X ____)
= _____ mm
Drawing of the Job
EXPERIMENT NO. 2 S.B. POLYTECHNIC, SAVLI M & I (3341905)
Prepared By Mr. Vipul Hingu Page 2A
(How to measure different measurement by using Vernier Caliper)
EXPERIMENT NO. 2 S.B. POLYTECHNIC, SAVLI M & I (3341905)
Prepared By Mr. Vipul Hingu Page 3 of 3
Readings Table
No
Main scale
reading
(A)
No of Vernier scale
division in coincidence
Vernier scale division X
Least count
(B)
Total Reading
(A + B)
Length
Width
Thickness
Applications
Vernier Caliper is extensively used in the engineering for measuring external and internal
diameters, lengths, thickness, depth and other dimensions.
Conclusion
Now we've got to use this Vernier Caliper.
EXPERIMENT NO. 3 S.B. POLYTECHNIC, SAVLI M & I (3341905)
Prepared By Mr. Vipul Hingu Page 1 of 3
EXPERIMENT NO. 3
AIM: → Linear Measurement - Outside & Inside Micrometer
To determine the Length & Inside & Outside Diameter of the given specimen by using Outside &
Inside Micrometer.
Objective
 To understand the constructional parts of Outside & Inside Micrometer.
 How to calculate least count of Outside & Inside Micrometer?
 How to take measurement with the help of Outside & Inside Micrometer?
Apparatus Required
 Outside Micrometer,
 Inside Micrometer,
 Work piece.
Procedure
1) Clean the main scale, Circular scale and measuring jaws of the Outside & Inside Micrometer.
2) The Outside & Inside Micrometer is checked for zero error.
3) Place the Object between measuring anvil and Spindle such that it touches the surface to be
measured from the Smooth surface.
4) Measure the main scale reading and Circular scale coincidence of the Outside & Inside
Micrometer.
Least count
The smallest value that can be measured by the instrument is known as its least count.
Micrometer works on the principle of screw and nut. We know that when a screw is
turned through nut byone revolution, it advances by one pitch distance i.e. one rotation of
screw corresponds to a linear movement of adistance equal to pitch of the thread. If the
circumference of the screw is divided into number of equal parts say “n”,its rotation
through one division will cause the screw to advance through (Pitch/n) length.
Least count =
Thus by reducing the pitch of the screw thread or by increasing the number of
divisions on the circumference of screw, the length value of one circumferential division
(L.C.) can be reduced and accuracy of measurement can be increased considerably
 Micrometer has a screw of 0.50 mm pitch
 With a thimble graduated in 50 divisions
Therefore,
Least count =
EXPERIMENT NO. 3 S.B. POLYTECHNIC, SAVLI M & I (3341905)
Prepared By Mr. Vipul Hingu Page 1A
(Fig, 3.1) Outside Micrometer
EXPERIMENT NO. 3 S.B. POLYTECHNIC, SAVLI M & I (3341905)
Prepared By Mr. Vipul Hingu Page 2 of 3
=
= 0.01 mm
Reading Outside & Inside Micrometer
Formulae for calculating total reading with the help of Outside & Inside Micrometer is
Calculation
Total
Reading =
(Linear Scale
Reading) +
(Least Count of
Outside/Inside
Micrometer)
X
(Circular scale
division exactly
coinciding with any
main scale division)
= 23.00 + ( 0.01 X 15 )
= 23.00 + ( 0.15 )
= 23.00 mm
Formula & Calculation
Total
Reading =
(Linear Scale
Reading) +
(Least Count of
Outside/Inside
Micrometer)
X
(Circular scale
division exactly
coinciding with any
main scale division)
= ____ + ( ____ X ____ )
= ____ + ( ____ )
= ____mm
EXPERIMENT NO. 3 S.B. POLYTECHNIC, SAVLI M & I (3341905)
Prepared By Mr. Vipul Hingu Page 2A
(Fig, 3.2) Inside Micrometer)
EXPERIMENT NO. 3 S.B. POLYTECHNIC, SAVLI M & I (3341905)
Prepared By Mr. Vipul Hingu Page 3 of 3
Drawing of the Job
Readings Table
No
Linear scale
reading
(A)
No of Circular scale
division in coincidence
Circular scale division X
Least count
(B)
Total Reading
(A + B)
Length
Outer
Dia.
Inner
Dia.
Applications
Outside/Inside Micrometer is extensively used in the engineering for measuring external and
internal diameters, lengths, thickness, depth and other dimensions.
Conclusion
Now we've got to use this Outside/Inside Micrometer.
EXPERIMENT NO. 4 S.B. POLYTECHNIC, SAVLI M & I (3341905)
Prepared By Mr. Vipul Hingu Page 1 of 1
EXPERIMENT NO. 4
AIM: → Linear Measurement – Telescopic Gauge
To Study and Use of Telescopic Gauge
Objective
 To understand the constructional parts of Telescopic Gauge.
 How to take measurement with the help of Telescopic Gauge?
Apparatus Required
 Telescopic Gauge,
 Vernier Caliper OR Outside Micrometer,
 Work piece.
Telescopic Gauges
The telescopic gauge is used for measuring internal diameter of holes, slots and grooves etc.
It consists of a handle with two rods in a tube at one end and a working screw at the other end. The
rods having spherical contacts can slide within a tube and are forced apart by an internal spring.
The locking screw can lock the rods at any desired position through a spring. While taking
measurements, the rods are pressed closer and inserted into the hole to be measured. The rods
then open out to touch the metal surface, of the hole on both sides. They are then locked in
position by means of a locking screw. The telescopic gauge is then taken out from the hole. The
dimension across the tips is measured by micrometer or Vernier Caliper.
(Fig, 4.1) Telescopic Gauge
Applications
Telescopic Gauge is extensively used in the engineering for measuring internal diameters,
Width of slot.
Conclusion
Now we've got to use this Telescopic Gauge.
EXPERIMENT NO. 5 S.B. POLYTECHNIC, SAVLI M & I (3341905)
Prepared By Mr. Vipul Hingu Page 1 of 4
EXPERIMENT NO. 5
AIM: → Angular Measurement - Bevel protector
To measure the angle in the given work piece using Bevel Protractor.
Objective
 To understand the constructional parts of Bevel Protractor.
 How to calculate least count of Bevel Protractor?
 How to take measure Angle with the help of Bevel Protractor?
Apparatus Required
 Bevel Protractor,
 Work piece.
Procedure
1) Clean the Bevel protractor with the fine cotton cloth.
2) The work piece whose angle to be measured is placed between the stock and the blade.
3) Note down the main scale reading and Vernier scale coincidence.
4) Tabulate the readings.
Least count
The smallest value that can be measured by the instrument is known as its least count.
There are two methods to find the least count of Vernier Caliper.
1. First Method
 Minimum angle on Main Scale = 1O.
 No. of Division on Vernier Scale = 12
Therefore,
Least Count =
Minimum angle on Main Scale
No.of Division on Vernier Scale
=
10
12
=
60′
12
= 5’ (Minutes)
2. Second Method
On Vernier Scale 12 Division = On Main Scale 23 Division
Therefore, On Vernier Scale 12 Division = 230
(Because, On Main Scale 1 Division = 10)
EXPERIMENT NO. 5 S.B. POLYTECHNIC, SAVLI M & I (3341905)
Prepared By Mr. Vipul Hingu Page 1A
(Fig, 5.1) Mechanical Bevel Protector
(Fig, 5.2) Optical Bevel Protector
EXPERIMENT NO. 5 S.B. POLYTECHNIC, SAVLI M & I (3341905)
Prepared By Mr. Vipul Hingu Page 2 of 4
Therefore, On Vernier Scale 1 Division =
230
12
Therefore, On Vernier Scale 1 Division = 1
110
12
Therefore, On Vernier Scale 1 Division =
230
12
Therefore, Minimum Difference between this two Scales
= 20 - 1
110
12
(Because, On Vernier Scale Minimum Value of
Angle is greaterthan 10)
=
10
12
=
60′
12
= 5’ (Minutes)
Reading a Bevel Protractor
Formulae for calculating Angle with the help of Bevel Protractor is
Total
Reading = (Main Scale
Reading) +
(Least
Count
of B.P.
X
Vernier division exactly
coincides with main
scale division)
= 650
+ 5’ X 3
= 650
15’
Formula & Calculation
Total
Reading =
(Main Scale
Reading) +
(Least
Count of
B.P.
X
Vernier division exactly
coincides with main
scale division)
= ____ + (____ X ____)
= ______
EXPERIMENT NO. 5 S.B. POLYTECHNIC, SAVLI M & I (3341905)
Prepared By Mr. Vipul Hingu Page 2A
(Fig, 5.3) Measurement of angles using bevel protractor
(a) Acute angle Attachment
(b) Inside bevelled face angle measurement
(Fig, 5.4) Angles and their supplements
(a) Blade oriented with base
(b) Blade turned clockwise
(c) Blade turned counter clockwise
EXPERIMENT NO. 5 S.B. POLYTECHNIC, SAVLI M & I (3341905)
Prepared By Mr. Vipul Hingu Page 3 of 4
Drawing of the Job
EXPERIMENT NO. 5 S.B. POLYTECHNIC, SAVLI M & I (3341905)
Prepared By Mr. Vipul Hingu Page 4 of 4
Readings Table
Work Piece 1
Sr. No
Main scale
reading
(A)
No of Vernier scale
division in coincidence
Vernier scale division X
Least count
(B)
Total Reading
(A + B)
1
2
3
AVERAGE
Work Piece 2
Sr. No
Main scale
reading
(A)
No of Vernier scale
division in coincidence
Vernier scale division X
Least count
(B)
Total Reading
(A + B)
1
2
3
AVERAGE
Applications
Bevel Protector is extensively used in the engineering for measuring external and internal
Angles from 00 to 3600 with an accuracy of 5’ (Minutes).
Conclusion
All the way we have discussed the Construction of Bevel Protractor, and its working
principle, and taking an angular measurement with the Bevel protractor.
EXPERIMENT NO. 6 S.B. POLYTECHNIC, SAVLI M & I (3341905)
Prepared By Mr. Vipul Hingu Page 1 of 2
EXPERIMENT NO. 6
AIM: → Angular Measurement - Sine Bar
To measure the taper angle of the given specimen using Sine Bar Method.
Objective
 To understand the constructional parts of Sine Bar.
 How to calculate least count of Sine Bar?
 How to take measure Angle with the help of Sine Bar?
Apparatus Required
 Sine Bar,
 Surface Plate,
 Work piece.
Procedure
1) The given component is placed on the surface plate.
2) One roller of sine bar is placed on surface plate and bottom surface of sine bar is seated on
the taper surface of the component.
3) The combination of slip gauges is inserted between the second roller of sine bar and the
surface plate.
4) The angle of the component is then calculated by the formula given above.
Formulae for Calculating Angle with the help of Sine Bar is
Formula & Calculation
sin 𝜃 =
H
L
Where, H - Height of the slip gauge
L - Distance between the centres
θ - Inclined angle of the specimen
EXPERIMENT NO. 6 S.B. POLYTECHNIC, SAVLI M & I (3341905)
Prepared By Mr. Vipul Hingu Page 1A
(Fig, 6.1) Working of Sine Bar
(Fig, 6.2) Working of Sine Bar
EXPERIMENT NO. 6 S.B. POLYTECHNIC, SAVLI M & I (3341905)
Prepared By Mr. Vipul Hingu Page 2 of 2
Drawing of the Job
Readings Table
Work
Piece
Sr. No
Length of the sine
bar (L)
“mm”
Height of the combination
of slip gauge
(H) “mm”
Taper Angle (θ) in
‘degree’
1
2
Applications
 Measuring known angles or locating any work to a given angle.
 Checking of Unknown angles.
 Checking of unknown angles of heavy components.
 Inspection of a conical objects (Having male and female centers) between centers.)
Result
Thus the angle in the work pieces were Determined using Sine bar
 Angle measured in work piece ,1 = ______ ‘degree’
 Angle measured in work piece ,2 = ______ ‘degree’
EXPERIMENT NO. 7 S.B. POLYTECHNIC, SAVLI M & I (3341905)
Prepared By Mr. Vipul Hingu Page 1 of 2
EXPERIMENT NO. 7
AIM: → To Study Straightness Testing
To Study method is use for measuring and checking straightness.
To Study Measurement of Straightness using Autocollimators Method.
Definition
Straightness: Linear uniformity of work surface measured from an external reference line is
called straightness
Objective
 To Study Measurement of Straightness using Autocollimators Method.
 To Study Limitation of Autocollimators Method using Measurement of Straightness.
Different types of Methods use for Straightness Testing
 Wedge Method
 Straight-edge Method,
 Light-gape and filler Gauge Method,
 Autocollimators Method,
 Precision Level Method.
Procedure
In this method autocollimator and slip gauge with reflected stand is used.
The method is explained in following steps.
1) A straight line is drawn on work surface and divide into equal parts. Length of each part is
equal to “l”, which is the distance the feet of reflector stand.
2) As Shown in Fig. No. – 7.1, reflector stands is kept on the equally divided parts, one by one
and reading of angular deviation is taken with autocollimator.
3) These reading are converted into mm. with conversion factor and rise and fall of points on
work surface are found out with reference to datum line.
4) The reading as achieved above are represented in the form of graph as shown in Fig. No. –
7.2
5) Now to bring the end point ‘H’ of the work surface profile at zero position like point A or H’
calculation as per Table No. 7.1 need to be done. After this calculation, new graph is drawn
as in Fig. No. 7.3 and straightness error is found out.
EXPERIMENT NO. 7 S.B. POLYTECHNIC, SAVLI M & I (3341905)
Prepared By Mr. Vipul Hingu Page 1A
(Fig, 7.1)
(Fig, 7.2) Work Surface Profile
(Fig, 7.3) Graph of Work Surface
EXPERIMENT NO. 7 S.B. POLYTECHNIC, SAVLI M & I (3341905)
Prepared By Mr. Vipul Hingu Page 2 of 2
Calculation
Position
Mean reading
of spirit level
or
autocollimator
(sec)
Difference
from 1st
reading
(sec)
Rise of fall
for interval
length (l)
(mm)
Cumulative
rise of fall
(mm)
Adjustment
to bring both
ends to zero
(mm)
Error from
straight-line
(mm)
1 2 3 4 5 6 7
a - - - 0 0 0
a-b θ1 0 0 0 -L/n -L/n
b-c θ2 θ2 − θ1 (θ2 − θ1) l (θ2 − θ1) l -2L/n (θ2 − θ1) l - 2L/ns
c-d θ3 θ3 − θ1 (θ2 − θ1) l
(θ2 − θ1) l
+ (θ3 − θ1) l
-3L/n
(θ2 − θ1) l
+ (θ3 − θ1) l -3L/n
- - - - - - -
- - - - - - -
- - - - - - -
h-i θn θn − θ1 θn − θ1
∑ (θn − θ1) l
= L
-L 0
With this method straightness of horizontal, vertical or inclined surface can be checked with
accuracy of 0.5”.
Limitations of this method
 Electricity is required.
 The method is tedious and cumbersome.
 Errors in autocollimator affect accuracy of testing.
Conclusion
With this method straightness of horizontal, vertical or inclined surface can be checked
EXPERIMENT NO. 8 S.B. POLYTECHNIC, SAVLI M & I (3341905)
Prepared By Mr. Vipul Hingu Page 1 of 2
EXPERIMENT NO. 8
AIM: → To Study Flatness Testing
To Study method is use for measuring and checking flatness.
To Study Measurement of Flatness using Optical Flat Method.
Definition
Flatness: Flatness is defined as the minimum distance between two parallel planes
which cover all the irregularities of the surface under examination.
Objective
 To Study Measurement of Flatness using Optical Flat Method.
 To Study Limitation of Optical Flat Method using Measuring and Checking flatness.
Different types of Methods use for Flatness Testing
 High Spot Method
 Liquid Wedge Method,
 Optical Flat Method,
 Precision Spirit Level Method,
 Autocollimator Method.
Procedure
The instruments used in this method are optical flat, slip gauges, standard flat, base plate
and monochromatic light source.
The method is explained in following steps.
1) As Shown Fig. No. 8.1 slip gauges are fixed on base plate after wringing and monochromatic
light rays thrown on the same
2) A mirror angle is created at wage shape gap between slip gauge and optical flat. Even
though both of them are thoroughly cleaned the gap is created due to dust particles
between them.
3) Now on observing optical flat different interference fringe patterns can be observed as
shown in Fig. No. 8.2. This pattern is a map of contour of the surface of slip gauges observed
through optical flat. Details of flatness can be known from fringe patterns.
4) Fig. No. 8.3 indicates different fringe patterns. Patterns (a) & (c) indicates flat surface, (b)
indicated spherical surface (Concave or Convex), (d) indicates saddle shape surface and (e)
indicates cylindrical surface.
EXPERIMENT NO. 8 S.B. POLYTECHNIC, SAVLI M & I (3341905)
Prepared By Mr. Vipul Hingu Page 1A
(Fig, 8.1) Checking Flatness using optical flat
(Fig, 8.2) Fringe patterns seen through optical flat
EXPERIMENT NO. 8 S.B. POLYTECHNIC, SAVLI M & I (3341905)
Prepared By Mr. Vipul Hingu Page 2 of 2
Applications
 Optical flats are used for testing the measuring surfaces of instruments like
micrometres, measuring anvils & similar other devices for their flatness &
parallelism.
 These are used to calibrate the standard gauges, like slip gauges, angle gauges &
secondary gauges in the workshops.
 In measuring the curvatures like convex and concave for surface of the standard
gauges.
Limitations of this method
 Need of Electric supply.
 Human error causes variations in the results.
 Flatness of only smaller surface can be checked.
 Exact value of flatness cannot be obtained.
Conclusion
With the help of this method flatness of slip gauges and other polished surfaces by lapping process
can be checked.
EXPERIMENT NO. 9 S.B. POLYTECHNIC, SAVLI M & I (3341905)
Prepared By Mr. Vipul Hingu Page 1 of 2
EXPERIMENT NO. 9
AIM: → To Study Squareness, Perpendicularity And Parallity
To Study methods are used for testing Squareness.
To Study Testing of Squareness using Dial Indicator Method.
Definition
Squareness: Two planes, two straight lines or a straight line and a plane are said to be
perpendicular when the error of parallelism in relation in relation to a standard square does not
exceed a given value.
Objective
 To Study Testing of Squareness using Dial Indicator Method.
 To Study Limitation of Dial Indicator Method using Squareness Testing.
Different types of Methods use for Squareness Testing
 Dial Indicator Method,
 Autocollimator Method
Procedure
The instruments used in this method are surface plate, dial indicator, standard square block/
work piece and Squareness tester.
The method is explained in following steps.
1) As Shown Fig. No. 9.1 standards square block is kept on the surface plate and the
Squareness tester is kept in such a manner that its knife edge touches the surface AB of the
block.
2) Now, the plunger of the dial indicator attached on the tester is allowed to touch the surface
AB and reading is taken.
3) Similarly other surface of the square block BC, CD and DA are brought in contact with knife
edge of the tester and reading in taken.
4) If the two surfaces AB and CD are parallel to each other, then in both the conditions same
reading will be indicated. But if both the reading are different then they will indicate either
higher or lower than 900 in both the conditions. Thus the difference between both the
reading will be double of the Squareness error of length “l”.
EXPERIMENT NO. 9 S.B. POLYTECHNIC, SAVLI M & I (3341905)
Prepared By Mr. Vipul Hingu Page 1A
(Fig. 9.1) Dial Indicator Method
EXPERIMENT NO. 9 S.B. POLYTECHNIC, SAVLI M & I (3341905)
Prepared By Mr. Vipul Hingu Page 2 of 2
Limitations of this method
 If vertical surface of the Squareness tester is not exactly perpendicular to the
surface plate then error comes in the reading.
 If axis of dial indicator and knife edge are not parallel then errors comes in the
reading.
Conclusion
With this method Squareness of standard square block or other work piece of same shape can be
checked with the accuracy 0.01 or 0.001 mm.
EXPERIMENT NO. 10 S.B. POLYTECHNIC, SAVLI M & I (3341905)
Prepared By Mr. Vipul Hingu Page 1 of 2
EXPERIMENT NO. 10
AIM: → To Study Roundness, Cylindricity, Concentricity, Run Out and Ovality
To Study methods are used for testing Roundness.
To Study Testing of Roundness using V-Block and Dial Indicator Method.
Definition
Roundness: Roundness is defined as the radial uniformity of the surface of the circular
part from its central line.
Objective
 To Study Testing of Roundness using V-Block and Dial Indicator Method.
 To Study Limitation of V-Block and Dial Indicator Method using Roundness Testing.
Circularity Error
As Shown in Fig. No. 9.1 the radial distance of the profit between minimum circumscribing
circle and maximum inscribing circle measured at perpendicular to the axis of the circle is called
circularity error.
(Fig. 10.1) Circularity or Roundness
Irregularities in a Circle Components OR Circular movements
a) Ovality: If two axis of a circular part which are perpendicular to each other (major
and minor axis) are not equal then this kind of error in called as Ovality as shown in
Fig. No. 9.2.
b) Lobbing: When distance between exactly opposite points on all the surface of
circular work piece is measure with micrometre and it appears same at different
points even though the work piece may not be circular, then this is called Lobbing
error as shown in Fig. No. 9.3.
c) Non Uniform Shape: When profit of the circular work piece surface is totally
irregular as shown in Fig. No. 9.4 then this kind of error is called of non-uniformity.
(D = D1 = D2 = D3)
EXPERIMENT NO. 10 S.B. POLYTECHNIC, SAVLI M & I (3341905
Prepared By Mr. Vipul Hingu Page 1A
(Fig. 10.2) Ovality (Fig. 10.3) Lobbing
(Fig. 10.4) Non-Uniformity
(Fig. 10.5) Checking Roundness by Dial Indicator
EXPERIMENT NO. 10 S.B. POLYTECHNIC, SAVLI M & I (3341905)
Prepared By Mr. Vipul Hingu Page 2 of 2
Different types of Methods use for Roundness Testing
 Micrometre Method,
 V-Block and Dial Indicator Method,
 Bench Centre and Dial Indicator Method
Procedure
The instruments used in this method are surface plate, dial indicator with stand and V-Block.
The method is explained in following steps.
1) Adjust V-Block and dial indicator withstand on surface plate as shown in Fig. No. 9.5.
2) Now mark 12 equal division on work piece and arranged the same on V-Block. Set Dial
indicator on any one part with zero reading.
3) Rotate work piece at 3600 and obtain reading of dial indicator at each part.
4) Draw the polar graph of each reading and find out the roundness.
Application
 This method is used to check roundness of different circular jobs such as shaft,
spindle, plunger etc. with the accuracy as per indicator such as 0.01, 0.001 mm.
Limitations of this method
 The method is tedious.
 When higher points touching the V-block and lower points are below the plunger
of dial indicator as well as when higher points are blow the plunger and lower
points are touching V-Block at that time indicator provides same reading and
therefore error cannot be detected.
Conclusion
With this method Roundness of circular jobs such as shaft, spindle, plunger etc. or other work piece
of same shape can be tested.
EXPERIMENT NO. 11 S.B. POLYTECHNIC, SAVLI M & I (3341905)
Prepared By Mr. Vipul Hingu Page 1 of 3
EXPERIMENT NO. 11
AIM: → To Study about Measurement of Surface Roughness.
To Study methods are used for Measurement of Surface Roughness.
To Study Measurement of Surface Roughness using Taylor Hobson Telysurf Method.
Surface Roughness
They are series of regularly repeated deviations in the form of a wave, with a ratio of pitch
to height. These deviations are produce, by the trace of an edged cutting tool and plastic flow of
the metal during machining. They are fine irregularities in the surface texture and are termed as
surface roughness. To describe the surface roughness, the height of the irregularities is measured in
microns whereas its width is measured in mm. If the surface is too rough, the initial, wear particles
are larger which acts as abrasives and wear continues at high rate. If the surface is too smooth the
initial wear will be very slow.
The factors affecting surface roughness are:
 Type of coolant used
 Cutting parameters such as feed, speed and depth of cut
 Type of machining
 Rigidity of the system, consisting of machine tool, fixture, cutting tool and work
 Vibrations
 Material of tool and work piece
Analysis of surface traces
A numerical assessment of surface finish can be carried out in a number of ways. These
numerical values are obtained with respect to a datum. In practice, the following three methods of
evaluating primary texture (roughness) of a surface are used:
a) Peak to valley height method
b) The average roughness
c) Form factor or bearing curve
Methods of Measuring Surface Finish
There are two methods used for measuring the finish of machined part:
1) Surface Inspection of Comparison Methods
2) Direct Instrument Measurements
In comparative methods, the surface texture is assessed by observation of the surface. But these
methods are not reliable as they can be misleading if comparison is not made with surfaces
produced by same techniques. The various methods available under comparison method are:
EXPERIMENT NO. 11 S.B. POLYTECHNIC, SAVLI M & I (3341905
Prepared By Mr. Vipul Hingu Page 1A
(Fig. 11.1)
(Fig. 11.2)
(Fig. 11.4) Representation of Surface Roughness
EXPERIMENT NO. 11 S.B. POLYTECHNIC, SAVLI M & I (3341905)
Prepared By Mr. Vipul Hingu Page 2 of 3
 Touch Inspection
 Visual Inspection
 Scratch Inspection
 Microscopic Inspection
 Surface Photographs
 Micro-Interferometer
 Wallace Surface
 Dynamometer
 Reflected Light Intensity
Conventional method for designing surface finish Ovality
a) L Stylus Probe Instruments
b) Profilometer
c) Tomlinson Surface Recorder
d) The Taylor- Hobson Telysurf
e) Replica Method
The Taylor- Hobson Telysurf Method:
Principle: The variation in the surface profile is sensed by the probe, which is attached
to the armature. The gap between the armature and E-shaped arm varies
according to the surface profile and due to this amplitude of the ac current
flowing in the coil is modulated.
Construction and working: Fig. No. 11.3 shows the various units of the Telysurf, which
operates on electrical principles. The measuring head is fitted with the probe
and the skid. The motion of the measuring head is given by a Gear Box, which
has a motor.
This unit can be moved up and down over the guide ways by a hand
wheel provided at the top and a lead screw. The diamond probe has a radius
of about 2 μm and the gearbox can give a max travel of 12 mm to it. The work
piece is mounted on a stand, which is mounted on a table.
The averaging meter and a pen recorder are provided for obtaining a
graphical record on a continuous graph paper. The arm carrying the stylus
forms an armature, which is pivoted on the centrepiece of E-shaped arm as
shown in Figure 6.7. On two legs of E-shaped arm there are coils carrying an
A.C. current.
EXPERIMENT NO. 11 S.B. POLYTECHNIC, SAVLI M & I (3341905
Prepared By Mr. Vipul Hingu Page 2A
(Fig. 11.3) Taylor- Hobson Telysurf Method
(Fig. 11.5) Basic Symbol
EXPERIMENT NO. 11 S.B. POLYTECHNIC, SAVLI M & I (3341905)
Prepared By Mr. Vipul Hingu Page 3 of 3
Advantages:
 Accurate reading can be obtained.
 Magnification to the tune of 500 to 1, 00,000 can be obtained in eight steps.
 Surface texture data can be obtained faster.
 CLA value of the roughness and permanents profile of the same can be obtained.
 Suitable for quality control during production.
Representation of Surface Roughness
As per IS: 696 surface texture specified by indicating the following / main characteristics in the
symbols:
1)
2) Machining allowance in mm.
3) Sampling length or instrument cut-off length in mm.
4) Machining/production method, and
5) (e) Direction of lay in the symbol form as = X, M, C, R
The surface is represented as shown in the Fig.6.8. If the machining method is milling, sampling
length is 3mm. Direction of lay is perpendicular to the surface, machining allowance is 1mm and the
representation will be as shown in Figure No. 11.4 and 11.5.
Conclusion
With this method Roughness of different jobs can be Measurement.
EXPERIMENT NO. 12 S.B. POLYTECHNIC, SAVLI M & I (3341905)
Prepared By Mr. Vipul Hingu Page 1 of 2
EXPERIMENT NO. 12
AIM: → To Study about Gear Measurement.
To Study methods are used for Gear Measurement.
To Study Measurement of Gear using Chordal Thickness Method.
Different Types of Gear
1) Spur Gear (Show Fig. No. 12.1)
2) Helical Gear (Show Fig. No. 12.2)
3) Bevel Gear (Show Fig. No. 12.3)
4) Worm and Worm Gear (Show Fig. No. 12.4)
5) Rack and Pinion (Show Fig. No. 12.5)
Terminology of Gear Tooth
We will understand different terminology of gear tooth with the help of Fig. No. 12.6
Methods of Measurement of Gear Tooth Thickness
As we know gear tooth thickness is an arc and hence its direct measurement is not possible.
It is generally measured on pitch circle and that is why also called as pitch line thickness. Following
two methods are in use for measuring gear tooth thickness.
1) Chordal Thickness
2) Constant Chord
Chordal Thickness
Tooth thickness is not same from its top to its base circle. Therefore its thickness is checked
on its pitch points. Tooth thickness at its pitch points is called Chordal Thickness. This is the distance
between both the flanks of a tooth on pitch point as shown in Fig. No. 12.7. For measuring gear
tooth vernier calliper is used.
Gear tooth vernier calliper is having two vernier scale perpendiculars to each other. Vertical
scale is set at “d” reading as calculated from following equation:
d =
𝑁𝑚
2
[1 +
2
𝑁
– cos (
𝑁𝑚
2
) ]
Where N = Number of teeth and m = module
With this setting gear tooth calliper is adjusted on gear tooth as shown in Fig. No. 12.7. This
will ensure auxiliary slide to touch on top of the teeth in such a manner that jaws of the horizontal
scale touch the tooth on pitch points. Thus horizontal scale will provide chordal thickness (W) of the
tooth. This actual measurement is compared with theoretical value of chordal thickness as obtained
from the following equation and by this way any error in the thickness can be know:
W = N m sin (
90
𝑁
)
EXPERIMENT NO. 12 S.B. POLYTECHNIC, SAVLI M & I (3341905
Prepared By Mr. Vipul Hingu Page 1A
(Fig. 12.1) – Spur Gear (Fig. 12.2) – Helical Gear
(Fig. 12.3) – Bevel Gear
(Fig. 12.4) Worm and Worm Wheel
EXPERIMENT NO. 12 S.B. POLYTECHNIC, SAVLI M & I (3341905)
Prepared By Mr. Vipul Hingu Page 2 of 2
Limitations of this Method
Since this method is dependent on number of teeth, even though module is same, separate
calculation is required for different gears having different number of teeth.
Conclusion
With this method gear tooth thickness of different gear can be Measure.
EXPERIMENT NO. 12 S.B. POLYTECHNIC, SAVLI M & I (3341905
Prepared By Mr. Vipul Hingu Page 2A
(Fig. 12.5) Rack and Pinion
(Fig. 12.6) Terminology of Gear Tooth
(Fig. 12.7) Gear Tooth Vernier Calliper
EXPERIMENT NO. 13 S.B. POLYTECHNIC, SAVLI M & I (3341905)
Prepared By Mr. Vipul Hingu Page 1 of 2
EXPERIMENT NO. 13
AIM: → To Study about Thread Measurement.
To Study methods are used for Thread Measurement.
To Study Measurement of Effective Diameter of External Thread.
Different Terminology Related with Screw
1) Terminology of External Thread (Show Fig. No. 13.1)
2) Terminology of Internal Thread (Show Fig. No. 13.2)
1) Screw Thread : It is a continuous helical groove of a specified cross section cut on the
external or internal surface of cylinder or cone.
2) Pitch : It is the distance measured from a point on a thread to a corresponding point
on adjacent thread, measured parallel to the thread axis.
3) Crest : It is the uppermost surface joining two sides of the thread.
4) Root : It is the bottom most part of a groove formed by joining two adjacent side of
the thread.
5) Flank : It is the straight surface joining crest and root of the thread. It is the contact
surface when external and internal thread are joined.
6) Lead : It is the axis distance travelled by screw in one complete revolution.
7) Depth of Cut : It is the distance between crest and root of the thread measured in
perpendicular direction to the thread axis.
8) Thread Angle : In is the angle between two flanks in the plane of the thread axis.
9) Flank Angle : It is the angle between flank and a line perpendicular to thread axis.
10) Lead Angle : It is the angle between helix of a straight thread and line perpendicular
to thread axis on pitch line.
11) Helix Angle : It is the angle between helix of a straight thread with thread axis on
pitch line.
12) Major Diameter : It is the diameter of an imaginary coaxial cylinder witch is touching
the crest of external thread or roots of internal thread. It is also called as external
diameter or crest diameter or outside diameter or full diameter in case of external
thread.
13) Minor Diameter : It is a diameter of an imaginary coaxial cylinder which is touching
roots of external thread or crest of internal thread. It is also called as core diameter
or root diameter.
EXPERIMENT NO. 13 S.B. POLYTECHNIC, SAVLI M & I (3341905
Prepared By Mr. Vipul Hingu Page 1A
(Fig. 13.1) – External Thread
(Fig. 13.2) – Internal Thread
EXPERIMENT NO. 13 S.B. POLYTECHNIC, SAVLI M & I (3341905)
Prepared By Mr. Vipul Hingu Page 2 of 2
Elements of Thread Measurements
1) Major Diameter
2) Minor Diameter
3) Effective Diameter
4) Pitch
5) Flank Angle
6) Crest and root profile
7) Concentricity of different diameter
Measurement of Effective Diameter
Following different methods are in use for measurement of effective diameter of external
thread.
(A) One Wire Method
As shown in Figure No. 13.3 one wire is kept in the thread and measurement is taken
with the help of micrometre. First of all measurement of standard gauge diameter is taken
which is equal to effective diameter of the thread. This is d1.
Thereafter wire is kept in the thread and measurement is taken, which is d2.
Effective Diameter = D ± (d1 - d2)
Where, D = Size of setting gauge
If d2 > d1 then +ve sign and If d2 < d1 then -ve sign.
(B) Two Wire Method
In this method as shown in Figure No. 13.4 two equal diameter standard setting
wires (best wire size wires) are kept in the threads so that they touches the flanks of the
threads. Micrometre reading ‘M’ on these wires are taken and effective diameter of the
screw thread can be found out from the following equation.
E = M – 3d + 0.866p
Where, E = Effective Diameter
M = Micrometre reading on wire
d = Best wire size
p =Pitch
(C) Three Wire Method
This method provides more accurate results compared to two wire methods
because while keeping three best size wires in place of two, micrometre reading is obtain in
the perpendicular direction to thread axis. As shown in Figure No. 13.5 three wires are
arranged in the thread and micrometre reading ‘M’ is taken. Now with the help of following
equation effective diameter can be obtained.
E = M – 3d + 0.866p
Where, E = Effective Diameter
M = Micrometre reading on wire
d = Best wire size
p =Pitch
EXPERIMENT NO. 13 S.B. POLYTECHNIC, SAVLI M & I (3341905
Prepared By Mr. Vipul Hingu Page 2A
(Fig. 13.3) One Wire Method
(Fig. 13.4) Two Wire Method
(Fig. 13.5) Three Wire Method
EXPERIMENT NO. 14 S.B. POLYTECHNIC, SAVLI M & I (3341905)
Prepared By Mr. Vipul Hingu Page 1 of 2
EXPERIMENT NO. 14
AIM: → To Study about Limit Gauges.
To Study uses of Different types of Limit Gauges.
.
Definitions of Gauge and Gauging
Gauge: Gauge is an inspection tool used to check product dimension with reference
to its maximum and minimum acceptable limits. It is generally used to
segregate acceptable and non-acceptable products in mass production,
without knowing exact value of dimensions.
Gauging: It is the process of checking whether the product is within its specified higher
and lower limits, without knowing its actual measurement.
Advantages of Limit Gauges
1) Faster checking regarding whether product within its specified limits or not can be
done.
2) Less dependence on operator skill and hence results are not getting affected by
operator judgment.
3) Gauges are economical than measuring instruments.
4) More than one dimension of product can be checked at a time as well as properties
such as roundness, taper etc. also can be checked at a time.
Limitations of Limit Gauges
1) Exact value of product dimension cannot be known.
2) Accuracy of gauge is getting affected due to wear and tear with passage of time.
3) It is useful only for smaller products because it is difficult to manufacture and
maintain large size gauges.
Precautions to be observed while using Limit Gauges
1) Go and not Go members of the gauge should be used properly during gauging.
2) Proper matching of gauge with product surface should be checked through feeling of
touch.
3) Accuracy of gauges should be checked periodically since is getting affected by wear
and tear.
4) To prevent atmospheric effect grease and plastic coating should be applied on the
gauges and kept in a tight box when not in use.
EXPERIMENT NO. 14 S.B. POLYTECHNIC, SAVLI M & I (3341905
Prepared By Mr. Vipul Hingu Page 1A
(Fig. 14.1(a) (Fig. 14.1(b)
Double Ended Plug Gauge Progressive Plug Gauge
(Fig. 14.1(c) – Single Ended Plug Gauge
(Fig. 14.1(d) – Flat Type Plug Gauge (Fig. 14.2(a) – Adjustable Gap Gauge
(Fig. 14.2(b) – Double Ended Snap Gauge (Fig. 14.2(c) – Progressive type Snap Gauge
EXPERIMENT NO. 14 S.B. POLYTECHNIC, SAVLI M & I (3341905
Prepared By Mr. Vipul Hingu Page 2A
(Fig. 14.3(a) – Radius Gauge
(Fig. 14.3(b) – Filer Gauge
(Fig. 14.3(c) – Template Gauge
(Fig. 14.3(d) – Taper Plug Gauge
EXPERIMENT NO. 14 S.B. POLYTECHNIC, SAVLI M & I (3341905)
Prepared By Mr. Vipul Hingu Page 2 of 2
Classification of Gauges
According to type / use
1) Standard Gauge
2) Limit Gauge
According to application
1) Work shop Gauge
2) Inspection Gauge
3) Master / Reference Gauge
According to from
1) Plug Gauge (Fig. No. 14.1(a), (b), (c), (d) )
2) Snap and Wring Gauge (Fig. No. 14.2(a), (b), (c) )
According to design / Construction
1) Fixed limit Gauge
2) Indicating Gauge
3) Combination Gauge
According to specific application
1) Screw pitch Gauge
2) Template / Form Gauge (Fig. No. 14.3(c) )
3) Radius Gauge (Fig. No. 14.3(a) )
4) Filer Gauge (Fig. No. 14.3(b) )
5) Taper Gauge (Fig. No. 14.3(d) )
Use of Various Gauges
Apart from that some specific applications will be briefly explained in this section.
1) Pin Gauge
As Shown in Fig. No. 14.4 Pin Gauge is used to check bore of large size hole.
2) Receiving Gauge
These gauges are used to speedily check certain specific shape of the product
such as shaft having square or rectangular cross section, splined shaft etc.
Fig. No. 14.5 shows receiving gauges.
3) Length Gauge
Length gauges are used to check length of the component as shown in Fig.
No. 14.6
4) Combined Gauge
This gauge is used to check large size holes. Here go and no-go members are
provided at one side of the same gauge body. Gauge is inserted in the hole to
check go dimension and then tilted to check no-go dimension. This is shown
in Fig. No. 14.7
5) Angle Gauge
To check angle of a product in mass production special kind of angle
gauges are prepared. One such angle gauge is shown in Fig. No. 14.8
6) Position Gauge
These gauges are used to check position of one surface of the work-piece
with reference to another surface as shown in Fig. No. 14.9 (a) & (b)
EXPERIMENT NO. 14 S.B. POLYTECHNIC, SAVLI M & I (3341905
Prepared By Mr. Vipul Hingu Page 3A
(Fig. 14.4) – Pin Gauge (Fig. 14.5) – Receiving Gauge
(Fig. 14.6) (Fig. 14.7) (Fig. 14.8)
Length Gauge Combined Gauge Angle Gauge
(Fig. 14.9(a) & (b) – Position Gauge
EXPERIMENT NO. 15 S.B. POLYTECHNIC, SAVLI M & I (3341905)
Prepared By Mr. Vipul Hingu Page 1 of 2
EXPERIMENT NO. 15
AIM: → To Study about Non-Destructive Testing-NDT.
To Study Ultrasonic Test.
Principle
Ultrasonic sound waves (frequency more than 20,000 cycles / second) are produced
by piezo-electric effect and transmitted to the component under testing and reflection of
the same are received and converted into electronic single which can be analysed.
Procedure
 As shown in Fig No. 15.1 ultrasonic sound waves are transmitted to the component
by transmitter probe.
 The waves are produced with the help of quartz crystal, which is a piezo-electric
material which converts electrical energy in to mechanical energy as well as
mechanical energy in to electrical energy.
 When electric pulse is passed in the probe containing quarts crystal, during first half
cycle the crystal contracts and during remaining half cycle it expands producing
mechanical vibration, that is, sound waves.
 In case if there is no defect in component the sound wave will travel through entire
cross section thickness of the component and then reflects back as an echo.
 This echo wave is received by another probe (receiver probe) and the crystal inside
the probe vibrates and converts mechanical energy in to electrical energy, which is
converted in to wave form and observed on CRT screen.
 If defects are there, then sound waves will reflect back from the same and a wave
form will appear between first echo and back echo as shown in Fig No. 15.1
 With Suitable calibration on CRT screen distance of the defect from the probing
surface (depth of the defect) can be known.
 Many times instead of two different probes single probe is used which can perform
the operation of transmission as well as receipt of sound waves
Advantages
1) Components having thickness to the tune of 10 meter can be tested.
2) Defects can be located more accurately than other NDT methods.
3) Speedy and reliable technique.
4) Instrument can work on rechargeable battery and hence can be carried to different
inspection locations.
5) The method in economical for mass production.
EXPERIMENT NO. 15 S.B. POLYTECHNIC, SAVLI M & I (3341905
Prepared By Mr. Vipul Hingu Page 1A
(Fig. 15.1) - Ultrasonic Testing
EXPERIMENT NO. 15 S.B. POLYTECHNIC, SAVLI M & I (3341905)
Prepared By Mr. Vipul Hingu Page 2 of 2
Limitations
1) Surface of the component should be smooth and machined before test.
2) Complex contour create difficulties in testing.
3) Training is required for testing inspector.
4) Skilled and experienced inspectors are necessary.
Application
 This test I widely used for engineering products.
 Generally it can detect up to 10 meters thickness of the component.
 It is mainly used for all types of steels.
 This test creates some difficulty in coarse grained structure such as cast iron.
EXPERIMENT NO. 16 S.B. POLYTECHNIC, SAVLI M & I (3341905)
Prepared By Mr. Vipul Hingu Page 1 of 2
EXPERIMENT NO. 16
AIM: → To Study about Temperature Measurement.
To Study about Thermocouple.
Principle
As shown in Fig. No. 16.1 when the two dissimilar metals are joined together to form
a closed loop circuit, two junctions are formed. When one of the junction is heated the
current flow in the circuit, which can be measured with the galvanometer. The polarity and
magnitude of the current depends on the properties of the metals and the junction
temperature difference.
Construction and Working
The measuring junction of the thermocouple is kept in a protective metal sheath and
head assembly. The measuring junction is connected with the voltmeter and reference
junction with the help of extension wire.
This extension wire is also known as compensating lead. The properties of the
compensating lead. The properties of the compensating leads must be same as that of the
thermocouple but should have low resistance and must be cheaper. When the
thermocouple is heated, EMF is produced which is measured by the voltmeter connected to
it. As the voltmeter is calibrated for temperature. It shows the temperature of the
measuring junction.
Temperature Compensation
The EMF produced by the thermocouple is proportional to the temperature
differences between the cold and hot junction. As the ambient temperature changes, the
temperature of the cold junction also varies and it results in the variations in the EMF
produced by the thermocouple and results in the measurement error. This error can be
reduced or eliminated by using Wheatstone bridge circuit. This arrangement is called as cold
junction compensation.
Advantages
1) Rugged construction
2) Faster measurement
3) Easy in operation
4) High accuracy
5) Remote indication is possible
EXPERIMENT NO. 16 S.B. POLYTECHNIC, SAVLI M & I (3341905
Prepared By Mr. Vipul Hingu Page 1A
(Fig. 16.1) – Thermo electric effect in Thermocouple
(Fig. 16.2) – Components of Thermocouple
EXPERIMENT NO. 16 S.B. POLYTECHNIC, SAVLI M & I (3341905)
Prepared By Mr. Vipul Hingu Page 2 of 2
Disadvantages
1) Span of the measurement is only 33% of maximum temperature to be measure.
2) Temperature of the reference junction must is constant throughout the
measurement or the temperature compensation devices should be used.
3) Amplifiers are required in some applications.
4) Expensive accessories are required for control applications.
Application
 To measure temperature of furnace in industries.
 To measure temperature below zero 0C.
 Average temperature of the different points can be measured by using more than
one thermocouples in parallel.
 For differential temperature measurement.
 One thermocouple can be connected with two reading instruments.
EXPERIMENT NO. 17 S.B. POLYTECHNIC, SAVLI M & I (3341905)
Prepared By Mr. Vipul Hingu Page 1 of 2
EXPERIMENT NO. 17
AIM: → To Study about Pressure Measurement.
To Study about Bourdon Tube Pressure Gauge.
Principle
When an elastic transducer (bourdon tube in this case) is subjected to a pressure, it
defects. This deflection is proportional to the applied pressure when calibrated.
Description
The main parts of this instruments are as follows:
An elastic transducer, which is bourdon tube which is fixed and open at one end to
receive the pressure which is to be measured. The other end of the bourdon tube is free and
closed.
The cross-section of the bourdon tube is eliptical. The bourdon tube is in a bent form
to look like a circular arc. To the free end of the bourdon tube is attached an adjustable link,
which is in turn connected to a sector and pinion as shown in diagram. To the shaft of the
pinion is connected a pointer which sweeps over a pressure calibrated scale.
Operation of Bourdon tube
The pressure to be measured is connected to the fixed open end of the bourdon
tube. The applied pressure acts on the inner walls of the bourdon tube. Due to the applied
pressure, the bourdon tube tends to change in cross – section from ellipitcal to circular. This
tends to straighten the bourdon tube causing a displacement of the free end of the bourdon
tube.
This displacement of the free closed end of the bourdon tube is proportional to the
applied pressure. As the free end of the bourdon tube is connected to a link – section –
pinion arrangement, the displacement is amplified and converted to a rotary motion of the
pinion.
As the pinion rotates, it makes the pointer to assume a new position on a pressure
calibrated scale to indicate the applied pressure directly. As the pressure in the case
containing the bourdon tube is usually atmospheric, the pointer indicates gauge pressure.
Advantages
1) These Bourdon tube pressure gauges give accurate results.
2) Bourdon tube cost low.
3) Bourdon tube are simple in construction.
4) They can be modified to give electrical outputs.
5) They are safe even for high pressure measurement.
6) Accuracy is high especially at high pressures.
EXPERIMENT NO. 17 S.B. POLYTECHNIC, SAVLI M & I (3341905
Prepared By Mr. Vipul Hingu Page 1A
(Fig. 17.1) – Bourdon Tube Pressure Gauge
EXPERIMENT NO. 17 S.B. POLYTECHNIC, SAVLI M & I (3341905)
Prepared By Mr. Vipul Hingu Page 2 of 2
Disadvantages
1) They respond slowly to changes in pressure
2) They are subjected to hysteresis.
3) They are sensitive to shocks and vibrations.
4) Ampilification is a must as the displacement of the free end of the bourdon tube is
low.
5) It cannot be used for precision measurement.
Application
 They are used to measure medium to very high pressures.
EXPERIMENT NO. 18 S.B. POLYTECHNIC, SAVLI M & I (3341905)
Prepared By Mr. Vipul Hingu Page 1 of 2
EXPERIMENT NO. 18
AIM: → To Study about Flow Measurement.
To Study about Venturi Meter.
Principle
The working of venturi meter is based on the principle of Bernoulli’s equation.
Bernoulli’s Statement: It states that in a steady, ideal flow of an incompressible fluid, the
total energy at any point of the fluid is constant. The total energy consists of pressure
energy, kinetic energy and potential energy or datum energy.
Mathematically
Here all the energies are taken per unit weight of the fluid.
The Bernoulli’s equation for the fluid passing through the section 1 and 2 are given by
Construction
The construction of venturimeter is shown below:
It has three main parts
1) Short converging part: It is a tapered portion whose radius decreases as we
move forward.
2) Throat: It is middle portion of the venturi. Here the velocity of the fluid
increases and pressure decreases. It possesses the least cross section area.
3) Diverging part: In this portion the fluid diverges.
Fig No. 18.1 shows the schematic diagram. A U-tube manometer is used to measure
pressure head difference “h” between inlet and throat as shown. By using following
expression flow rate can be calculated.
EXPERIMENT NO. 18 S.B. POLYTECHNIC, SAVLI M & I (3341905
Prepared By Mr. Vipul Hingu Page 1A
(Fig. 18.1) – Venturi MEter
EXPERIMENT NO. 18 S.B. POLYTECHNIC, SAVLI M & I (3341905)
Prepared By Mr. Vipul Hingu Page 2 of 2
Working
The venturimeter is used to measure the rate of flow of a fluid flowing through the
pipes. Let’s understand how it does this measurement step by step.
 Here we have considered two cross section, first at the inlet and the second one is at the
throat. The difference in the pressure heads of these two sections is used to calculate
the rate of flow through venturimeter.
 As the water enters at the inlet section i.e. in the converging part it converges and
reaches to the throat.
 The throat has the uniform cross section area and least cross section area in the
venturimeter. As the water enters in the throat its velocity gets increases and due to
increase in the velocity the pressure drops to the minimum.
 Now there is a pressure difference of the fluid at the two sections. At the section 1(i.e. at
the inlet) the pressure of the fluid is maximum and the velocity is minimum. And at the
section 2 (at the throat) the velocity of the fluid is maximum and the pressure is
minimum.
 The pressure difference at the two section can be seen in the manometer attached at
both the section.
 This pressure difference is used to calculate the rate flow of a fluid flowing through a
pipe.
Applications
1) Flow rate of low pressure, high flow rate pipelines of large size.
2) Process fluid,
3) Waste materials,
4) Gas,
5) Dirty liquid,
6) Liquid containing solid particles.
Advantages
1) Less pressure drop,
2) Used for large flow rate,
3) The divergent part helps to lower the permanent pressure loss.
Disadvantages
1) Occupies more apace
2) Not suitable for pipe diameter less than 76.2 mm
3) Costly.

More Related Content

What's hot (20)

Casting defects
Casting defectsCasting defects
Casting defects
 
Slip and twiniing
Slip and twiniingSlip and twiniing
Slip and twiniing
 
Cnc notes (1)
Cnc notes (1)Cnc notes (1)
Cnc notes (1)
 
Metal cutting 1
Metal cutting 1Metal cutting 1
Metal cutting 1
 
Welding metallurgy part i
Welding metallurgy part iWelding metallurgy part i
Welding metallurgy part i
 
production technology notes
production technology notesproduction technology notes
production technology notes
 
Gating and riser in casting
Gating  and riser in castingGating  and riser in casting
Gating and riser in casting
 
Design of journal bearings
Design of journal bearingsDesign of journal bearings
Design of journal bearings
 
Linear and angular measurements
Linear and angular measurementsLinear and angular measurements
Linear and angular measurements
 
DESIGN CONSIDERATION IN CASTING
DESIGN CONSIDERATION IN CASTINGDESIGN CONSIDERATION IN CASTING
DESIGN CONSIDERATION IN CASTING
 
cost calculation on forging
 cost calculation on forging  cost calculation on forging
cost calculation on forging
 
SLIP GUAGE
SLIP GUAGESLIP GUAGE
SLIP GUAGE
 
cast iron
cast ironcast iron
cast iron
 
Merchant Circle Diagram
Merchant Circle DiagramMerchant Circle Diagram
Merchant Circle Diagram
 
Chapter 11 heat treatment
Chapter 11 heat treatmentChapter 11 heat treatment
Chapter 11 heat treatment
 
Screwed joints
Screwed jointsScrewed joints
Screwed joints
 
Sheet metal process unit 4 notes
Sheet metal process unit 4 notesSheet metal process unit 4 notes
Sheet metal process unit 4 notes
 
Tool maker microscope
Tool maker microscopeTool maker microscope
Tool maker microscope
 
L6 measurement of gear tooth
L6 measurement of gear toothL6 measurement of gear tooth
L6 measurement of gear tooth
 
Casting
CastingCasting
Casting
 

Similar to 3341905 LAB_MANUAL_PREPARED BY_VIPUL HINGU

Fisika Bilingual Besaran dan Satuan Kelas 7
Fisika Bilingual Besaran dan Satuan Kelas 7Fisika Bilingual Besaran dan Satuan Kelas 7
Fisika Bilingual Besaran dan Satuan Kelas 7Frank Nanda
 
1 introducation to physics t
1 introducation to physics t1 introducation to physics t
1 introducation to physics thazivoc
 
Measurements
MeasurementsMeasurements
Measurementspglaynn
 
Units & measurements
Units &  measurementsUnits &  measurements
Units & measurementsAmol Kumbhar
 
International system-units (Science 6)
International system-units (Science 6)International system-units (Science 6)
International system-units (Science 6)Nesly Van Lorenzo
 
perrys-handbook-LENGKAP.pdf
perrys-handbook-LENGKAP.pdfperrys-handbook-LENGKAP.pdf
perrys-handbook-LENGKAP.pdfGopal Verma
 
Units and Measurements.pptx
Units and Measurements.pptxUnits and Measurements.pptx
Units and Measurements.pptxpavanhu
 
Perry’s Chemical Engineers’ Handbook 7ma Ed Chap 01
Perry’s Chemical Engineers’ Handbook  7ma Ed Chap 01Perry’s Chemical Engineers’ Handbook  7ma Ed Chap 01
Perry’s Chemical Engineers’ Handbook 7ma Ed Chap 01Grey Enterprise Holdings, Inc.
 
Lecture Notes: EEEC6430312 Measurements And Instrumentation - Fundamentals O...
Lecture Notes:  EEEC6430312 Measurements And Instrumentation - Fundamentals O...Lecture Notes:  EEEC6430312 Measurements And Instrumentation - Fundamentals O...
Lecture Notes: EEEC6430312 Measurements And Instrumentation - Fundamentals O...AIMST University
 
Metrology lab mannual 15 5-14
Metrology lab mannual 15 5-14Metrology lab mannual 15 5-14
Metrology lab mannual 15 5-14Dr B Sudarshan
 
9th class Physics notes | Chapter no 01 by Ahsan Mehmood
9th class Physics notes | Chapter no 01 by Ahsan Mehmood9th class Physics notes | Chapter no 01 by Ahsan Mehmood
9th class Physics notes | Chapter no 01 by Ahsan MehmoodAhsanMehmood45
 
Mechanics Chapter 1 units, base & derived quantities
Mechanics Chapter 1 units, base & derived quantitiesMechanics Chapter 1 units, base & derived quantities
Mechanics Chapter 1 units, base & derived quantitiesLily
 
Metrology and Quality Control.pptx
Metrology and Quality Control.pptxMetrology and Quality Control.pptx
Metrology and Quality Control.pptx138HemangiAhire
 
1.0 Physical Quantities and Measurement
1.0 Physical Quantities and Measurement1.0 Physical Quantities and Measurement
1.0 Physical Quantities and MeasurementYusri Yusop
 
Dimestion and standards, SI Unit system
Dimestion and standards, SI Unit systemDimestion and standards, SI Unit system
Dimestion and standards, SI Unit systemDr Naim R Kidwai
 

Similar to 3341905 LAB_MANUAL_PREPARED BY_VIPUL HINGU (20)

Fisika Bilingual Besaran dan Satuan Kelas 7
Fisika Bilingual Besaran dan Satuan Kelas 7Fisika Bilingual Besaran dan Satuan Kelas 7
Fisika Bilingual Besaran dan Satuan Kelas 7
 
1 introducation to physics t
1 introducation to physics t1 introducation to physics t
1 introducation to physics t
 
Measurements
MeasurementsMeasurements
Measurements
 
Measurement
MeasurementMeasurement
Measurement
 
Measurement
MeasurementMeasurement
Measurement
 
Units & measurements
Units &  measurementsUnits &  measurements
Units & measurements
 
International system-units (Science 6)
International system-units (Science 6)International system-units (Science 6)
International system-units (Science 6)
 
PPT-PMN-UNIT-1.pdf
PPT-PMN-UNIT-1.pdfPPT-PMN-UNIT-1.pdf
PPT-PMN-UNIT-1.pdf
 
perrys-handbook-LENGKAP.pdf
perrys-handbook-LENGKAP.pdfperrys-handbook-LENGKAP.pdf
perrys-handbook-LENGKAP.pdf
 
Units and Measurements.pptx
Units and Measurements.pptxUnits and Measurements.pptx
Units and Measurements.pptx
 
01 physical quantities
01 physical quantities01 physical quantities
01 physical quantities
 
Perry’s Chemical Engineers’ Handbook 7ma Ed Chap 01
Perry’s Chemical Engineers’ Handbook  7ma Ed Chap 01Perry’s Chemical Engineers’ Handbook  7ma Ed Chap 01
Perry’s Chemical Engineers’ Handbook 7ma Ed Chap 01
 
Lecture Notes: EEEC6430312 Measurements And Instrumentation - Fundamentals O...
Lecture Notes:  EEEC6430312 Measurements And Instrumentation - Fundamentals O...Lecture Notes:  EEEC6430312 Measurements And Instrumentation - Fundamentals O...
Lecture Notes: EEEC6430312 Measurements And Instrumentation - Fundamentals O...
 
Metrology lab mannual 15 5-14
Metrology lab mannual 15 5-14Metrology lab mannual 15 5-14
Metrology lab mannual 15 5-14
 
9th class Physics notes | Chapter no 01 by Ahsan Mehmood
9th class Physics notes | Chapter no 01 by Ahsan Mehmood9th class Physics notes | Chapter no 01 by Ahsan Mehmood
9th class Physics notes | Chapter no 01 by Ahsan Mehmood
 
Mechanics Chapter 1 units, base & derived quantities
Mechanics Chapter 1 units, base & derived quantitiesMechanics Chapter 1 units, base & derived quantities
Mechanics Chapter 1 units, base & derived quantities
 
Metrology and Quality Control.pptx
Metrology and Quality Control.pptxMetrology and Quality Control.pptx
Metrology and Quality Control.pptx
 
1.0 Physical Quantities and Measurement
1.0 Physical Quantities and Measurement1.0 Physical Quantities and Measurement
1.0 Physical Quantities and Measurement
 
Ch1 Metrology.pptx
Ch1 Metrology.pptxCh1 Metrology.pptx
Ch1 Metrology.pptx
 
Dimestion and standards, SI Unit system
Dimestion and standards, SI Unit systemDimestion and standards, SI Unit system
Dimestion and standards, SI Unit system
 

More from Vipul Hingu

ITI Draftsman Mechanical
ITI Draftsman MechanicalITI Draftsman Mechanical
ITI Draftsman MechanicalVipul Hingu
 
3341905_M & I_ASSIGNMENT_NO_6
3341905_M & I_ASSIGNMENT_NO_63341905_M & I_ASSIGNMENT_NO_6
3341905_M & I_ASSIGNMENT_NO_6Vipul Hingu
 
3341905_M & I_ASSIGNMENT_NO_5
3341905_M & I_ASSIGNMENT_NO_53341905_M & I_ASSIGNMENT_NO_5
3341905_M & I_ASSIGNMENT_NO_5Vipul Hingu
 
3341905_M & I_ASSIGNMENT_NO_4
3341905_M & I_ASSIGNMENT_NO_43341905_M & I_ASSIGNMENT_NO_4
3341905_M & I_ASSIGNMENT_NO_4Vipul Hingu
 
3341905_M & I_ASSIGNMENT_NO_3
3341905_M & I_ASSIGNMENT_NO_33341905_M & I_ASSIGNMENT_NO_3
3341905_M & I_ASSIGNMENT_NO_3Vipul Hingu
 
3341905_M & I_ASSIGNMENT_NO_2
3341905_M & I_ASSIGNMENT_NO_23341905_M & I_ASSIGNMENT_NO_2
3341905_M & I_ASSIGNMENT_NO_2Vipul Hingu
 
3341905_M & I_ASSIGNMENT_NO_1
3341905_M & I_ASSIGNMENT_NO_13341905_M & I_ASSIGNMENT_NO_1
3341905_M & I_ASSIGNMENT_NO_1Vipul Hingu
 
3351905_ecc_assignment_no_4
3351905_ecc_assignment_no_43351905_ecc_assignment_no_4
3351905_ecc_assignment_no_4Vipul Hingu
 
3351905 _ecc_assignment_no_2
3351905 _ecc_assignment_no_23351905 _ecc_assignment_no_2
3351905 _ecc_assignment_no_2Vipul Hingu
 
3351905_ecc_assignment_no_1
3351905_ecc_assignment_no_13351905_ecc_assignment_no_1
3351905_ecc_assignment_no_1Vipul Hingu
 
3331903_fmhm_unit-6.2_hydraulic prime movers
3331903_fmhm_unit-6.2_hydraulic prime movers3331903_fmhm_unit-6.2_hydraulic prime movers
3331903_fmhm_unit-6.2_hydraulic prime moversVipul Hingu
 
3351905 ecc lab_manual_prepared by vhh
3351905 ecc lab_manual_prepared by vhh3351905 ecc lab_manual_prepared by vhh
3351905 ecc lab_manual_prepared by vhhVipul Hingu
 
3321902 MD LAB_MANUAL_PREPARED BY VHH & BRV
3321902 MD LAB_MANUAL_PREPARED BY VHH & BRV3321902 MD LAB_MANUAL_PREPARED BY VHH & BRV
3321902 MD LAB_MANUAL_PREPARED BY VHH & BRVVipul Hingu
 
3341903 tom lab_manual_prepared by mvp & vhh
3341903 tom lab_manual_prepared by mvp & vhh3341903 tom lab_manual_prepared by mvp & vhh
3341903 tom lab_manual_prepared by mvp & vhhVipul Hingu
 
3341901 me ii-lab_manual_prepared by vipul hingu
3341901 me ii-lab_manual_prepared by vipul hingu3341901 me ii-lab_manual_prepared by vipul hingu
3341901 me ii-lab_manual_prepared by vipul hinguVipul Hingu
 
3341906 pms lab_manual_prepared by vipul hingu
3341906 pms lab_manual_prepared by vipul hingu3341906 pms lab_manual_prepared by vipul hingu
3341906 pms lab_manual_prepared by vipul hinguVipul Hingu
 
3341904 cad lab_manual_prepared by vipul hingu
3341904 cad lab_manual_prepared by vipul hingu3341904 cad lab_manual_prepared by vipul hingu
3341904 cad lab_manual_prepared by vipul hinguVipul Hingu
 

More from Vipul Hingu (17)

ITI Draftsman Mechanical
ITI Draftsman MechanicalITI Draftsman Mechanical
ITI Draftsman Mechanical
 
3341905_M & I_ASSIGNMENT_NO_6
3341905_M & I_ASSIGNMENT_NO_63341905_M & I_ASSIGNMENT_NO_6
3341905_M & I_ASSIGNMENT_NO_6
 
3341905_M & I_ASSIGNMENT_NO_5
3341905_M & I_ASSIGNMENT_NO_53341905_M & I_ASSIGNMENT_NO_5
3341905_M & I_ASSIGNMENT_NO_5
 
3341905_M & I_ASSIGNMENT_NO_4
3341905_M & I_ASSIGNMENT_NO_43341905_M & I_ASSIGNMENT_NO_4
3341905_M & I_ASSIGNMENT_NO_4
 
3341905_M & I_ASSIGNMENT_NO_3
3341905_M & I_ASSIGNMENT_NO_33341905_M & I_ASSIGNMENT_NO_3
3341905_M & I_ASSIGNMENT_NO_3
 
3341905_M & I_ASSIGNMENT_NO_2
3341905_M & I_ASSIGNMENT_NO_23341905_M & I_ASSIGNMENT_NO_2
3341905_M & I_ASSIGNMENT_NO_2
 
3341905_M & I_ASSIGNMENT_NO_1
3341905_M & I_ASSIGNMENT_NO_13341905_M & I_ASSIGNMENT_NO_1
3341905_M & I_ASSIGNMENT_NO_1
 
3351905_ecc_assignment_no_4
3351905_ecc_assignment_no_43351905_ecc_assignment_no_4
3351905_ecc_assignment_no_4
 
3351905 _ecc_assignment_no_2
3351905 _ecc_assignment_no_23351905 _ecc_assignment_no_2
3351905 _ecc_assignment_no_2
 
3351905_ecc_assignment_no_1
3351905_ecc_assignment_no_13351905_ecc_assignment_no_1
3351905_ecc_assignment_no_1
 
3331903_fmhm_unit-6.2_hydraulic prime movers
3331903_fmhm_unit-6.2_hydraulic prime movers3331903_fmhm_unit-6.2_hydraulic prime movers
3331903_fmhm_unit-6.2_hydraulic prime movers
 
3351905 ecc lab_manual_prepared by vhh
3351905 ecc lab_manual_prepared by vhh3351905 ecc lab_manual_prepared by vhh
3351905 ecc lab_manual_prepared by vhh
 
3321902 MD LAB_MANUAL_PREPARED BY VHH & BRV
3321902 MD LAB_MANUAL_PREPARED BY VHH & BRV3321902 MD LAB_MANUAL_PREPARED BY VHH & BRV
3321902 MD LAB_MANUAL_PREPARED BY VHH & BRV
 
3341903 tom lab_manual_prepared by mvp & vhh
3341903 tom lab_manual_prepared by mvp & vhh3341903 tom lab_manual_prepared by mvp & vhh
3341903 tom lab_manual_prepared by mvp & vhh
 
3341901 me ii-lab_manual_prepared by vipul hingu
3341901 me ii-lab_manual_prepared by vipul hingu3341901 me ii-lab_manual_prepared by vipul hingu
3341901 me ii-lab_manual_prepared by vipul hingu
 
3341906 pms lab_manual_prepared by vipul hingu
3341906 pms lab_manual_prepared by vipul hingu3341906 pms lab_manual_prepared by vipul hingu
3341906 pms lab_manual_prepared by vipul hingu
 
3341904 cad lab_manual_prepared by vipul hingu
3341904 cad lab_manual_prepared by vipul hingu3341904 cad lab_manual_prepared by vipul hingu
3341904 cad lab_manual_prepared by vipul hingu
 

Recently uploaded

Framing an Appropriate Research Question 6b9b26d93da94caf993c038d9efcdedb.pdf
Framing an Appropriate Research Question 6b9b26d93da94caf993c038d9efcdedb.pdfFraming an Appropriate Research Question 6b9b26d93da94caf993c038d9efcdedb.pdf
Framing an Appropriate Research Question 6b9b26d93da94caf993c038d9efcdedb.pdfUjwalaBharambe
 
Roles & Responsibilities in Pharmacovigilance
Roles & Responsibilities in PharmacovigilanceRoles & Responsibilities in Pharmacovigilance
Roles & Responsibilities in PharmacovigilanceSamikshaHamane
 
Enzyme, Pharmaceutical Aids, Miscellaneous Last Part of Chapter no 5th.pdf
Enzyme, Pharmaceutical Aids, Miscellaneous Last Part of Chapter no 5th.pdfEnzyme, Pharmaceutical Aids, Miscellaneous Last Part of Chapter no 5th.pdf
Enzyme, Pharmaceutical Aids, Miscellaneous Last Part of Chapter no 5th.pdfSumit Tiwari
 
Gas measurement O2,Co2,& ph) 04/2024.pptx
Gas measurement O2,Co2,& ph) 04/2024.pptxGas measurement O2,Co2,& ph) 04/2024.pptx
Gas measurement O2,Co2,& ph) 04/2024.pptxDr.Ibrahim Hassaan
 
Difference Between Search & Browse Methods in Odoo 17
Difference Between Search & Browse Methods in Odoo 17Difference Between Search & Browse Methods in Odoo 17
Difference Between Search & Browse Methods in Odoo 17Celine George
 
DATA STRUCTURE AND ALGORITHM for beginners
DATA STRUCTURE AND ALGORITHM for beginnersDATA STRUCTURE AND ALGORITHM for beginners
DATA STRUCTURE AND ALGORITHM for beginnersSabitha Banu
 
How to Configure Email Server in Odoo 17
How to Configure Email Server in Odoo 17How to Configure Email Server in Odoo 17
How to Configure Email Server in Odoo 17Celine George
 
What is Model Inheritance in Odoo 17 ERP
What is Model Inheritance in Odoo 17 ERPWhat is Model Inheritance in Odoo 17 ERP
What is Model Inheritance in Odoo 17 ERPCeline George
 
18-04-UA_REPORT_MEDIALITERAСY_INDEX-DM_23-1-final-eng.pdf
18-04-UA_REPORT_MEDIALITERAСY_INDEX-DM_23-1-final-eng.pdf18-04-UA_REPORT_MEDIALITERAСY_INDEX-DM_23-1-final-eng.pdf
18-04-UA_REPORT_MEDIALITERAСY_INDEX-DM_23-1-final-eng.pdfssuser54595a
 
MARGINALIZATION (Different learners in Marginalized Group
MARGINALIZATION (Different learners in Marginalized GroupMARGINALIZATION (Different learners in Marginalized Group
MARGINALIZATION (Different learners in Marginalized GroupJonathanParaisoCruz
 
MICROBIOLOGY biochemical test detailed.pptx
MICROBIOLOGY biochemical test detailed.pptxMICROBIOLOGY biochemical test detailed.pptx
MICROBIOLOGY biochemical test detailed.pptxabhijeetpadhi001
 
Introduction to ArtificiaI Intelligence in Higher Education
Introduction to ArtificiaI Intelligence in Higher EducationIntroduction to ArtificiaI Intelligence in Higher Education
Introduction to ArtificiaI Intelligence in Higher Educationpboyjonauth
 
CELL CYCLE Division Science 8 quarter IV.pptx
CELL CYCLE Division Science 8 quarter IV.pptxCELL CYCLE Division Science 8 quarter IV.pptx
CELL CYCLE Division Science 8 quarter IV.pptxJiesonDelaCerna
 
call girls in Kamla Market (DELHI) 🔝 >༒9953330565🔝 genuine Escort Service 🔝✔️✔️
call girls in Kamla Market (DELHI) 🔝 >༒9953330565🔝 genuine Escort Service 🔝✔️✔️call girls in Kamla Market (DELHI) 🔝 >༒9953330565🔝 genuine Escort Service 🔝✔️✔️
call girls in Kamla Market (DELHI) 🔝 >༒9953330565🔝 genuine Escort Service 🔝✔️✔️9953056974 Low Rate Call Girls In Saket, Delhi NCR
 
Crayon Activity Handout For the Crayon A
Crayon Activity Handout For the Crayon ACrayon Activity Handout For the Crayon A
Crayon Activity Handout For the Crayon AUnboundStockton
 
Presiding Officer Training module 2024 lok sabha elections
Presiding Officer Training module 2024 lok sabha electionsPresiding Officer Training module 2024 lok sabha elections
Presiding Officer Training module 2024 lok sabha electionsanshu789521
 
Like-prefer-love -hate+verb+ing & silent letters & citizenship text.pdf
Like-prefer-love -hate+verb+ing & silent letters & citizenship text.pdfLike-prefer-love -hate+verb+ing & silent letters & citizenship text.pdf
Like-prefer-love -hate+verb+ing & silent letters & citizenship text.pdfMr Bounab Samir
 

Recently uploaded (20)

Framing an Appropriate Research Question 6b9b26d93da94caf993c038d9efcdedb.pdf
Framing an Appropriate Research Question 6b9b26d93da94caf993c038d9efcdedb.pdfFraming an Appropriate Research Question 6b9b26d93da94caf993c038d9efcdedb.pdf
Framing an Appropriate Research Question 6b9b26d93da94caf993c038d9efcdedb.pdf
 
Roles & Responsibilities in Pharmacovigilance
Roles & Responsibilities in PharmacovigilanceRoles & Responsibilities in Pharmacovigilance
Roles & Responsibilities in Pharmacovigilance
 
Enzyme, Pharmaceutical Aids, Miscellaneous Last Part of Chapter no 5th.pdf
Enzyme, Pharmaceutical Aids, Miscellaneous Last Part of Chapter no 5th.pdfEnzyme, Pharmaceutical Aids, Miscellaneous Last Part of Chapter no 5th.pdf
Enzyme, Pharmaceutical Aids, Miscellaneous Last Part of Chapter no 5th.pdf
 
Gas measurement O2,Co2,& ph) 04/2024.pptx
Gas measurement O2,Co2,& ph) 04/2024.pptxGas measurement O2,Co2,& ph) 04/2024.pptx
Gas measurement O2,Co2,& ph) 04/2024.pptx
 
Difference Between Search & Browse Methods in Odoo 17
Difference Between Search & Browse Methods in Odoo 17Difference Between Search & Browse Methods in Odoo 17
Difference Between Search & Browse Methods in Odoo 17
 
DATA STRUCTURE AND ALGORITHM for beginners
DATA STRUCTURE AND ALGORITHM for beginnersDATA STRUCTURE AND ALGORITHM for beginners
DATA STRUCTURE AND ALGORITHM for beginners
 
How to Configure Email Server in Odoo 17
How to Configure Email Server in Odoo 17How to Configure Email Server in Odoo 17
How to Configure Email Server in Odoo 17
 
Model Call Girl in Tilak Nagar Delhi reach out to us at 🔝9953056974🔝
Model Call Girl in Tilak Nagar Delhi reach out to us at 🔝9953056974🔝Model Call Girl in Tilak Nagar Delhi reach out to us at 🔝9953056974🔝
Model Call Girl in Tilak Nagar Delhi reach out to us at 🔝9953056974🔝
 
What is Model Inheritance in Odoo 17 ERP
What is Model Inheritance in Odoo 17 ERPWhat is Model Inheritance in Odoo 17 ERP
What is Model Inheritance in Odoo 17 ERP
 
18-04-UA_REPORT_MEDIALITERAСY_INDEX-DM_23-1-final-eng.pdf
18-04-UA_REPORT_MEDIALITERAСY_INDEX-DM_23-1-final-eng.pdf18-04-UA_REPORT_MEDIALITERAСY_INDEX-DM_23-1-final-eng.pdf
18-04-UA_REPORT_MEDIALITERAСY_INDEX-DM_23-1-final-eng.pdf
 
MARGINALIZATION (Different learners in Marginalized Group
MARGINALIZATION (Different learners in Marginalized GroupMARGINALIZATION (Different learners in Marginalized Group
MARGINALIZATION (Different learners in Marginalized Group
 
MICROBIOLOGY biochemical test detailed.pptx
MICROBIOLOGY biochemical test detailed.pptxMICROBIOLOGY biochemical test detailed.pptx
MICROBIOLOGY biochemical test detailed.pptx
 
Introduction to ArtificiaI Intelligence in Higher Education
Introduction to ArtificiaI Intelligence in Higher EducationIntroduction to ArtificiaI Intelligence in Higher Education
Introduction to ArtificiaI Intelligence in Higher Education
 
CELL CYCLE Division Science 8 quarter IV.pptx
CELL CYCLE Division Science 8 quarter IV.pptxCELL CYCLE Division Science 8 quarter IV.pptx
CELL CYCLE Division Science 8 quarter IV.pptx
 
call girls in Kamla Market (DELHI) 🔝 >༒9953330565🔝 genuine Escort Service 🔝✔️✔️
call girls in Kamla Market (DELHI) 🔝 >༒9953330565🔝 genuine Escort Service 🔝✔️✔️call girls in Kamla Market (DELHI) 🔝 >༒9953330565🔝 genuine Escort Service 🔝✔️✔️
call girls in Kamla Market (DELHI) 🔝 >༒9953330565🔝 genuine Escort Service 🔝✔️✔️
 
Crayon Activity Handout For the Crayon A
Crayon Activity Handout For the Crayon ACrayon Activity Handout For the Crayon A
Crayon Activity Handout For the Crayon A
 
Presiding Officer Training module 2024 lok sabha elections
Presiding Officer Training module 2024 lok sabha electionsPresiding Officer Training module 2024 lok sabha elections
Presiding Officer Training module 2024 lok sabha elections
 
ESSENTIAL of (CS/IT/IS) class 06 (database)
ESSENTIAL of (CS/IT/IS) class 06 (database)ESSENTIAL of (CS/IT/IS) class 06 (database)
ESSENTIAL of (CS/IT/IS) class 06 (database)
 
Model Call Girl in Bikash Puri Delhi reach out to us at 🔝9953056974🔝
Model Call Girl in Bikash Puri  Delhi reach out to us at 🔝9953056974🔝Model Call Girl in Bikash Puri  Delhi reach out to us at 🔝9953056974🔝
Model Call Girl in Bikash Puri Delhi reach out to us at 🔝9953056974🔝
 
Like-prefer-love -hate+verb+ing & silent letters & citizenship text.pdf
Like-prefer-love -hate+verb+ing & silent letters & citizenship text.pdfLike-prefer-love -hate+verb+ing & silent letters & citizenship text.pdf
Like-prefer-love -hate+verb+ing & silent letters & citizenship text.pdf
 

3341905 LAB_MANUAL_PREPARED BY_VIPUL HINGU

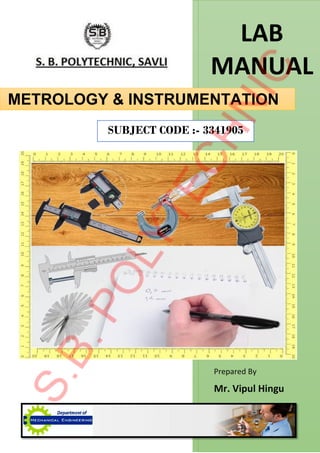
  • 1. LAB MANUAL Prepared By Mr. Vipul Hingu METROLOGY & INSTRUMENTATION SUBJECT CODE :- 3341905
  • 2. LAB PRACTICAL LIST S.B. POLYTECHNIC, SAVLI M & I (3341905) Prepared By Mr. Vipul Hingu Page 1 of 1 PRACTICAL LIST Practical No. Aim of Practical 1 Preperatory Activity 2 Linear Measurement - Vernier Caliper 3 Linear Measurement - Outside & Inside Micrometer 4 Linear Measurement – Telescopic Gauge 5 Angular Measurement - Bevel protector 6 Angular Measurement - Sine Bar 7 To Study Straightness Testing 8 To Study Flatness Testing 9 To Study Squareness, Perpendicularity And Parallity 10 To Study Roundness, Cylindricity, Concentricity, Run Out and Ovality 11 To Study about Measurement of Surface Roughness 12 To Study about Gear Measurement 13 To Study about Thread Measurement 14 To Study about Limit Gauges 15 To Study about Non-Destructive Testing-NDT 16 To Study about Temperature Measurement 17 To Study about Pressure Measurement 18 To Study about Flow Measurement
  • 3. EXPERIMENT NO. 1 S.B. POLYTECHNIC, SAVLI M & I (3341905) Prepared By Mr. Vipul Hingu Page 1 of 4 EXPERIMENT NO. 1 AIM: → Preperatory Activity. In This Experiment We Study about S.I. basic, Supplementary and Derived units and their conversions. Objective :  To Study about SI Units and their conversions. Introduction Throughout the centuries, many measurement systems have been developed. Evolving from numerous origins, they have been modified by custom and local adaptations. Most therefore lack rational structure. The Imperial system, which uses measurements such as the yard, quart, and pound, is an example of poorly correlated units. About 200 years ago, France invented the metric system to bring order to its measures. Although strongly opposed at first, this new system proved effective and gained popularity, so much so that 98 per cent of the world's population now lives in countries that have adopted or are changing to the metric system. These countries include the USA, where conversion to SI is further advanced than is superficially apparent Finally, in 1960, the International System of Units was established as a result of a long series of international discussions. This modernized metric system, called SI from the French name le Systeme International d'unites replaced all former systems of measurement, including former versions of the metric system. Canada, too, decided to adopt SI. SI includes familiar metric units such as the metre and kilogram. There are, however, a number of changes from former metric systems. For instance, the centigrade temperature scale is called the Celsius scale. This is a change in name only, so that 20°C, formerly read as "twenty degrees centigrade" is now read as "twenty degrees Celsius". No change occurs in the scale, only in the name. Water still freezes at 0°C and boils at 100°C. This kind of change is not difficult for those who are familiar with older metric systems. Other changes which are of a more specialized nature will be examined later. Before universal approval of SI, the Imperial and various metric systems were the prevalent expressions of measurement in the world. The use of SI has eliminated confusion by: 1) Providing a coherent system of units. 2) Ensuring that quantities and units are uniform in concept and style. 3) Minimizing the number of multiples and submultiples in use. Names and symbols for basic SI units SI has three types of units: (A) SI Base units. (B) SI Derived units. (C) SI Supplementary units.
  • 4. EXPERIMENT NO. 1 S.B. POLYTECHNIC, SAVLI M & I (3341905) Prepared By Mr. Vipul Hingu Page 2 of 4 (A) SI Base Units SI is founded on seven units called "base units". All derived units are a variation of these seven units. ANY PHYSICAL QUANTITY CAN BE EXPRESSED IN SI BY APPROPRIATE COMBINATIONS OF THE BASE UNITS; as given in Table No. 1.1 (Table No. 1.1) Base quantity SI Base Units Name Symbol Length Meter m Mass Kilogram kg Time Second s Electric current Ampere A Thermodynamic Temperature Kelvin K Amount of substance Mole mol Luminous itensuty candela cd (B) SI Derived units Other quantities, called derived quantities, are defined in terms of the seven base quantities via a system of quantity equations. The SI derived units for these derived quantities are obtained from these equations and the seven SI base units. Examples of such SI derived units are given in Table No. 1.2, where it should be noted that the symbol 1 for quantities of dimension 1 such as mass fraction is generally omitted. (Table No. 1.2) Derived quantity SI Derived Units Name Symbol Area square meter m2 Volume cubic meter m3 Speed, Velocity meter per second m s-1 Acceleration meter per second squared m s-2 Wave number Reciprocal meter m-1 Mass density kilogram per cubic meter kg m-3 Specific volume cubic meter per kilogram m3 kg-1 Current density ampere per square meter A m-2 Magnetic field strength ampere per meter A m-1 Amount of substance concentration mole per cubic meter mol m-3 Luminance candela per square meter cd m-2 Mass fraction kilogram per kilogram. which may be represented by the number 1 kg kg-1 = 1
  • 5. EXPERIMENT NO. 1 S.B. POLYTECHNIC, SAVLI M & I (3341905) Prepared By Mr. Vipul Hingu Page 3 of 4 (C) Supplementary Units For ease of understanding and convenience, 21 SI derived units have been given special names and symbols, as shown in Table No 1.3 (Table No. 1.3) Derived quantity SI Derived Units Name Symbol Expression in terms of other SI units Expression in terms of SI Base units Plane angle radiana rad - m m-1 =1b Solid angle steradiana src - m2 m-2 =1b Frequency hertz Hz - s-1 Force newton N - m kg s-2 Pressure, Stress pascal Pa N m2 m-1 kg s-2 Energy, Work, quantity of heat joule J N-m m2 kg s-2 Power, Radiant flux watt W J s-1 m2 kg s-3 Electric charge, Quantity of electricity coulomb C - s A Electric potential difference, Electromotive force volt V W A-1 m2 kg s-3 A-1 Electric capacitance farad F C V-1 m-2 kg-1 s4 A2 Electric resistance ohm Ω V A-1 m2 kg s-3 A-2 Electric conductance siemens S A V-1 m-2 kg-1 s-3 A2 Magnetic flux weber Wb V s m2 kg s-2 A-1 Magnetic flux density tesla T Wb m-2 kg s-2 A-1 Inductance henry H Wb/A m2 kg s-2 A-2 Celsius temperature degree celsius C - K Luminous flux lumen Lm Cd src m2 m-2 cd = cd sr Illumination lux lx Lm m-2 m2 m-4 cd = m-2 sr cd Acticity (of a radionuclide) becquerels Bq - s-1 Absorbed dose, specific energy (imparted), kerma gray Gy J kg-1 m2 s-2 Dose equivalent sievert Sv J-1 kg m2 s-2 Hear, b = In practice, the symbols rad and sr are used where appropriate, but the derived unit "1" is generally omitted c = In photometry, the unit name steradian and the unit symbol sr are usually retained in expressions for derived units.
  • 6. EXPERIMENT NO. 1 S.B. POLYTECHNIC, SAVLI M & I (3341905) Prepared By Mr. Vipul Hingu Page 4 of 4 Conversions 1) Length Length Length 1 meter = _________ mm 1 inch = _________ mm 1 meter = _________ cm 1 inch = _________ cm 1 meter = _________ inch 1 inch = _________ meter Length Length 1 yard = _________ foot 1 mm = _________ meter 1 foot = _________ inch 1 mm = _________ cm 1 mm = _________ micro 1 mm = _________ inch 1 mile = _________ km 1 km = _________ meter 2) Area Area Area 1 mm2 = _________ inch2 1 inch2 = _________ mm2 1 mm2 = _________ cm2 1 inch2 = _________ cm2 1 mm2 = _________ meter2 1 inch2 = _________ meter2 Area 1 meter2 = _________ mm2 1 meter2 = _________ cm2 1 meter2 = _________ inch2 Define 1) Axis: An imaginary line about which a body rotates. 2) Center: The point that is equally distant from every point on the circumference of a circle or sphere. 3) Angle: The space (usually measured in degrees) between two intersecting lines or surfaces at or close to the point where they meet. 4) Plane: A flat surface on which a straight line joining any two points on it would wholly lie. 5) Solid angle: A three-dimensional analogue of an angle, such as that subtended by a cone or formed by planes meeting at a point. It is measured in steradians.
  • 7. EXPERIMENT NO. 2 S.B. POLYTECHNIC, SAVLI M & I (3341905) Prepared By Mr. Vipul Hingu Page 1 of 3 EXPERIMENT NO. 2 AIM: → Linear Measurement - Vernier Caliper To determine the Length, Width & Thickness of the given specimen by using Vernier Caliper. Objective  To understand the constructional parts of Vernier Caliper.  How to calculate least count of Vernier Caliper?  How to take measurement with the help of Vernier Caliper? Apparatus Required  Vernier Caliper,  Work piece. Procedure 1) Clean the main scale, Vernier scale and measuring jaws of the Vernier Caliper. 2) The Vernier Caliper is checked for zero error. 3) Place the measuring jaw such that it touches the surface to be measured from the Smooth surface. 4) Measure the main scale reading and Vernier scale coincidence of the Vernier Caliper. Least count The smallest value that can be measured by the instrument is known as its least count. There are two methods to find the least count of Vernier Caliper. 1. First Method  Length of 49 divisions on main scale = Length of 50 divisions on Vernier scale.  It means it follows that for the same length if there is n division on main scale then there should be n+1 division on Vernier Scale for the same distance.  Value of smallest division on main scale = 1 mm and  Value of smallest division on Vernier scale = 49/50 = 0.98 mm Therefore, Least count = Value of smallest division – Value on smallest division on main scale on Vernier scale =1 – 0.98 = 0.02 mm 2. Second Method Smallest division on Main scale = 1 mm Total no. of divisions on Vernier Scale = 50 markings
  • 8. EXPERIMENT NO. 2 S.B. POLYTECHNIC, SAVLI M & I (3341905) Prepared By Mr. Vipul Hingu Page 1A (Fig, 2.1) Basic Vernier Caliper
  • 9. EXPERIMENT NO. 2 S.B. POLYTECHNIC, SAVLI M & I (3341905) Prepared By Mr. Vipul Hingu Page 2 of 3 Therefore, Least Count = = = 0.02 mm Reading a Vernier Caliper Formulae for calculating total reading with the help of Vernier caliper is Total Reading = (Main Scale Reading) + (Least Count of V.C. X Vernier division exactly coincides with main scale division) = 12 + 0.02 X 0.42 = 12.84 mm Formula & Calculation Total Reading = (Main Scale Reading) + (Least Count of V.C. X Vernier division exactly coincides with main scale division) = ____ + (____ X ____) = _____ mm Drawing of the Job
  • 10. EXPERIMENT NO. 2 S.B. POLYTECHNIC, SAVLI M & I (3341905) Prepared By Mr. Vipul Hingu Page 2A (How to measure different measurement by using Vernier Caliper)
  • 11. EXPERIMENT NO. 2 S.B. POLYTECHNIC, SAVLI M & I (3341905) Prepared By Mr. Vipul Hingu Page 3 of 3 Readings Table No Main scale reading (A) No of Vernier scale division in coincidence Vernier scale division X Least count (B) Total Reading (A + B) Length Width Thickness Applications Vernier Caliper is extensively used in the engineering for measuring external and internal diameters, lengths, thickness, depth and other dimensions. Conclusion Now we've got to use this Vernier Caliper.
  • 12. EXPERIMENT NO. 3 S.B. POLYTECHNIC, SAVLI M & I (3341905) Prepared By Mr. Vipul Hingu Page 1 of 3 EXPERIMENT NO. 3 AIM: → Linear Measurement - Outside & Inside Micrometer To determine the Length & Inside & Outside Diameter of the given specimen by using Outside & Inside Micrometer. Objective  To understand the constructional parts of Outside & Inside Micrometer.  How to calculate least count of Outside & Inside Micrometer?  How to take measurement with the help of Outside & Inside Micrometer? Apparatus Required  Outside Micrometer,  Inside Micrometer,  Work piece. Procedure 1) Clean the main scale, Circular scale and measuring jaws of the Outside & Inside Micrometer. 2) The Outside & Inside Micrometer is checked for zero error. 3) Place the Object between measuring anvil and Spindle such that it touches the surface to be measured from the Smooth surface. 4) Measure the main scale reading and Circular scale coincidence of the Outside & Inside Micrometer. Least count The smallest value that can be measured by the instrument is known as its least count. Micrometer works on the principle of screw and nut. We know that when a screw is turned through nut byone revolution, it advances by one pitch distance i.e. one rotation of screw corresponds to a linear movement of adistance equal to pitch of the thread. If the circumference of the screw is divided into number of equal parts say “n”,its rotation through one division will cause the screw to advance through (Pitch/n) length. Least count = Thus by reducing the pitch of the screw thread or by increasing the number of divisions on the circumference of screw, the length value of one circumferential division (L.C.) can be reduced and accuracy of measurement can be increased considerably  Micrometer has a screw of 0.50 mm pitch  With a thimble graduated in 50 divisions Therefore, Least count =
  • 13. EXPERIMENT NO. 3 S.B. POLYTECHNIC, SAVLI M & I (3341905) Prepared By Mr. Vipul Hingu Page 1A (Fig, 3.1) Outside Micrometer
  • 14. EXPERIMENT NO. 3 S.B. POLYTECHNIC, SAVLI M & I (3341905) Prepared By Mr. Vipul Hingu Page 2 of 3 = = 0.01 mm Reading Outside & Inside Micrometer Formulae for calculating total reading with the help of Outside & Inside Micrometer is Calculation Total Reading = (Linear Scale Reading) + (Least Count of Outside/Inside Micrometer) X (Circular scale division exactly coinciding with any main scale division) = 23.00 + ( 0.01 X 15 ) = 23.00 + ( 0.15 ) = 23.00 mm Formula & Calculation Total Reading = (Linear Scale Reading) + (Least Count of Outside/Inside Micrometer) X (Circular scale division exactly coinciding with any main scale division) = ____ + ( ____ X ____ ) = ____ + ( ____ ) = ____mm
  • 15. EXPERIMENT NO. 3 S.B. POLYTECHNIC, SAVLI M & I (3341905) Prepared By Mr. Vipul Hingu Page 2A (Fig, 3.2) Inside Micrometer)
  • 16. EXPERIMENT NO. 3 S.B. POLYTECHNIC, SAVLI M & I (3341905) Prepared By Mr. Vipul Hingu Page 3 of 3 Drawing of the Job Readings Table No Linear scale reading (A) No of Circular scale division in coincidence Circular scale division X Least count (B) Total Reading (A + B) Length Outer Dia. Inner Dia. Applications Outside/Inside Micrometer is extensively used in the engineering for measuring external and internal diameters, lengths, thickness, depth and other dimensions. Conclusion Now we've got to use this Outside/Inside Micrometer.
  • 17. EXPERIMENT NO. 4 S.B. POLYTECHNIC, SAVLI M & I (3341905) Prepared By Mr. Vipul Hingu Page 1 of 1 EXPERIMENT NO. 4 AIM: → Linear Measurement – Telescopic Gauge To Study and Use of Telescopic Gauge Objective  To understand the constructional parts of Telescopic Gauge.  How to take measurement with the help of Telescopic Gauge? Apparatus Required  Telescopic Gauge,  Vernier Caliper OR Outside Micrometer,  Work piece. Telescopic Gauges The telescopic gauge is used for measuring internal diameter of holes, slots and grooves etc. It consists of a handle with two rods in a tube at one end and a working screw at the other end. The rods having spherical contacts can slide within a tube and are forced apart by an internal spring. The locking screw can lock the rods at any desired position through a spring. While taking measurements, the rods are pressed closer and inserted into the hole to be measured. The rods then open out to touch the metal surface, of the hole on both sides. They are then locked in position by means of a locking screw. The telescopic gauge is then taken out from the hole. The dimension across the tips is measured by micrometer or Vernier Caliper. (Fig, 4.1) Telescopic Gauge Applications Telescopic Gauge is extensively used in the engineering for measuring internal diameters, Width of slot. Conclusion Now we've got to use this Telescopic Gauge.
  • 18. EXPERIMENT NO. 5 S.B. POLYTECHNIC, SAVLI M & I (3341905) Prepared By Mr. Vipul Hingu Page 1 of 4 EXPERIMENT NO. 5 AIM: → Angular Measurement - Bevel protector To measure the angle in the given work piece using Bevel Protractor. Objective  To understand the constructional parts of Bevel Protractor.  How to calculate least count of Bevel Protractor?  How to take measure Angle with the help of Bevel Protractor? Apparatus Required  Bevel Protractor,  Work piece. Procedure 1) Clean the Bevel protractor with the fine cotton cloth. 2) The work piece whose angle to be measured is placed between the stock and the blade. 3) Note down the main scale reading and Vernier scale coincidence. 4) Tabulate the readings. Least count The smallest value that can be measured by the instrument is known as its least count. There are two methods to find the least count of Vernier Caliper. 1. First Method  Minimum angle on Main Scale = 1O.  No. of Division on Vernier Scale = 12 Therefore, Least Count = Minimum angle on Main Scale No.of Division on Vernier Scale = 10 12 = 60′ 12 = 5’ (Minutes) 2. Second Method On Vernier Scale 12 Division = On Main Scale 23 Division Therefore, On Vernier Scale 12 Division = 230 (Because, On Main Scale 1 Division = 10)
  • 19. EXPERIMENT NO. 5 S.B. POLYTECHNIC, SAVLI M & I (3341905) Prepared By Mr. Vipul Hingu Page 1A (Fig, 5.1) Mechanical Bevel Protector (Fig, 5.2) Optical Bevel Protector
  • 20. EXPERIMENT NO. 5 S.B. POLYTECHNIC, SAVLI M & I (3341905) Prepared By Mr. Vipul Hingu Page 2 of 4 Therefore, On Vernier Scale 1 Division = 230 12 Therefore, On Vernier Scale 1 Division = 1 110 12 Therefore, On Vernier Scale 1 Division = 230 12 Therefore, Minimum Difference between this two Scales = 20 - 1 110 12 (Because, On Vernier Scale Minimum Value of Angle is greaterthan 10) = 10 12 = 60′ 12 = 5’ (Minutes) Reading a Bevel Protractor Formulae for calculating Angle with the help of Bevel Protractor is Total Reading = (Main Scale Reading) + (Least Count of B.P. X Vernier division exactly coincides with main scale division) = 650 + 5’ X 3 = 650 15’ Formula & Calculation Total Reading = (Main Scale Reading) + (Least Count of B.P. X Vernier division exactly coincides with main scale division) = ____ + (____ X ____) = ______
  • 21. EXPERIMENT NO. 5 S.B. POLYTECHNIC, SAVLI M & I (3341905) Prepared By Mr. Vipul Hingu Page 2A (Fig, 5.3) Measurement of angles using bevel protractor (a) Acute angle Attachment (b) Inside bevelled face angle measurement (Fig, 5.4) Angles and their supplements (a) Blade oriented with base (b) Blade turned clockwise (c) Blade turned counter clockwise
  • 22. EXPERIMENT NO. 5 S.B. POLYTECHNIC, SAVLI M & I (3341905) Prepared By Mr. Vipul Hingu Page 3 of 4 Drawing of the Job
  • 23. EXPERIMENT NO. 5 S.B. POLYTECHNIC, SAVLI M & I (3341905) Prepared By Mr. Vipul Hingu Page 4 of 4 Readings Table Work Piece 1 Sr. No Main scale reading (A) No of Vernier scale division in coincidence Vernier scale division X Least count (B) Total Reading (A + B) 1 2 3 AVERAGE Work Piece 2 Sr. No Main scale reading (A) No of Vernier scale division in coincidence Vernier scale division X Least count (B) Total Reading (A + B) 1 2 3 AVERAGE Applications Bevel Protector is extensively used in the engineering for measuring external and internal Angles from 00 to 3600 with an accuracy of 5’ (Minutes). Conclusion All the way we have discussed the Construction of Bevel Protractor, and its working principle, and taking an angular measurement with the Bevel protractor.
  • 24. EXPERIMENT NO. 6 S.B. POLYTECHNIC, SAVLI M & I (3341905) Prepared By Mr. Vipul Hingu Page 1 of 2 EXPERIMENT NO. 6 AIM: → Angular Measurement - Sine Bar To measure the taper angle of the given specimen using Sine Bar Method. Objective  To understand the constructional parts of Sine Bar.  How to calculate least count of Sine Bar?  How to take measure Angle with the help of Sine Bar? Apparatus Required  Sine Bar,  Surface Plate,  Work piece. Procedure 1) The given component is placed on the surface plate. 2) One roller of sine bar is placed on surface plate and bottom surface of sine bar is seated on the taper surface of the component. 3) The combination of slip gauges is inserted between the second roller of sine bar and the surface plate. 4) The angle of the component is then calculated by the formula given above. Formulae for Calculating Angle with the help of Sine Bar is Formula & Calculation sin 𝜃 = H L Where, H - Height of the slip gauge L - Distance between the centres θ - Inclined angle of the specimen
  • 25. EXPERIMENT NO. 6 S.B. POLYTECHNIC, SAVLI M & I (3341905) Prepared By Mr. Vipul Hingu Page 1A (Fig, 6.1) Working of Sine Bar (Fig, 6.2) Working of Sine Bar
  • 26. EXPERIMENT NO. 6 S.B. POLYTECHNIC, SAVLI M & I (3341905) Prepared By Mr. Vipul Hingu Page 2 of 2 Drawing of the Job Readings Table Work Piece Sr. No Length of the sine bar (L) “mm” Height of the combination of slip gauge (H) “mm” Taper Angle (θ) in ‘degree’ 1 2 Applications  Measuring known angles or locating any work to a given angle.  Checking of Unknown angles.  Checking of unknown angles of heavy components.  Inspection of a conical objects (Having male and female centers) between centers.) Result Thus the angle in the work pieces were Determined using Sine bar  Angle measured in work piece ,1 = ______ ‘degree’  Angle measured in work piece ,2 = ______ ‘degree’
  • 27. EXPERIMENT NO. 7 S.B. POLYTECHNIC, SAVLI M & I (3341905) Prepared By Mr. Vipul Hingu Page 1 of 2 EXPERIMENT NO. 7 AIM: → To Study Straightness Testing To Study method is use for measuring and checking straightness. To Study Measurement of Straightness using Autocollimators Method. Definition Straightness: Linear uniformity of work surface measured from an external reference line is called straightness Objective  To Study Measurement of Straightness using Autocollimators Method.  To Study Limitation of Autocollimators Method using Measurement of Straightness. Different types of Methods use for Straightness Testing  Wedge Method  Straight-edge Method,  Light-gape and filler Gauge Method,  Autocollimators Method,  Precision Level Method. Procedure In this method autocollimator and slip gauge with reflected stand is used. The method is explained in following steps. 1) A straight line is drawn on work surface and divide into equal parts. Length of each part is equal to “l”, which is the distance the feet of reflector stand. 2) As Shown in Fig. No. – 7.1, reflector stands is kept on the equally divided parts, one by one and reading of angular deviation is taken with autocollimator. 3) These reading are converted into mm. with conversion factor and rise and fall of points on work surface are found out with reference to datum line. 4) The reading as achieved above are represented in the form of graph as shown in Fig. No. – 7.2 5) Now to bring the end point ‘H’ of the work surface profile at zero position like point A or H’ calculation as per Table No. 7.1 need to be done. After this calculation, new graph is drawn as in Fig. No. 7.3 and straightness error is found out.
  • 28. EXPERIMENT NO. 7 S.B. POLYTECHNIC, SAVLI M & I (3341905) Prepared By Mr. Vipul Hingu Page 1A (Fig, 7.1) (Fig, 7.2) Work Surface Profile (Fig, 7.3) Graph of Work Surface
  • 29. EXPERIMENT NO. 7 S.B. POLYTECHNIC, SAVLI M & I (3341905) Prepared By Mr. Vipul Hingu Page 2 of 2 Calculation Position Mean reading of spirit level or autocollimator (sec) Difference from 1st reading (sec) Rise of fall for interval length (l) (mm) Cumulative rise of fall (mm) Adjustment to bring both ends to zero (mm) Error from straight-line (mm) 1 2 3 4 5 6 7 a - - - 0 0 0 a-b θ1 0 0 0 -L/n -L/n b-c θ2 θ2 − θ1 (θ2 − θ1) l (θ2 − θ1) l -2L/n (θ2 − θ1) l - 2L/ns c-d θ3 θ3 − θ1 (θ2 − θ1) l (θ2 − θ1) l + (θ3 − θ1) l -3L/n (θ2 − θ1) l + (θ3 − θ1) l -3L/n - - - - - - - - - - - - - - - - - - - - - h-i θn θn − θ1 θn − θ1 ∑ (θn − θ1) l = L -L 0 With this method straightness of horizontal, vertical or inclined surface can be checked with accuracy of 0.5”. Limitations of this method  Electricity is required.  The method is tedious and cumbersome.  Errors in autocollimator affect accuracy of testing. Conclusion With this method straightness of horizontal, vertical or inclined surface can be checked
  • 30. EXPERIMENT NO. 8 S.B. POLYTECHNIC, SAVLI M & I (3341905) Prepared By Mr. Vipul Hingu Page 1 of 2 EXPERIMENT NO. 8 AIM: → To Study Flatness Testing To Study method is use for measuring and checking flatness. To Study Measurement of Flatness using Optical Flat Method. Definition Flatness: Flatness is defined as the minimum distance between two parallel planes which cover all the irregularities of the surface under examination. Objective  To Study Measurement of Flatness using Optical Flat Method.  To Study Limitation of Optical Flat Method using Measuring and Checking flatness. Different types of Methods use for Flatness Testing  High Spot Method  Liquid Wedge Method,  Optical Flat Method,  Precision Spirit Level Method,  Autocollimator Method. Procedure The instruments used in this method are optical flat, slip gauges, standard flat, base plate and monochromatic light source. The method is explained in following steps. 1) As Shown Fig. No. 8.1 slip gauges are fixed on base plate after wringing and monochromatic light rays thrown on the same 2) A mirror angle is created at wage shape gap between slip gauge and optical flat. Even though both of them are thoroughly cleaned the gap is created due to dust particles between them. 3) Now on observing optical flat different interference fringe patterns can be observed as shown in Fig. No. 8.2. This pattern is a map of contour of the surface of slip gauges observed through optical flat. Details of flatness can be known from fringe patterns. 4) Fig. No. 8.3 indicates different fringe patterns. Patterns (a) & (c) indicates flat surface, (b) indicated spherical surface (Concave or Convex), (d) indicates saddle shape surface and (e) indicates cylindrical surface.
  • 31. EXPERIMENT NO. 8 S.B. POLYTECHNIC, SAVLI M & I (3341905) Prepared By Mr. Vipul Hingu Page 1A (Fig, 8.1) Checking Flatness using optical flat (Fig, 8.2) Fringe patterns seen through optical flat
  • 32. EXPERIMENT NO. 8 S.B. POLYTECHNIC, SAVLI M & I (3341905) Prepared By Mr. Vipul Hingu Page 2 of 2 Applications  Optical flats are used for testing the measuring surfaces of instruments like micrometres, measuring anvils & similar other devices for their flatness & parallelism.  These are used to calibrate the standard gauges, like slip gauges, angle gauges & secondary gauges in the workshops.  In measuring the curvatures like convex and concave for surface of the standard gauges. Limitations of this method  Need of Electric supply.  Human error causes variations in the results.  Flatness of only smaller surface can be checked.  Exact value of flatness cannot be obtained. Conclusion With the help of this method flatness of slip gauges and other polished surfaces by lapping process can be checked.
  • 33. EXPERIMENT NO. 9 S.B. POLYTECHNIC, SAVLI M & I (3341905) Prepared By Mr. Vipul Hingu Page 1 of 2 EXPERIMENT NO. 9 AIM: → To Study Squareness, Perpendicularity And Parallity To Study methods are used for testing Squareness. To Study Testing of Squareness using Dial Indicator Method. Definition Squareness: Two planes, two straight lines or a straight line and a plane are said to be perpendicular when the error of parallelism in relation in relation to a standard square does not exceed a given value. Objective  To Study Testing of Squareness using Dial Indicator Method.  To Study Limitation of Dial Indicator Method using Squareness Testing. Different types of Methods use for Squareness Testing  Dial Indicator Method,  Autocollimator Method Procedure The instruments used in this method are surface plate, dial indicator, standard square block/ work piece and Squareness tester. The method is explained in following steps. 1) As Shown Fig. No. 9.1 standards square block is kept on the surface plate and the Squareness tester is kept in such a manner that its knife edge touches the surface AB of the block. 2) Now, the plunger of the dial indicator attached on the tester is allowed to touch the surface AB and reading is taken. 3) Similarly other surface of the square block BC, CD and DA are brought in contact with knife edge of the tester and reading in taken. 4) If the two surfaces AB and CD are parallel to each other, then in both the conditions same reading will be indicated. But if both the reading are different then they will indicate either higher or lower than 900 in both the conditions. Thus the difference between both the reading will be double of the Squareness error of length “l”.
  • 34. EXPERIMENT NO. 9 S.B. POLYTECHNIC, SAVLI M & I (3341905) Prepared By Mr. Vipul Hingu Page 1A (Fig. 9.1) Dial Indicator Method
  • 35. EXPERIMENT NO. 9 S.B. POLYTECHNIC, SAVLI M & I (3341905) Prepared By Mr. Vipul Hingu Page 2 of 2 Limitations of this method  If vertical surface of the Squareness tester is not exactly perpendicular to the surface plate then error comes in the reading.  If axis of dial indicator and knife edge are not parallel then errors comes in the reading. Conclusion With this method Squareness of standard square block or other work piece of same shape can be checked with the accuracy 0.01 or 0.001 mm.
  • 36. EXPERIMENT NO. 10 S.B. POLYTECHNIC, SAVLI M & I (3341905) Prepared By Mr. Vipul Hingu Page 1 of 2 EXPERIMENT NO. 10 AIM: → To Study Roundness, Cylindricity, Concentricity, Run Out and Ovality To Study methods are used for testing Roundness. To Study Testing of Roundness using V-Block and Dial Indicator Method. Definition Roundness: Roundness is defined as the radial uniformity of the surface of the circular part from its central line. Objective  To Study Testing of Roundness using V-Block and Dial Indicator Method.  To Study Limitation of V-Block and Dial Indicator Method using Roundness Testing. Circularity Error As Shown in Fig. No. 9.1 the radial distance of the profit between minimum circumscribing circle and maximum inscribing circle measured at perpendicular to the axis of the circle is called circularity error. (Fig. 10.1) Circularity or Roundness Irregularities in a Circle Components OR Circular movements a) Ovality: If two axis of a circular part which are perpendicular to each other (major and minor axis) are not equal then this kind of error in called as Ovality as shown in Fig. No. 9.2. b) Lobbing: When distance between exactly opposite points on all the surface of circular work piece is measure with micrometre and it appears same at different points even though the work piece may not be circular, then this is called Lobbing error as shown in Fig. No. 9.3. c) Non Uniform Shape: When profit of the circular work piece surface is totally irregular as shown in Fig. No. 9.4 then this kind of error is called of non-uniformity. (D = D1 = D2 = D3)
  • 37. EXPERIMENT NO. 10 S.B. POLYTECHNIC, SAVLI M & I (3341905 Prepared By Mr. Vipul Hingu Page 1A (Fig. 10.2) Ovality (Fig. 10.3) Lobbing (Fig. 10.4) Non-Uniformity (Fig. 10.5) Checking Roundness by Dial Indicator
  • 38. EXPERIMENT NO. 10 S.B. POLYTECHNIC, SAVLI M & I (3341905) Prepared By Mr. Vipul Hingu Page 2 of 2 Different types of Methods use for Roundness Testing  Micrometre Method,  V-Block and Dial Indicator Method,  Bench Centre and Dial Indicator Method Procedure The instruments used in this method are surface plate, dial indicator with stand and V-Block. The method is explained in following steps. 1) Adjust V-Block and dial indicator withstand on surface plate as shown in Fig. No. 9.5. 2) Now mark 12 equal division on work piece and arranged the same on V-Block. Set Dial indicator on any one part with zero reading. 3) Rotate work piece at 3600 and obtain reading of dial indicator at each part. 4) Draw the polar graph of each reading and find out the roundness. Application  This method is used to check roundness of different circular jobs such as shaft, spindle, plunger etc. with the accuracy as per indicator such as 0.01, 0.001 mm. Limitations of this method  The method is tedious.  When higher points touching the V-block and lower points are below the plunger of dial indicator as well as when higher points are blow the plunger and lower points are touching V-Block at that time indicator provides same reading and therefore error cannot be detected. Conclusion With this method Roundness of circular jobs such as shaft, spindle, plunger etc. or other work piece of same shape can be tested.
  • 39. EXPERIMENT NO. 11 S.B. POLYTECHNIC, SAVLI M & I (3341905) Prepared By Mr. Vipul Hingu Page 1 of 3 EXPERIMENT NO. 11 AIM: → To Study about Measurement of Surface Roughness. To Study methods are used for Measurement of Surface Roughness. To Study Measurement of Surface Roughness using Taylor Hobson Telysurf Method. Surface Roughness They are series of regularly repeated deviations in the form of a wave, with a ratio of pitch to height. These deviations are produce, by the trace of an edged cutting tool and plastic flow of the metal during machining. They are fine irregularities in the surface texture and are termed as surface roughness. To describe the surface roughness, the height of the irregularities is measured in microns whereas its width is measured in mm. If the surface is too rough, the initial, wear particles are larger which acts as abrasives and wear continues at high rate. If the surface is too smooth the initial wear will be very slow. The factors affecting surface roughness are:  Type of coolant used  Cutting parameters such as feed, speed and depth of cut  Type of machining  Rigidity of the system, consisting of machine tool, fixture, cutting tool and work  Vibrations  Material of tool and work piece Analysis of surface traces A numerical assessment of surface finish can be carried out in a number of ways. These numerical values are obtained with respect to a datum. In practice, the following three methods of evaluating primary texture (roughness) of a surface are used: a) Peak to valley height method b) The average roughness c) Form factor or bearing curve Methods of Measuring Surface Finish There are two methods used for measuring the finish of machined part: 1) Surface Inspection of Comparison Methods 2) Direct Instrument Measurements In comparative methods, the surface texture is assessed by observation of the surface. But these methods are not reliable as they can be misleading if comparison is not made with surfaces produced by same techniques. The various methods available under comparison method are:
  • 40. EXPERIMENT NO. 11 S.B. POLYTECHNIC, SAVLI M & I (3341905 Prepared By Mr. Vipul Hingu Page 1A (Fig. 11.1) (Fig. 11.2) (Fig. 11.4) Representation of Surface Roughness
  • 41. EXPERIMENT NO. 11 S.B. POLYTECHNIC, SAVLI M & I (3341905) Prepared By Mr. Vipul Hingu Page 2 of 3  Touch Inspection  Visual Inspection  Scratch Inspection  Microscopic Inspection  Surface Photographs  Micro-Interferometer  Wallace Surface  Dynamometer  Reflected Light Intensity Conventional method for designing surface finish Ovality a) L Stylus Probe Instruments b) Profilometer c) Tomlinson Surface Recorder d) The Taylor- Hobson Telysurf e) Replica Method The Taylor- Hobson Telysurf Method: Principle: The variation in the surface profile is sensed by the probe, which is attached to the armature. The gap between the armature and E-shaped arm varies according to the surface profile and due to this amplitude of the ac current flowing in the coil is modulated. Construction and working: Fig. No. 11.3 shows the various units of the Telysurf, which operates on electrical principles. The measuring head is fitted with the probe and the skid. The motion of the measuring head is given by a Gear Box, which has a motor. This unit can be moved up and down over the guide ways by a hand wheel provided at the top and a lead screw. The diamond probe has a radius of about 2 μm and the gearbox can give a max travel of 12 mm to it. The work piece is mounted on a stand, which is mounted on a table. The averaging meter and a pen recorder are provided for obtaining a graphical record on a continuous graph paper. The arm carrying the stylus forms an armature, which is pivoted on the centrepiece of E-shaped arm as shown in Figure 6.7. On two legs of E-shaped arm there are coils carrying an A.C. current.
  • 42. EXPERIMENT NO. 11 S.B. POLYTECHNIC, SAVLI M & I (3341905 Prepared By Mr. Vipul Hingu Page 2A (Fig. 11.3) Taylor- Hobson Telysurf Method (Fig. 11.5) Basic Symbol
  • 43. EXPERIMENT NO. 11 S.B. POLYTECHNIC, SAVLI M & I (3341905) Prepared By Mr. Vipul Hingu Page 3 of 3 Advantages:  Accurate reading can be obtained.  Magnification to the tune of 500 to 1, 00,000 can be obtained in eight steps.  Surface texture data can be obtained faster.  CLA value of the roughness and permanents profile of the same can be obtained.  Suitable for quality control during production. Representation of Surface Roughness As per IS: 696 surface texture specified by indicating the following / main characteristics in the symbols: 1) 2) Machining allowance in mm. 3) Sampling length or instrument cut-off length in mm. 4) Machining/production method, and 5) (e) Direction of lay in the symbol form as = X, M, C, R The surface is represented as shown in the Fig.6.8. If the machining method is milling, sampling length is 3mm. Direction of lay is perpendicular to the surface, machining allowance is 1mm and the representation will be as shown in Figure No. 11.4 and 11.5. Conclusion With this method Roughness of different jobs can be Measurement.
  • 44. EXPERIMENT NO. 12 S.B. POLYTECHNIC, SAVLI M & I (3341905) Prepared By Mr. Vipul Hingu Page 1 of 2 EXPERIMENT NO. 12 AIM: → To Study about Gear Measurement. To Study methods are used for Gear Measurement. To Study Measurement of Gear using Chordal Thickness Method. Different Types of Gear 1) Spur Gear (Show Fig. No. 12.1) 2) Helical Gear (Show Fig. No. 12.2) 3) Bevel Gear (Show Fig. No. 12.3) 4) Worm and Worm Gear (Show Fig. No. 12.4) 5) Rack and Pinion (Show Fig. No. 12.5) Terminology of Gear Tooth We will understand different terminology of gear tooth with the help of Fig. No. 12.6 Methods of Measurement of Gear Tooth Thickness As we know gear tooth thickness is an arc and hence its direct measurement is not possible. It is generally measured on pitch circle and that is why also called as pitch line thickness. Following two methods are in use for measuring gear tooth thickness. 1) Chordal Thickness 2) Constant Chord Chordal Thickness Tooth thickness is not same from its top to its base circle. Therefore its thickness is checked on its pitch points. Tooth thickness at its pitch points is called Chordal Thickness. This is the distance between both the flanks of a tooth on pitch point as shown in Fig. No. 12.7. For measuring gear tooth vernier calliper is used. Gear tooth vernier calliper is having two vernier scale perpendiculars to each other. Vertical scale is set at “d” reading as calculated from following equation: d = 𝑁𝑚 2 [1 + 2 𝑁 – cos ( 𝑁𝑚 2 ) ] Where N = Number of teeth and m = module With this setting gear tooth calliper is adjusted on gear tooth as shown in Fig. No. 12.7. This will ensure auxiliary slide to touch on top of the teeth in such a manner that jaws of the horizontal scale touch the tooth on pitch points. Thus horizontal scale will provide chordal thickness (W) of the tooth. This actual measurement is compared with theoretical value of chordal thickness as obtained from the following equation and by this way any error in the thickness can be know: W = N m sin ( 90 𝑁 )
  • 45. EXPERIMENT NO. 12 S.B. POLYTECHNIC, SAVLI M & I (3341905 Prepared By Mr. Vipul Hingu Page 1A (Fig. 12.1) – Spur Gear (Fig. 12.2) – Helical Gear (Fig. 12.3) – Bevel Gear (Fig. 12.4) Worm and Worm Wheel
  • 46. EXPERIMENT NO. 12 S.B. POLYTECHNIC, SAVLI M & I (3341905) Prepared By Mr. Vipul Hingu Page 2 of 2 Limitations of this Method Since this method is dependent on number of teeth, even though module is same, separate calculation is required for different gears having different number of teeth. Conclusion With this method gear tooth thickness of different gear can be Measure.
  • 47. EXPERIMENT NO. 12 S.B. POLYTECHNIC, SAVLI M & I (3341905 Prepared By Mr. Vipul Hingu Page 2A (Fig. 12.5) Rack and Pinion (Fig. 12.6) Terminology of Gear Tooth (Fig. 12.7) Gear Tooth Vernier Calliper
  • 48. EXPERIMENT NO. 13 S.B. POLYTECHNIC, SAVLI M & I (3341905) Prepared By Mr. Vipul Hingu Page 1 of 2 EXPERIMENT NO. 13 AIM: → To Study about Thread Measurement. To Study methods are used for Thread Measurement. To Study Measurement of Effective Diameter of External Thread. Different Terminology Related with Screw 1) Terminology of External Thread (Show Fig. No. 13.1) 2) Terminology of Internal Thread (Show Fig. No. 13.2) 1) Screw Thread : It is a continuous helical groove of a specified cross section cut on the external or internal surface of cylinder or cone. 2) Pitch : It is the distance measured from a point on a thread to a corresponding point on adjacent thread, measured parallel to the thread axis. 3) Crest : It is the uppermost surface joining two sides of the thread. 4) Root : It is the bottom most part of a groove formed by joining two adjacent side of the thread. 5) Flank : It is the straight surface joining crest and root of the thread. It is the contact surface when external and internal thread are joined. 6) Lead : It is the axis distance travelled by screw in one complete revolution. 7) Depth of Cut : It is the distance between crest and root of the thread measured in perpendicular direction to the thread axis. 8) Thread Angle : In is the angle between two flanks in the plane of the thread axis. 9) Flank Angle : It is the angle between flank and a line perpendicular to thread axis. 10) Lead Angle : It is the angle between helix of a straight thread and line perpendicular to thread axis on pitch line. 11) Helix Angle : It is the angle between helix of a straight thread with thread axis on pitch line. 12) Major Diameter : It is the diameter of an imaginary coaxial cylinder witch is touching the crest of external thread or roots of internal thread. It is also called as external diameter or crest diameter or outside diameter or full diameter in case of external thread. 13) Minor Diameter : It is a diameter of an imaginary coaxial cylinder which is touching roots of external thread or crest of internal thread. It is also called as core diameter or root diameter.
  • 49. EXPERIMENT NO. 13 S.B. POLYTECHNIC, SAVLI M & I (3341905 Prepared By Mr. Vipul Hingu Page 1A (Fig. 13.1) – External Thread (Fig. 13.2) – Internal Thread
  • 50. EXPERIMENT NO. 13 S.B. POLYTECHNIC, SAVLI M & I (3341905) Prepared By Mr. Vipul Hingu Page 2 of 2 Elements of Thread Measurements 1) Major Diameter 2) Minor Diameter 3) Effective Diameter 4) Pitch 5) Flank Angle 6) Crest and root profile 7) Concentricity of different diameter Measurement of Effective Diameter Following different methods are in use for measurement of effective diameter of external thread. (A) One Wire Method As shown in Figure No. 13.3 one wire is kept in the thread and measurement is taken with the help of micrometre. First of all measurement of standard gauge diameter is taken which is equal to effective diameter of the thread. This is d1. Thereafter wire is kept in the thread and measurement is taken, which is d2. Effective Diameter = D ± (d1 - d2) Where, D = Size of setting gauge If d2 > d1 then +ve sign and If d2 < d1 then -ve sign. (B) Two Wire Method In this method as shown in Figure No. 13.4 two equal diameter standard setting wires (best wire size wires) are kept in the threads so that they touches the flanks of the threads. Micrometre reading ‘M’ on these wires are taken and effective diameter of the screw thread can be found out from the following equation. E = M – 3d + 0.866p Where, E = Effective Diameter M = Micrometre reading on wire d = Best wire size p =Pitch (C) Three Wire Method This method provides more accurate results compared to two wire methods because while keeping three best size wires in place of two, micrometre reading is obtain in the perpendicular direction to thread axis. As shown in Figure No. 13.5 three wires are arranged in the thread and micrometre reading ‘M’ is taken. Now with the help of following equation effective diameter can be obtained. E = M – 3d + 0.866p Where, E = Effective Diameter M = Micrometre reading on wire d = Best wire size p =Pitch
  • 51. EXPERIMENT NO. 13 S.B. POLYTECHNIC, SAVLI M & I (3341905 Prepared By Mr. Vipul Hingu Page 2A (Fig. 13.3) One Wire Method (Fig. 13.4) Two Wire Method (Fig. 13.5) Three Wire Method
  • 52. EXPERIMENT NO. 14 S.B. POLYTECHNIC, SAVLI M & I (3341905) Prepared By Mr. Vipul Hingu Page 1 of 2 EXPERIMENT NO. 14 AIM: → To Study about Limit Gauges. To Study uses of Different types of Limit Gauges. . Definitions of Gauge and Gauging Gauge: Gauge is an inspection tool used to check product dimension with reference to its maximum and minimum acceptable limits. It is generally used to segregate acceptable and non-acceptable products in mass production, without knowing exact value of dimensions. Gauging: It is the process of checking whether the product is within its specified higher and lower limits, without knowing its actual measurement. Advantages of Limit Gauges 1) Faster checking regarding whether product within its specified limits or not can be done. 2) Less dependence on operator skill and hence results are not getting affected by operator judgment. 3) Gauges are economical than measuring instruments. 4) More than one dimension of product can be checked at a time as well as properties such as roundness, taper etc. also can be checked at a time. Limitations of Limit Gauges 1) Exact value of product dimension cannot be known. 2) Accuracy of gauge is getting affected due to wear and tear with passage of time. 3) It is useful only for smaller products because it is difficult to manufacture and maintain large size gauges. Precautions to be observed while using Limit Gauges 1) Go and not Go members of the gauge should be used properly during gauging. 2) Proper matching of gauge with product surface should be checked through feeling of touch. 3) Accuracy of gauges should be checked periodically since is getting affected by wear and tear. 4) To prevent atmospheric effect grease and plastic coating should be applied on the gauges and kept in a tight box when not in use.
  • 53. EXPERIMENT NO. 14 S.B. POLYTECHNIC, SAVLI M & I (3341905 Prepared By Mr. Vipul Hingu Page 1A (Fig. 14.1(a) (Fig. 14.1(b) Double Ended Plug Gauge Progressive Plug Gauge (Fig. 14.1(c) – Single Ended Plug Gauge (Fig. 14.1(d) – Flat Type Plug Gauge (Fig. 14.2(a) – Adjustable Gap Gauge (Fig. 14.2(b) – Double Ended Snap Gauge (Fig. 14.2(c) – Progressive type Snap Gauge
  • 54. EXPERIMENT NO. 14 S.B. POLYTECHNIC, SAVLI M & I (3341905 Prepared By Mr. Vipul Hingu Page 2A (Fig. 14.3(a) – Radius Gauge (Fig. 14.3(b) – Filer Gauge (Fig. 14.3(c) – Template Gauge (Fig. 14.3(d) – Taper Plug Gauge
  • 55. EXPERIMENT NO. 14 S.B. POLYTECHNIC, SAVLI M & I (3341905) Prepared By Mr. Vipul Hingu Page 2 of 2 Classification of Gauges According to type / use 1) Standard Gauge 2) Limit Gauge According to application 1) Work shop Gauge 2) Inspection Gauge 3) Master / Reference Gauge According to from 1) Plug Gauge (Fig. No. 14.1(a), (b), (c), (d) ) 2) Snap and Wring Gauge (Fig. No. 14.2(a), (b), (c) ) According to design / Construction 1) Fixed limit Gauge 2) Indicating Gauge 3) Combination Gauge According to specific application 1) Screw pitch Gauge 2) Template / Form Gauge (Fig. No. 14.3(c) ) 3) Radius Gauge (Fig. No. 14.3(a) ) 4) Filer Gauge (Fig. No. 14.3(b) ) 5) Taper Gauge (Fig. No. 14.3(d) ) Use of Various Gauges Apart from that some specific applications will be briefly explained in this section. 1) Pin Gauge As Shown in Fig. No. 14.4 Pin Gauge is used to check bore of large size hole. 2) Receiving Gauge These gauges are used to speedily check certain specific shape of the product such as shaft having square or rectangular cross section, splined shaft etc. Fig. No. 14.5 shows receiving gauges. 3) Length Gauge Length gauges are used to check length of the component as shown in Fig. No. 14.6 4) Combined Gauge This gauge is used to check large size holes. Here go and no-go members are provided at one side of the same gauge body. Gauge is inserted in the hole to check go dimension and then tilted to check no-go dimension. This is shown in Fig. No. 14.7 5) Angle Gauge To check angle of a product in mass production special kind of angle gauges are prepared. One such angle gauge is shown in Fig. No. 14.8 6) Position Gauge These gauges are used to check position of one surface of the work-piece with reference to another surface as shown in Fig. No. 14.9 (a) & (b)
  • 56. EXPERIMENT NO. 14 S.B. POLYTECHNIC, SAVLI M & I (3341905 Prepared By Mr. Vipul Hingu Page 3A (Fig. 14.4) – Pin Gauge (Fig. 14.5) – Receiving Gauge (Fig. 14.6) (Fig. 14.7) (Fig. 14.8) Length Gauge Combined Gauge Angle Gauge (Fig. 14.9(a) & (b) – Position Gauge
  • 57. EXPERIMENT NO. 15 S.B. POLYTECHNIC, SAVLI M & I (3341905) Prepared By Mr. Vipul Hingu Page 1 of 2 EXPERIMENT NO. 15 AIM: → To Study about Non-Destructive Testing-NDT. To Study Ultrasonic Test. Principle Ultrasonic sound waves (frequency more than 20,000 cycles / second) are produced by piezo-electric effect and transmitted to the component under testing and reflection of the same are received and converted into electronic single which can be analysed. Procedure  As shown in Fig No. 15.1 ultrasonic sound waves are transmitted to the component by transmitter probe.  The waves are produced with the help of quartz crystal, which is a piezo-electric material which converts electrical energy in to mechanical energy as well as mechanical energy in to electrical energy.  When electric pulse is passed in the probe containing quarts crystal, during first half cycle the crystal contracts and during remaining half cycle it expands producing mechanical vibration, that is, sound waves.  In case if there is no defect in component the sound wave will travel through entire cross section thickness of the component and then reflects back as an echo.  This echo wave is received by another probe (receiver probe) and the crystal inside the probe vibrates and converts mechanical energy in to electrical energy, which is converted in to wave form and observed on CRT screen.  If defects are there, then sound waves will reflect back from the same and a wave form will appear between first echo and back echo as shown in Fig No. 15.1  With Suitable calibration on CRT screen distance of the defect from the probing surface (depth of the defect) can be known.  Many times instead of two different probes single probe is used which can perform the operation of transmission as well as receipt of sound waves Advantages 1) Components having thickness to the tune of 10 meter can be tested. 2) Defects can be located more accurately than other NDT methods. 3) Speedy and reliable technique. 4) Instrument can work on rechargeable battery and hence can be carried to different inspection locations. 5) The method in economical for mass production.
  • 58. EXPERIMENT NO. 15 S.B. POLYTECHNIC, SAVLI M & I (3341905 Prepared By Mr. Vipul Hingu Page 1A (Fig. 15.1) - Ultrasonic Testing
  • 59. EXPERIMENT NO. 15 S.B. POLYTECHNIC, SAVLI M & I (3341905) Prepared By Mr. Vipul Hingu Page 2 of 2 Limitations 1) Surface of the component should be smooth and machined before test. 2) Complex contour create difficulties in testing. 3) Training is required for testing inspector. 4) Skilled and experienced inspectors are necessary. Application  This test I widely used for engineering products.  Generally it can detect up to 10 meters thickness of the component.  It is mainly used for all types of steels.  This test creates some difficulty in coarse grained structure such as cast iron.
  • 60. EXPERIMENT NO. 16 S.B. POLYTECHNIC, SAVLI M & I (3341905) Prepared By Mr. Vipul Hingu Page 1 of 2 EXPERIMENT NO. 16 AIM: → To Study about Temperature Measurement. To Study about Thermocouple. Principle As shown in Fig. No. 16.1 when the two dissimilar metals are joined together to form a closed loop circuit, two junctions are formed. When one of the junction is heated the current flow in the circuit, which can be measured with the galvanometer. The polarity and magnitude of the current depends on the properties of the metals and the junction temperature difference. Construction and Working The measuring junction of the thermocouple is kept in a protective metal sheath and head assembly. The measuring junction is connected with the voltmeter and reference junction with the help of extension wire. This extension wire is also known as compensating lead. The properties of the compensating lead. The properties of the compensating leads must be same as that of the thermocouple but should have low resistance and must be cheaper. When the thermocouple is heated, EMF is produced which is measured by the voltmeter connected to it. As the voltmeter is calibrated for temperature. It shows the temperature of the measuring junction. Temperature Compensation The EMF produced by the thermocouple is proportional to the temperature differences between the cold and hot junction. As the ambient temperature changes, the temperature of the cold junction also varies and it results in the variations in the EMF produced by the thermocouple and results in the measurement error. This error can be reduced or eliminated by using Wheatstone bridge circuit. This arrangement is called as cold junction compensation. Advantages 1) Rugged construction 2) Faster measurement 3) Easy in operation 4) High accuracy 5) Remote indication is possible
  • 61. EXPERIMENT NO. 16 S.B. POLYTECHNIC, SAVLI M & I (3341905 Prepared By Mr. Vipul Hingu Page 1A (Fig. 16.1) – Thermo electric effect in Thermocouple (Fig. 16.2) – Components of Thermocouple
  • 62. EXPERIMENT NO. 16 S.B. POLYTECHNIC, SAVLI M & I (3341905) Prepared By Mr. Vipul Hingu Page 2 of 2 Disadvantages 1) Span of the measurement is only 33% of maximum temperature to be measure. 2) Temperature of the reference junction must is constant throughout the measurement or the temperature compensation devices should be used. 3) Amplifiers are required in some applications. 4) Expensive accessories are required for control applications. Application  To measure temperature of furnace in industries.  To measure temperature below zero 0C.  Average temperature of the different points can be measured by using more than one thermocouples in parallel.  For differential temperature measurement.  One thermocouple can be connected with two reading instruments.
  • 63. EXPERIMENT NO. 17 S.B. POLYTECHNIC, SAVLI M & I (3341905) Prepared By Mr. Vipul Hingu Page 1 of 2 EXPERIMENT NO. 17 AIM: → To Study about Pressure Measurement. To Study about Bourdon Tube Pressure Gauge. Principle When an elastic transducer (bourdon tube in this case) is subjected to a pressure, it defects. This deflection is proportional to the applied pressure when calibrated. Description The main parts of this instruments are as follows: An elastic transducer, which is bourdon tube which is fixed and open at one end to receive the pressure which is to be measured. The other end of the bourdon tube is free and closed. The cross-section of the bourdon tube is eliptical. The bourdon tube is in a bent form to look like a circular arc. To the free end of the bourdon tube is attached an adjustable link, which is in turn connected to a sector and pinion as shown in diagram. To the shaft of the pinion is connected a pointer which sweeps over a pressure calibrated scale. Operation of Bourdon tube The pressure to be measured is connected to the fixed open end of the bourdon tube. The applied pressure acts on the inner walls of the bourdon tube. Due to the applied pressure, the bourdon tube tends to change in cross – section from ellipitcal to circular. This tends to straighten the bourdon tube causing a displacement of the free end of the bourdon tube. This displacement of the free closed end of the bourdon tube is proportional to the applied pressure. As the free end of the bourdon tube is connected to a link – section – pinion arrangement, the displacement is amplified and converted to a rotary motion of the pinion. As the pinion rotates, it makes the pointer to assume a new position on a pressure calibrated scale to indicate the applied pressure directly. As the pressure in the case containing the bourdon tube is usually atmospheric, the pointer indicates gauge pressure. Advantages 1) These Bourdon tube pressure gauges give accurate results. 2) Bourdon tube cost low. 3) Bourdon tube are simple in construction. 4) They can be modified to give electrical outputs. 5) They are safe even for high pressure measurement. 6) Accuracy is high especially at high pressures.
  • 64. EXPERIMENT NO. 17 S.B. POLYTECHNIC, SAVLI M & I (3341905 Prepared By Mr. Vipul Hingu Page 1A (Fig. 17.1) – Bourdon Tube Pressure Gauge
  • 65. EXPERIMENT NO. 17 S.B. POLYTECHNIC, SAVLI M & I (3341905) Prepared By Mr. Vipul Hingu Page 2 of 2 Disadvantages 1) They respond slowly to changes in pressure 2) They are subjected to hysteresis. 3) They are sensitive to shocks and vibrations. 4) Ampilification is a must as the displacement of the free end of the bourdon tube is low. 5) It cannot be used for precision measurement. Application  They are used to measure medium to very high pressures.
  • 66. EXPERIMENT NO. 18 S.B. POLYTECHNIC, SAVLI M & I (3341905) Prepared By Mr. Vipul Hingu Page 1 of 2 EXPERIMENT NO. 18 AIM: → To Study about Flow Measurement. To Study about Venturi Meter. Principle The working of venturi meter is based on the principle of Bernoulli’s equation. Bernoulli’s Statement: It states that in a steady, ideal flow of an incompressible fluid, the total energy at any point of the fluid is constant. The total energy consists of pressure energy, kinetic energy and potential energy or datum energy. Mathematically Here all the energies are taken per unit weight of the fluid. The Bernoulli’s equation for the fluid passing through the section 1 and 2 are given by Construction The construction of venturimeter is shown below: It has three main parts 1) Short converging part: It is a tapered portion whose radius decreases as we move forward. 2) Throat: It is middle portion of the venturi. Here the velocity of the fluid increases and pressure decreases. It possesses the least cross section area. 3) Diverging part: In this portion the fluid diverges. Fig No. 18.1 shows the schematic diagram. A U-tube manometer is used to measure pressure head difference “h” between inlet and throat as shown. By using following expression flow rate can be calculated.
  • 67. EXPERIMENT NO. 18 S.B. POLYTECHNIC, SAVLI M & I (3341905 Prepared By Mr. Vipul Hingu Page 1A (Fig. 18.1) – Venturi MEter
  • 68. EXPERIMENT NO. 18 S.B. POLYTECHNIC, SAVLI M & I (3341905) Prepared By Mr. Vipul Hingu Page 2 of 2 Working The venturimeter is used to measure the rate of flow of a fluid flowing through the pipes. Let’s understand how it does this measurement step by step.  Here we have considered two cross section, first at the inlet and the second one is at the throat. The difference in the pressure heads of these two sections is used to calculate the rate of flow through venturimeter.  As the water enters at the inlet section i.e. in the converging part it converges and reaches to the throat.  The throat has the uniform cross section area and least cross section area in the venturimeter. As the water enters in the throat its velocity gets increases and due to increase in the velocity the pressure drops to the minimum.  Now there is a pressure difference of the fluid at the two sections. At the section 1(i.e. at the inlet) the pressure of the fluid is maximum and the velocity is minimum. And at the section 2 (at the throat) the velocity of the fluid is maximum and the pressure is minimum.  The pressure difference at the two section can be seen in the manometer attached at both the section.  This pressure difference is used to calculate the rate flow of a fluid flowing through a pipe. Applications 1) Flow rate of low pressure, high flow rate pipelines of large size. 2) Process fluid, 3) Waste materials, 4) Gas, 5) Dirty liquid, 6) Liquid containing solid particles. Advantages 1) Less pressure drop, 2) Used for large flow rate, 3) The divergent part helps to lower the permanent pressure loss. Disadvantages 1) Occupies more apace 2) Not suitable for pipe diameter less than 76.2 mm 3) Costly.