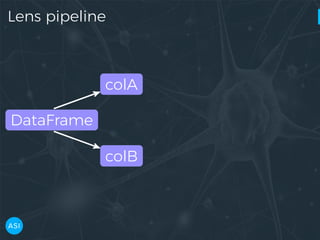
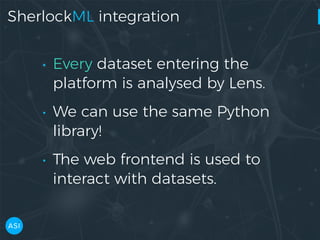
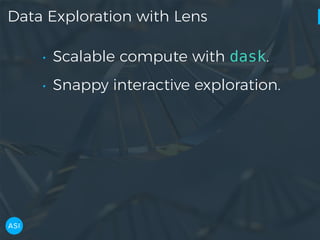
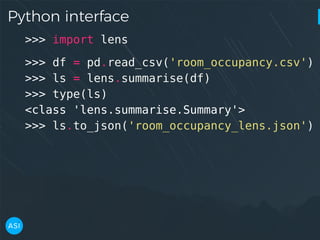
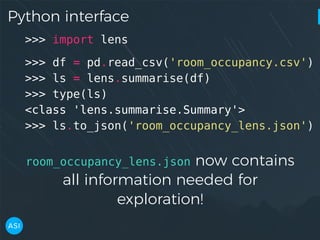
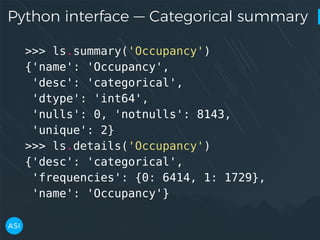
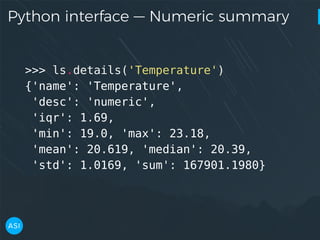
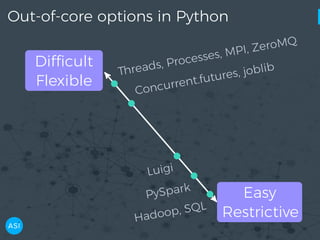
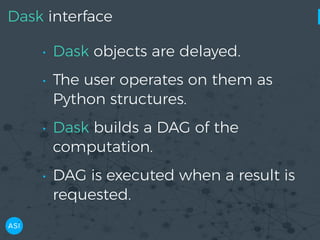
The document discusses the use of Dask for automated data exploration in data science projects, focusing on building analysis pipelines that efficiently handle large datasets. It introduces 'lens', a Python library designed for summarizing and exploring datasets, utilizing Jupyter widgets for interactive visualization. The approach enhances data quality assessment and exploration, making it more accessible and scalable for data scientists.


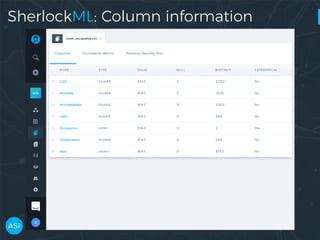
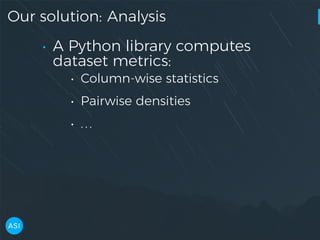
![Python interface — Columns
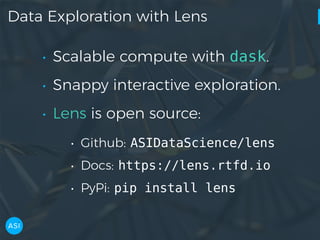
>>> ls.columns
['date',
'Temperature',
'Humidity',
'Light',
'CO2',
'HumidityRatio',
'Occupancy']](https://image.slidesharecdn.com/victorz-171028233225/85/AUTOMATED-DATA-EXPLORATION-Building-efficient-analysis-pipelines-with-Dask-18-320.jpg)


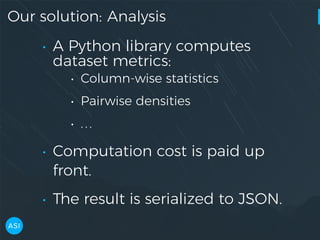


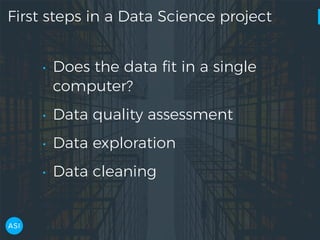
![dask.delayed — Build you own DAG
files = ['myfile.a.data',
'myfile.b.data',
'myfile.c.data']
loaded = [load(i) for i in files]
cleaned = [clean(i) for i in loaded]
analyzed = analyze(cleaned)
store(analyzed)](https://image.slidesharecdn.com/victorz-171028233225/85/AUTOMATED-DATA-EXPLORATION-Building-efficient-analysis-pipelines-with-Dask-49-320.jpg)
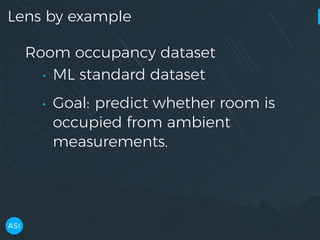
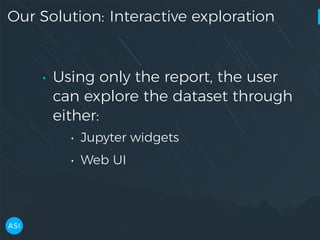
![dask.delayed — Build you own DAG
files = ['myfile.a.data', 'myfile.b.data',
'myfile.c.data']
loaded = [load(i) for i in files]
cleaned = [clean(i) for i in loaded]
analyzed = analyze(cleaned)
stored = store(analyzed)](https://image.slidesharecdn.com/victorz-171028233225/85/AUTOMATED-DATA-EXPLORATION-Building-efficient-analysis-pipelines-with-Dask-51-320.jpg)
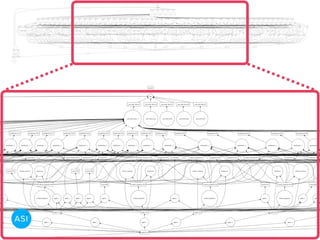
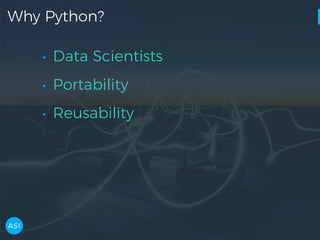
![dask.delayed — Build you own DAG
files = ['myfile.a.data', 'myfile.b.data',
'myfile.c.data']
loaded = [load(i) for i in files]
cleaned = [clean(i) for i in loaded]
analyzed = analyze(cleaned)
stored = store(analyzed)
clean-2
analyze
cleanload-2
analyze store
clean-3
clean-1
load
storecleanload-1
cleanload-3load
load](https://image.slidesharecdn.com/victorz-171028233225/85/AUTOMATED-DATA-EXPLORATION-Building-efficient-analysis-pipelines-with-Dask-52-320.jpg)
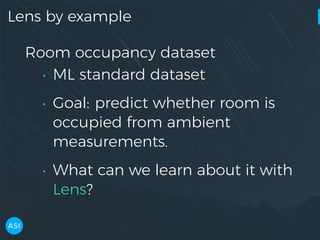
![dask.delayed — Build you own DAG
files = ['myfile.a.data', 'myfile.b.data',
'myfile.c.data']
loaded = [load(i) for i in files]
cleaned = [clean(i) for i in loaded]
analyzed = analyze(cleaned)
stored = store(analyzed)
clean-2
analyze
cleanload-2
analyze store
clean-3
clean-1
load
storecleanload-1
cleanload-3load
load
stored.compute()](https://image.slidesharecdn.com/victorz-171028233225/85/AUTOMATED-DATA-EXPLORATION-Building-efficient-analysis-pipelines-with-Dask-53-320.jpg)