The Ten Facts About People With Autism Presentation
15 logs
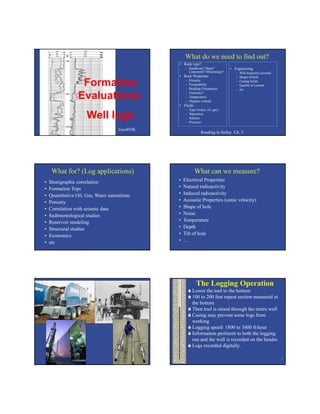
1. Formation
Evaluations:
Well logs
Geo493K
What do we need to find out?
• Rock type?
– Sandstone? Shale?
Limestone? Mineralogy?
• Rock Properties
– Porosity
– Permeability
– Bedding Orientation
– Fractures?
– Temperature
– Organic content
• Fluids
– Type (water, oil, gas)
– Saturation
– Salinity
– Pressure
• Engineering
– Well trajectory (coord)
– Shape of hole
– Casing Joints
– Quality of cement
– etc
Reading in Selley Ch. 3
What for? (Log applications)
• Stratigraphic correlation
• Formation Tops
• Quantitative Oil, Gas, Water saturations
• Porosity
• Correlation with seismic data
• Sedimentological studies
• Reservoir modeling
• Structural studies
• Economics
• etc
What can we measure?
• Electrical Properties
• Natural radioactivity
• Induced radioactivity
• Acoustic Properties (sonic velocity)
• Shape of hole
• Noise
• Temperature
• Depth
• Tilt of hole
• …
The Logging Operation
Lower the tool to the bottom
100 to 200 feet repeat section measured at
the bottom
Then tool is raised through the entire well
Casing may prevent some logs from
working
Logging speed: 1800 to 3600 ft/hour
Information pertinent to both the logging
run and the well is recorded on the header.
Logs recorded digitally.
6
2. Title
Services Associated
With Data on Log
Basic Information
Company, Well Name
Location
API Number
Permit Number
Other Services
During Same Trip
Detailed Location &
Elevation Information
KB Kelly Bushing
DF Derrick Floor
GL Ground Level
Wellbore Environment
Depth, Diameter,
Temperature,
Mud Parameters
Equipment & Personnel
Logging Engineer &
Witnesses
8
Log Types
• Lithologic Logs
– Spontaneous Potential (SP)
– Gamma Ray (GR)
• Porosity Logs
– Neutron
– Density
– Sonic
• Resistivity Logs (Fluid Type)
– Resistivity
– Induction
• Other
– Dipmeter
– Caliper
– Temperature
– Acoustic
– FMI
– Many more …
Spontaneous Potential (SP)
• One of the Oldest Logging Measurements
– Used Commercially in 1931
• Discovered as Noise in Resistivity
• Found to be Related to Presence of Sandstone
• Lithology tool
Surface
Down hole
The well works like
a battery
E = -K log (aw/amf)
E is in millivolts
aw= water salinity
amf= mud salinity
Ion flow is easier in
permeable
sandstones
3. Typical SP log SP has Poor
Limestone
Response
Limestones
Spontaneous
Potential (SP)
Drift
SP readings are
depth-dependent
Gamma Ray Log
• Lithology log
• Measures natural radioactivity
• Uses a scintilometer (Geiger counter)
• Potassium (K), Uranium (U), Thorium (Th),
Phosphorous (P)
• K → abundant in clay → shales
• Unaffected by fluids
• High U → reducing environ. → abundant
organic matter
• “API units”, relative to a standard
SP and
Gamma Ray
•Gamma Ray in API
Units
•Plotted on the left of
the well
•Shales swing right
Marcellus Gamma Ray
Pimpinella 1
MegaEnergy Op. Inc.
Green = low GR
Purple = high GR
Onondaga Limestone
Lower Marcellus
Mahantango Fm.
4. Spectral Gamma Ray
Distinguishes the different sources of gamma rays
Clay
content
Organic
content
Resistivity Log Applications
• Determination of Hydrocarbon-Bearing vs.
Water-Bearing Zones
• Water Saturation Sw
• Geopressure Detection
• Depth of Invasion
• Stratigraphic Correlation
The Borehole Environment
R= resistivity
(ohms)
Resistivity
Resistivity of Saline Water - Rw
Resistivity of Water and Formation
Resistivity of Water, Hydrocarbons,
and Formation
Resistivity of Tight Formation
(no porosity)
IncreasingResistivity
Resistivity Tool Background
• Three Classes
– Electrode Logs
– Laterologs
• Focused Electrodes
– Induction
• Measure Resistivity in Ohms
Normal Resistivity Tool
Spacing of electrodes determines penetration
5. Guard or Laterolog Tool
The guard electrodes focus the current in a narrow
disk
Induction (Conductivity) Tool
Receiver coil measures the induced electrical field
created in the rocks by the transmitter coil
Works with oil based mud, or air
Log Presentation and Scales
ID, IM, LL8 measure
resistivity at different
distances form the
borehole.
ID= deep induction
IM= medium induction
LL8= shallow induction
Log Scale
Ohms
Resistivity logs :
spherically-
focussed (SFL),
medium
induction (ILM),
and
deep induction
(ILD)
Is there oil in
these reservoirs?
Uninvaded zone
Flushed zone
Gas zone (50 )
Water zone (2-20
Model Resistivity
Logs Calculating Water Saturation
(Rxo/Rt)5/8
Sw=
(Rmf/Rw)
Rxo= Resistivity of flushed zone
Rw= Resistivity of formation water
Rmf= Resistivity of mud filtrate
Rt= Resistivity of uninvaded zone
6. Wellbore Environment
Depth, Diameter,
Temperature,
Mud Parameters
Mud
Resistivity
Data
Resistivity Imaging Logs
32
FMI =
Formation
Micro Imaging
Resolution vs. Investigation
33
Sonic Logs
Measures of interval travel time in formation
∆t (sec/ft) = 1/V
• ∆t is related to Density which depends on:
Lithology, Porosity, and Fluid Content
• Used to generate Synthetic Seismic traces
to link wells logs to seismic data
Source-receiver
arrangement for a
sonic logging tool
Glover
36
Rock matrix
Pore fluid
Log meas.
Porosity
7. Sonic Log
Example
Slow Fast
Which unit is the
best reservoir
(low shale and
high porosity)?
Well KGS Brungardt #1
Ellis Co., Kansas
Acoustic impedance
from Sonic log
Seismic
Reflectivity
Wavelet
Synthetic
Seismic
Creating synthetic seismic data:
Convolution
Sonic Log
Correlate seismic data (in time) to well data (in depth) Density Log
• Tool emits gamma rays
• Detects returning scattered gamma rays
• Gamma ray absorption is proportional to rock
density
• Measures Density - ρ
• Tied to Lithology, Porosity, and Fluid Content
Density Log
DPHI= % Porosity
RHOB= Bulk Density
g/cm3
Porosity Calculation
8. Neutron Log (CNL)
• Tool has a neutron source
• H absorbs neutrons and emits gamma rays
• Tool detects the emitted gamma rays
• H is mostly in formation fluids (water and
hydrocarbons)
• Can be run through casing
• Reads low in gas zones
• Cannot distinguish oil from water
Porosity
calibration
• If lithology is
known,
neutron and
density logs
can be
calibrated for
porosity
Density
Porosity
Neutron
Cross over
indicates gas
Photoelectric
Log
PEF= photoelectric index
Applications of logs
• Stratigraphic studies
– Sedimentary facies
• Well correlation
• Reservoir models
• Structural interpretation
– Fault recognition
Gamma Ray Response to Grain Size
48
9. Relating log character to sedimentary facies Building a reservoir
model model
1. Define
facies in core
2. Relate
facies to log
3. Predict facies in wells
without core, but with good logs
4. Fill the gaps between wells
28 cores
1600 wells
108 Million Cells
Log Datum Terminology
• KB - Kelly Bushing elevation.
• MD - Measured Depth along the wellbore
from the Kelly bushing (usually)
• SS – Subsea Depth (Relative to Sealevel)
• TVD – True Vertical Depth, (important for
non-vertical wells)
• SSTVD - Sub-Sea True Vertical Depth
Correlation
Example
Major Sands
on SP
DIRECTIONAL DRILLING
Correlation of directional wells
Vertical WellDirectional Well
10. MWD (or LoggingWD)
Measurement While Drilling
Tools are part of bottom hole assembly (BHA).
Gamma ray, directional survey, tool face,
borehole pressure, temperature, vibration, shock,
torque etc.
Telemetry for steering well
Results transmitted digitally
mud pulser telemetry
55
Logging While Drilling
Data Transmission
Mud Pulse Telemetry (Pressure pulses)
Electromagnetic Telemetry (Using conductivity of
drill pipe)
Wired Drill Pipe (The future. Faster and better, but
delicate)
Geosteering Full Logs in Horizontal wells
How do you move the logging tools through the
horizontal well?
•
FMI and Dipmeter Logs
FMI= Formation Micro Imager
Resistivity tools Dipmeter
Dipmeter Interpretation
Vertical dip
variation is
characteristic of the
structure
Older, simpler
version of FMI
11. Take Home Ideas
• Well logs provide key data for understanding the
subsurface
• Lithology, porosity and fluids are 3 important
log families
• Usually you can’t measure these properties
directly, so you must use proxies or indirect
measurements
• Multiple logs used in combination are most
powerful