
Recommended
Recommended
More Related Content
What's hot
What's hot (20)
Similar to Rebgv stats-pkg-august-2019
Similar to Rebgv stats-pkg-august-2019 (20)
More from Vicky Aulakh
More from Vicky Aulakh (20)
Recently uploaded
Recently uploaded (20)
Rebgv stats-pkg-august-2019
- 1. News Release FOR IMMEDIATE RELEASE: Metro Vancouver housing market sees summer uptick in sales VANCOUVER, BC – September 4, 2019 – Home buyer activity increased to more typical levels in Metro Vancouver* throughout the summer months. The Real Estate Board of Greater Vancouver (REBGV) reports that residential home sales in the region totalled 2,231 in August 2019, a 15.7 per cent increase from the 1,929 sales recorded in August 2018, and a 12.7 per cent decrease from the 2,557 homes sold in July 2019. Last month’s sales were 9.2 per cent below the 10-year August sales average. “Home sales returned to more historically normal levels in July and August compared to what we saw in the first six months of the year,” said REBGV President Ashley Smith. There were 3,747 detached, attached and apartment properties newly listed for sale on the Multiple Listing Service® (MLS®) in Metro Vancouver in August 2019. This represents a 3.5 per cent decrease compared to the 3,881 homes listed in August 2018 and an 18.8 per cent decrease compared to July 2019 when 4,613 homes were listed. The total number of homes currently listed for sale on the MLS® system in Metro Vancouver is 13,396, a 13.3 per cent increase compared to August 2018 (11,824) and a 5.9 per cent decrease compared to July 2019 (14,240). For all property types, the sales-to-active listings ratio for August 2019 is 16.7 per cent. By property type, the ratio is 12 per cent for detached homes, 18.4 per cent for townhomes, and 21.2 per cent for apartments. Generally, analysts say downward pressure on home prices occurs when the ratio dips below 12 per cent for a sustained period, while home prices often experience upward pressure when it surpasses 20 per cent over several months. “With more demand from home buyers, the supply of homes listed for sale isn’t accumulating like earlier in the year. These changes are creating more balanced market conditions,” Smith said. The MLS® Home Price Index composite benchmark price for all residential properties in Metro Vancouver is currently $993,300. This represents an 8.3 per cent decrease over August 2018 and a 0.2 per cent decrease compared to July 2019.
- 2. Sales of detached homes in August 2019 reached 706, a 24.5 per cent increase from the 567 detached sales recorded in August 2018. The benchmark price for detached homes is $1,406,700. This represents a 9.8 per cent decrease from August 2018 and a 0.7 per cent decrease compared to July 2019. Sales of apartment homes reached 1,116 in August 2019, an 8.9 per cent increase compared to the 1,025 sales in August 2018. The benchmark price of an apartment property is $771,000. This represents a 7.4 per cent decrease from August 2018 and a 0.1 per cent increase compared to July 2019. Attached home sales in August 2019 totalled 409, a 21.4 per cent increase compared to the 337 sales in August 2018. The benchmark price of an attached unit is $654,000. This represents a 7.8 per cent decrease from August 2018, a 0.2 per cent increase compared to July 2019. -30- *Editor’s Note: Areas covered by the Real Estate Board of Greater Vancouver include Burnaby, Coquitlam, Maple Ridge, New Westminster, North Vancouver, Pitt Meadows, Port Coquitlam, Port Moody, Richmond, South Delta, Squamish, Sunshine Coast, Vancouver, West Vancouver, and Whistler. The real estate industry is a key economic driver in British Columbia. In 2018, 24,619 homes changed ownership in the Board’s area, generating $1.7 billion in economic spin-off activity and an estimated 11,720 jobs. The total dollar value of residential sales transacted through the MLS® system in Greater Vancouver totalled $26 billion in 2018. The Real Estate Board of Greater Vancouver is an association representing more than 14,000 REALTORS® and their companies. The Board provides a variety of member services, including the Multiple Listing Service®. For more information on real estate, statistics, and buying or selling a home, contact a local REALTOR® or visit www.rebgv.org. For more information please contact: Craig Munn Manager, Communication Real Estate Board of Greater Vancouver 604.730.3146 cmunn@rebgv.org
- 3. Property Type Area Benchmark Price Price Index 1 Month Change % 3 Month Change % 6 Month Change % 1 Year Change % 3 Year Change % 5 Year Change % 10 Year Change % Residential / Composite Lower Mainland $942,200 259.3 -0.2% -1.2% -1.4% -7.3% 9.3% 61.1% 88.6% Greater Vancouver $993,300 258.4 -0.2% -1.3% -2.4% -8.3% 4.6% 54.2% 85.1% Bowen Island $954,800 207.0 0.4% -1.1% -3.6% -3.0% 19.7% 62.1% 61.0% Burnaby East $915,800 254.0 -1.5% -2.6% -3.6% -9.7% 3.8% 52.6% 82.9% Burnaby North $862,400 260.4 -0.8% -2.0% -0.2% -7.7% 9.1% 58.6% 87.5% Burnaby South $939,300 265.3 -0.6% -3.4% -5.4% -9.5% 7.3% 56.2% 90.5% Coquitlam $892,400 264.7 0.2% -0.2% -2.4% -8.8% 12.1% 67.1% 100.1% Ladner $782,200 220.2 -1.3% -2.7% -3.3% -10.6% -5.7% 43.1% 64.3% Maple Ridge $751,200 239.2 -0.2% -1.3% 0.6% -6.2% 21.0% 74.9% 84.7% New Westminster $636,900 280.2 -1.5% -3.5% -1.9% -8.7% 21.7% 70.3% 96.8% North Vancouver $1,027,000 230.8 -0.1% -1.1% -0.9% -7.7% -1.3% 48.7% 73.7% Pitt Meadows $739,400 268.8 -0.3% -0.1% -1.3% -6.7% 26.7% 82.0% 99.6% Port Coquitlam $728,900 249.5 -1.3% -2.3% -3.6% -7.8% 14.4% 67.4% 83.5% Port Moody $904,500 250.0 -1.0% -0.1% 0.9% -6.6% 16.7% 67.0% 91.1% Richmond $904,100 268.8 0.1% -1.8% -3.5% -9.4% 2.9% 53.7% 88.2% Squamish $782,300 248.9 2.6% 2.3% 4.0% 1.0% 22.2% 83.6% 99.0% Sunshine Coast $590,000 206.7 -1.9% -2.6% -3.1% -5.1% 23.6% 64.0% 59.6% Tsawwassen $921,600 231.0 -0.8% -0.5% -3.8% -8.5% -5.1% 49.6% 72.8% Vancouver East $1,033,400 303.4 -0.1% -1.9% -3.5% -9.3% 0.9% 55.0% 101.2% Vancouver West $1,226,200 255.5 0.3% -0.5% -3.8% -9.3% -3.6% 41.1% 76.2% West Vancouver $2,094,400 230.6 -1.4% 1.2% -2.9% -11.5% -22.8% 26.2% 77.5% Whistler $920,000 214.4 3.0% 3.5% 4.7% 1.9% 31.3% 83.6% 73.0% Single Family Detached Lower Mainland $1,212,000 257.0 -0.6% -1.0% -1.6% -7.9% -4.3% 51.3% 91.6% Greater Vancouver $1,406,700 258.8 -0.7% -1.1% -2.6% -9.8% -11.0% 42.2% 88.4% Bowen Island $954,800 207.0 0.4% -1.1% -3.6% -3.0% 19.7% 62.1% 61.0% Burnaby East $1,165,800 260.7 -1.4% 0.3% -0.5% -8.1% -7.5% 50.4% 89.5% Burnaby North $1,375,500 266.0 0.2% -2.3% -1.8% -8.4% -13.9% 40.6% 91.0% Burnaby South $1,467,900 281.0 -0.6% -2.7% -4.8% -9.4% -13.7% 43.6% 103.9% Coquitlam $1,157,100 256.8 -1.0% -0.6% -2.2% -11.4% -5.9% 52.5% 94.8% Ladner $938,800 226.3 -0.8% -3.5% 0.6% -7.1% -9.0% 47.4% 73.1% Maple Ridge $818,200 233.1 -0.6% -0.6% 1.4% -6.0% 14.8% 72.0% 85.9% New Westminster $1,033,400 257.8 -1.2% -1.3% -2.4% -8.7% -5.8% 49.9% 85.9% North Vancouver $1,475,200 232.3 -0.9% -2.2% -1.7% -9.0% -13.4% 43.0% 77.2% Pitt Meadows $891,400 251.2 -1.0% 1.2% -0.5% -5.3% 13.7% 72.4% 91.0% Port Coquitlam $908,400 242.2 -1.2% -1.5% -2.1% -9.9% -0.4% 55.2% 83.5% Port Moody $1,420,900 262.4 -1.5% 1.1% 1.2% -7.1% 2.1% 57.8% 99.7% Richmond $1,458,800 282.6 -1.1% -3.0% -5.7% -12.6% -16.7% 41.1% 93.8% Squamish $996,100 262.5 1.5% 5.1% 9.6% 5.6% 18.7% 85.0% 104.3% Sunshine Coast $584,600 204.8 -1.9% -2.6% -3.2% -5.4% 23.0% 63.3% 58.1% Tsawwassen $1,162,900 250.4 -0.8% 0.7% -2.4% -7.0% -6.8% 56.3% 89.4% Vancouver East $1,346,500 299.5 -0.5% 0.0% -4.3% -11.4% -12.1% 43.9% 109.9% Vancouver West $2,880,800 295.4 -0.5% -1.6% -5.0% -12.0% -20.2% 26.3% 94.3% West Vancouver $2,520,100 237.9 -1.2% 0.1% -3.7% -11.0% -26.0% 24.0% 84.7% Whistler $1,640,500 228.2 -0.5% 4.1% 13.0% 7.9% 17.8% 67.8% 75.3% HOW TO READ THE TABLE: • Benchmark Price: Estimated sale price of a benchmark property. Benchmarks represent a typical property within each market. • Price Index: Index numbers estimate the percentage change in price on typical and constant quality properties over time. All figures are based on past sales. • x Month/Year Change %: Percentage change of index over a period of x month(s)/year(s) * In January 2005, the indexes are set to 100. Townhome properties are similar to Attached properties, a category that was used in the previous MLSLink HPI, but do not included duplexes. The above info is deemed reliable, but is not guaranteed. All dollar amounts in CDN. August 2019* * MLS®, Multiple Listing Service®, and all related graphics are trademarks of The Canadian Real Estate Association 1 of 15
- 4. Property Type Area Benchmark Price Price Index 1 Month Change % 3 Month Change % 6 Month Change % 1 Year Change % 3 Year Change % 5 Year Change % 10 Year Change % August 2019* Townhouse Lower Mainland $665,800 239.9 0.2% -0.6% -0.1% -6.5% 17.2% 63.6% 78.9% Greater Vancouver $771,900 247.7 0.2% -1.0% -1.1% -7.8% 13.6% 58.6% 81.3% Burnaby East $644,900 238.2 -0.5% -1.8% -6.1% -9.5% 26.8% 51.5% 73.0% Burnaby North $721,500 269.3 -0.2% -1.2% 0.9% -5.8% 22.2% 63.5% 89.0% Burnaby South $767,000 264.2 0.8% -1.9% -5.0% -8.9% 17.8% 58.8% 86.7% Coquitlam $651,800 239.2 -0.2% -2.9% -0.7% -5.6% 19.1% 61.9% 83.2% Ladner $618,300 219.9 -2.0% -1.9% -9.5% -18.3% -1.9% 35.7% 55.1% Maple Ridge $522,800 242.7 -0.2% -4.1% -0.5% -7.7% 24.1% 75.1% 81.7% New Westminster $713,000 261.5 -0.1% -0.3% -5.1% -9.6% 18.3% 56.8% 87.5% North Vancouver $960,200 233.3 1.7% 0.7% 0.4% -6.8% 4.8% 60.1% 76.2% Pitt Meadows $599,300 259.3 0.0% -1.1% -2.7% -10.2% 25.0% 83.6% 96.3% Port Coquitlam $627,600 237.6 -0.7% -2.3% 1.0% -6.0% 12.8% 61.3% 76.8% Port Moody $655,700 221.6 -0.2% 1.8% 2.9% -4.6% 21.8% 55.5% 68.3% Richmond $774,900 254.4 0.5% -0.2% -2.6% -10.2% 6.9% 52.5% 83.4% Squamish $705,900 232.1 2.6% 1.8% 4.0% -5.3% 23.9% 81.6% 92.9% Tsawwassen $597,800 235.3 -2.6% -3.4% -9.2% -17.4% 3.5% 44.4% 65.9% Vancouver East $838,100 268.5 -1.1% -4.1% -4.0% -9.6% 11.7% 47.4% 83.8% Vancouver West $1,115,100 260.7 0.0% -0.1% -0.8% -6.7% 4.2% 53.4% 86.2% Whistler $937,800 226.1 2.4% 6.5% 6.1% -4.1% 33.9% 90.8% 87.9% Apartment Lower Mainland $642,100 270.0 0.0% -1.6% -1.8% -7.1% 28.5% 73.4% 88.5% Greater Vancouver $654,000 261.4 0.1% -1.5% -2.6% -7.4% 21.9% 66.1% 83.2% Burnaby East $700,700 268.8 -2.9% -6.3% -2.5% -10.5% 17.1% 60.2% 82.5% Burnaby North $601,700 256.9 -1.3% -2.2% 0.3% -7.6% 29.7% 73.0% 86.8% Burnaby South $648,500 260.4 -0.8% -4.1% -5.9% -9.6% 21.2% 65.6% 86.5% Coquitlam $524,300 287.7 1.5% 1.4% 0.2% -5.1% 41.4% 94.3% 115.2% Ladner $426,900 202.3 -1.4% -1.2% -4.2% -9.3% 7.4% 36.5% 47.1% Maple Ridge $351,500 251.0 1.1% 0.2% -0.6% -6.1% 41.2% 77.8% 75.0% New Westminster $506,600 287.0 -1.7% -4.3% -1.6% -9.0% 33.2% 78.0% 99.4% North Vancouver $555,800 226.7 0.2% -0.2% -0.6% -7.1% 16.7% 53.8% 67.8% Pitt Meadows $490,300 289.1 0.3% -0.6% -1.4% -7.0% 41.3% 88.2% 101.6% Port Coquitlam $438,400 262.2 -1.7% -2.7% -6.6% -7.1% 34.0% 86.4% 84.5% Port Moody $622,200 259.3 -1.0% -1.3% 0.0% -7.0% 31.1% 83.0% 99.8% Richmond $626,700 268.3 0.7% -1.8% -2.4% -6.6% 33.2% 71.9% 87.2% Squamish $500,900 246.9 4.7% -1.0% -4.3% 1.1% 34.1% 99.6% 100.4% Tsawwassen $455,800 192.2 -0.6% -1.8% -4.4% -8.5% 10.8% 41.8% 39.8% Vancouver East $552,300 315.2 0.3% -3.0% -2.8% -7.5% 18.5% 71.0% 93.0% Vancouver West $756,000 245.3 0.5% -0.3% -3.6% -8.4% 8.4% 52.1% 71.2% West Vancouver $1,062,100 215.8 -2.2% 3.8% -0.3% -11.3% 9.1% 47.9% 62.3% Whistler $503,900 197.4 5.9% 0.8% -0.6% 3.4% 40.4% 95.4% 60.2% HOW TO READ THE TABLE: • Benchmark Price: Estimated sale price of a benchmark property. Benchmarks represent a typical property within each market. • Price Index: Index numbers estimate the percentage change in price on typical and constant quality properties over time. All figures are based on past sales. • x Month/Year Change %: Percentage change of index over a period of x month(s)/year(s) In January 2005, the indexes are set to 100. * Townhome properties are similar to attached properties, a category that was used in the previous MLSLink HPI, but do not included duplexes. Lower Mainland includes areas serviced by both Real Estate Board of Greater Vancouver & Fraser Valley Real Estate Board. The above info is deemed reliable, but is not guaranteed. All dollar amounts in CDN. * MLS®, Multiple Listing Service®, and all related graphics are trademarks of The Canadian Real Estate Association 2 of 15
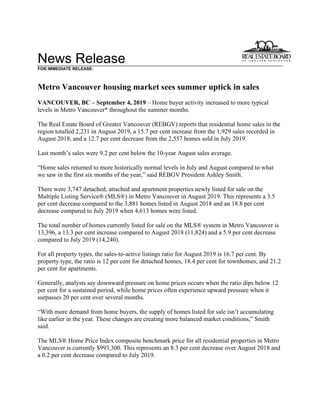
- 5. C:DATAMonthEndHpiexporthi_resgv-hpi2.tifGreaterVancouver 5YearTrend 60 110 160 210 260 310 Aug 2014 Oct 2014 Dec 2014 Feb 2015 Apr 2015 Jun 2015 Aug 2015 Oct 2015 Dec 2015 Feb 2016 Apr 2016 Jun 2016 Aug 2016 Oct 2016 Dec 2016 Feb 2017 Apr 2017 Jun 2017 Aug 2017 Oct 2017 Dec 2017 Feb 2018 Apr 2018 Jun 2018 Aug 2018 Oct 2018 Dec 2018 Feb 2019 Apr 2019 Jun 2019 Aug 2019 Price Index ResidentialDetachedTownhouseApartment Jan2005HPI=100
- 8. Listing & Sales Activity Summary Listings Sales 1 2 3 Col. 2 & 3 5 6 7 Col. 6 & 7 9 10 Col. 9 & 10 Aug Jul Aug Percentage Aug Jul Aug Percentage Jun 2018 - Jun 2019 - Percentage 2018 2019 2019 Variance 2018 2019 2019 Variance Aug 2018 Aug 2019 Variance BURNABY % % % DETACHED 111 132 108 -18.2 40 77 62 -19.5 141 199 41.1 ATTACHED 88 103 105 1.9 37 57 64 12.3 119 173 45.4 APARTMENTS 225 279 298 6.8 119 164 160 -2.4 373 452 21.2 COQUITLAM DETACHED 146 159 144 -9.4 60 86 78 -9.3 170 244 43.5 ATTACHED 69 93 61 -34.4 37 56 39 -30.4 93 127 36.6 APARTMENTS 147 178 137 -23.0 85 94 81 -13.8 243 239 -1.6 DELTA DETACHED 56 81 64 -21.0 29 41 32 -22.0 99 113 14.1 ATTACHED 21 23 22 -4.3 10 16 12 -25.0 30 38 26.7 APARTMENTS 13 24 52 116.7 9 23 19 -17.4 51 60 17.6 MAPLE RIDGE/PITT MEADOWS DETACHED 147 187 130 -30.5 74 100 90 -10.0 231 271 17.3 ATTACHED 76 81 56 -30.9 40 58 44 -24.1 113 146 29.2 APARTMENTS 67 82 51 -37.8 30 42 36 -14.3 112 109 -2.7 NORTH VANCOUVER DETACHED 90 116 92 -20.7 31 76 64 -15.8 162 222 37.0 ATTACHED 44 57 49 -14.0 30 32 32 0.0 91 97 6.6 APARTMENTS 120 189 119 -37.0 70 96 88 -8.3 227 271 19.4 NEW WESTMINSTER DETACHED 30 34 30 -11.8 14 17 14 -17.6 64 57 -10.9 ATTACHED 11 23 15 -34.8 7 9 8 -11.1 23 21 -8.7 APARTMENTS 121 142 115 -19.0 64 95 75 -21.1 251 237 -5.6 PORT MOODY/BELCARRA DETACHED 17 28 29 3.6 5 11 12 9.1 28 34 21.4 ATTACHED 8 21 19 -9.5 6 16 11 -31.3 34 39 14.7 APARTMENTS 30 25 25 0.0 18 29 16 -44.8 66 64 -3.0 PORT COQUITLAM DETACHED 59 47 36 -23.4 18 31 31 0.0 87 89 2.3 ATTACHED 32 42 34 -19.0 18 25 18 -28.0 61 65 6.6 APARTMENTS 54 62 46 -25.8 36 29 30 3.4 116 87 -25.0 RICHMOND DETACHED 202 176 152 -13.6 55 85 67 -21.2 213 242 13.6 ATTACHED 122 148 123 -16.9 57 67 56 -16.4 179 185 3.4 APARTMENTS 244 286 238 -16.8 154 147 127 -13.6 463 392 -15.3 SUNSHINE COAST DETACHED 99 91 74 -18.7 54 63 49 -22.2 159 156 -1.9 ATTACHED 8 12 19 58.3 6 7 6 -14.3 20 18 -10.0 APARTMENTS 11 18 15 -16.7 2 6 5 -16.7 9 16 77.8 SQUAMISH DETACHED 34 31 29 -6.5 22 13 20 53.8 54 50 -7.4 ATTACHED 21 22 18 -18.2 13 12 15 25.0 41 38 -7.3 APARTMENTS 21 16 15 -6.3 16 11 5 -54.5 44 27 -38.6 VANCOUVER EAST DETACHED 172 182 150 -17.6 58 104 73 -29.8 222 262 18.0 ATTACHED 40 72 45 -37.5 22 42 37 -11.9 90 122 35.6 APARTMENTS 181 211 161 -23.7 111 128 124 -3.1 388 339 -12.6 VANCOUVER WEST DETACHED 167 181 126 -30.4 58 79 60 -24.1 196 199 1.5 ATTACHED 94 108 66 -38.9 38 58 49 -15.5 136 148 8.8 APARTMENTS 454 602 444 -26.2 275 352 314 -10.8 896 920 2.7 WHISTLER/PEMBERTON DETACHED 26 33 24 -27.3 12 8 12 50.0 34 28 -17.6 ATTACHED 27 26 36 38.5 12 15 17 13.3 64 45 -29.7 APARTMENTS 27 29 33 13.8 22 14 28 100.0 61 58 -4.9 WEST VANCOUVER/HOWE SOUND DETACHED 107 105 107 1.9 27 43 40 -7.0 92 113 22.8 ATTACHED 7 9 14 55.6 4 3 1 -66.7 16 9 -43.8 APARTMENTS 23 38 14 -63.2 14 13 8 -38.5 44 29 -34.1 GRAND TOTALS DETACHED 1463 1583 1295 -18.2 557 834 704 -15.6 1952 2279 16.8 ATTACHED 668 840 682 -18.8 337 473 409 -13.5 1110 1271 14.5 APARTMENTS 1738 2181 1763 -19.2 1025 1243 1116 -10.2 3344 3300 -1.3