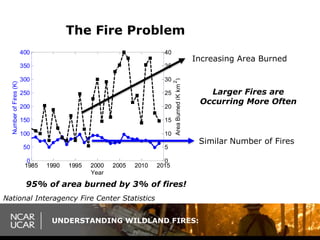
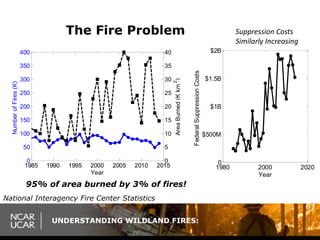
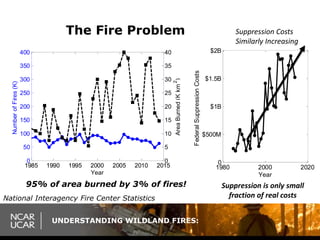
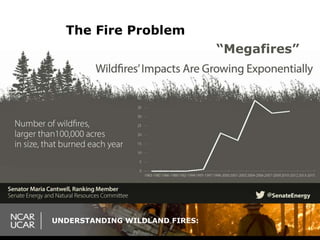
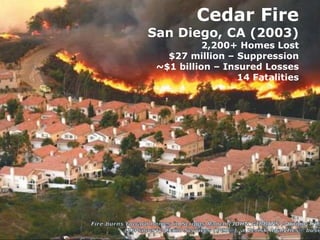
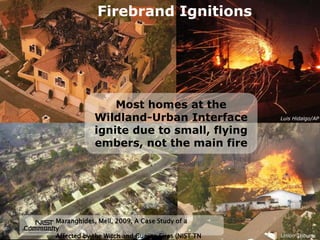
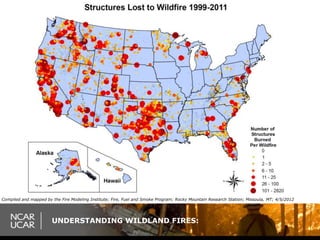
Fire Modeling
Michael J. Gollner
Assistant Professor
Department of Fire Protection Engineering
University of Maryland, College Park
UNDERSTANDING WILDLAND FIRES:
How new research can help fire-management
efforts to protect lives and property
UNDERSTANDING WILDLAND FIRES:
The Fire Problem
1985 1990 1995 2000 2005 2010 2015
0
50
100
150
200
250
300
350
400
NumberofFires(K)
1985 1990 1995 2000 2005 2010 2015
0
5
10
15
20
25
30
35
40
Year
AreaBurned(Kkm
2
)
National Interagency Fire Center Statistics
UNDERSTANDING WILDLAND FIRES:
The Fire Problem
1985 1990 1995 2000 2005 2010 2015
0
50
100
150
200
250
300
350
400
NumberofFires(K)
1985 1990 1995 2000 2005 2010 2015
0
5
10
15
20
25
30
35
40
Year
AreaBurned(Kkm
2
)
Increasing Area Burned
Similar Number of Fires
National Interagency Fire Center Statistics
95% of area burned by 3% of fires!
UNDERSTANDING WILDLAND FIRES:
The Fire Problem
1985 1990 1995 2000 2005 2010 2015
0
50
100
150
200
250
300
350
400
NumberofFires(K)
1985 1990 1995 2000 2005 2010 2015
0
5
10
15
20
25
30
35
40
Year
AreaBurned(Kkm
2
)
Increasing Area Burned
Similar Number of Fires
National Interagency Fire Center Statistics
Larger Fires are
Occurring More Often
95% of area burned by 3% of fires!
UNDERSTANDING WILDLAND FIRES:
The Fire Problem
1985 1990 1995 2000 2005 2010 2015
0
50
100
150
200
250
300
350
400
NumberofFires(K)
1985 1990 1995 2000 2005 2010 2015
0
5
10
15
20
25
30
35
40
Year
AreaBurned(Kkm
2
)
1980 2000 2020
0
$500M
$1B
$1.5B
$2B
FederalSuppressionCosts
Year
Suppression Costs
Similarly Increasing
National Interagency Fire Center Statistics
Suppression is only small
fraction of real costs
95% of area burned by 3% of fires!
UNDERSTANDING WILDLAND FIRES:
The Fire Problem
1985 1990 1995 2000 2005 2010 2015
0
50
100
150
200
250
300
350
400
NumberofFires(K)
1985 1990 1995 2000 2005 2010 2015
0
5
10
15
20
25
30
35
40
Year
AreaBurned(Kkm
2
)
Increasing Area Burned
Similar Number of Fires
National Interagency Fire Center Statistics
Larger Fires are
Occurring More Often
“Megafires”
UNDERSTANDING WILDLAND FIRES:
Cedar Fire
San Diego, CA (2003)
2,200+ Homes Lost
$27 million – Suppression
~$1 billion – Insured Losses
14 Fatalities
UNDERSTANDING WILDLAND FIRES:
Ft. McMurray Fire
Alberta, Canada, 2016
$3.58 billion Insured Damages
~$9.5 billion direct & indirect
1.45 million acres
2,400 buildings destroyed
2 indirect fatalities
CBC News, W. Snowdon, Jan 17, 2017
UNDERSTANDING WILDLAND FIRES:
The Knoxville Mercury
UNDERSTANDING WILDLAND FIRES:
Firebrand Ignitions
Luis Hidalgo/AP
Union Tribune
UNDERSTANDING WILDLAND FIRES:
Firebrand Ignitions
Luis Hidalgo/AP
Union Tribune
Most homes at the
Wildland-Urban Interface
ignite due to small, flying
embers, not the main fire
Maranghides, Mell, 2009, A Case Study of a
Community
Affected by the Witch and Guejito Fires (NIST TN
UNDERSTANDING WILDLAND FIRES:
Compiled and mapped by the Fire Modeling Institute; Fire, Fuel and Smoke Program; Rocky Mountain Research Station; Missoula, MT; 4/5/2012
UNDERSTANDING WILDLAND FIRES:
Hazards
Yarnell Hill, AZ (2013)
19 Firefighter Fatalities
Lack of situational awareness & communication
UNDERSTANDING WILDLAND FIRES:
Fire Models: A critical tool
• Operational Fire Management
• Active Fires
• Fire Danger Rating
• Dispatch Rules
• Evacuations
• Planning
• Risk Analysis
• Fuel Treatment Design
• Management Plans
• Training
• Fire Behavior
• NWCG S-Courses
• Research
• Climate
• Ecology
• Fire Behavior
Prescribed burn - White Mountain
National Forest (USDA FS)
Probability contours and exposure of
resources and assets. Calkin, Finney, et al.
UNDERSTANDING WILDLAND FIRES:
Modeling Fire: The Challenge
• Fire modeling occurs over many scales
UNDERSTANDING WILDLAND FIRES:
Modeling Fire: The Challenge
• Fire modeling occurs over many scales
Flame Dynamics
Home Ignition
Smoke and Emissions
Topography
Wind and WeatherFuels and Ecology
UNDERSTANDING WILDLAND FIRES:
Modeling Fire: The Challenge
• Fire modeling occurs over many scales
• Many disparate communities
– Foresters, Ecologists
– Engineers
– Atmospheric Scientists
– Remote Sensing
UNDERSTANDING WILDLAND FIRES:
Modeling Fire: The Challenge
• Fire modeling occurs over many scales
• Many disparate communities
– Foresters, Ecologists
– Engineers
– Atmospheric Scientists
– Remote Sensing
• Lack of good data
– Most on-the-ground data from smaller,
prescribed burns
– Satellites lack spatial, temporal resolution
UNDERSTANDING WILDLAND FIRES:
Current State of the Art
• Empirically-based Models
– BehavePlus (Rothermel/USFS RMRS Missoula)
– FARSITE (Finney/USFS RMRS Missoula)
– FlamMap (Finney/USFS RMRS Missoula)
– WFDSS (Finney/Calkin) – Incorporating Fire Spread
with Risk Management
UNDERSTANDING WILDLAND FIRES:
Current State of the Art
• Empirically-based Models
– BehavePlus (Rothermel/USFS RMRS Missoula)
– FARSITE (Finney/USFS RMRS Missoula)
– FlamMap (Finney/USFS RMRS Missoula)
– WFDSS (Finney/Calkin) – Incorporating Fire Spread
with Risk Management
• Coupled Atmospheric Models (weather + surface)
– WRF-Fire (Coen/NCAR)
• Incorporate weather with empirical surface model
– FireTEC (Rodd Linn/Los Alamos National Lab)
• Incorporate weather with semi-physical surface model
(slow, research only)
– Fire Dynamics Simulator (Mell/McGrattan –
NIST/USFS)
• CFD with focus on Wildland-Urban Interface
• Mapping
– Fuel Mapping (Landfire, Landsat)
– Satellite Fire Detection (MODIS, VIIRS)
– Airborn IR (NIROPS)
UNDERSTANDING WILDLAND FIRES:
The Future
• Need for a better physical model.
– How do Wildfires Spread?
Missoula Comb Burn
UNDERSTANDING WILDLAND FIRES:
The Future
• Need for a better physical model.
– How do Wildfires Spread?
– Rothermel Spread Equation
• Basis for all US Systems (1960’s)
• Not because it’s right, but because
its’ useful
Texas Prescribed Fire
Crown Fire Experiments
Missoula Comb Burn
ScalingKnowledgeUp
UNDERSTANDING WILDLAND FIRES:
The Future
• Need for a better physical model.
– How do Wildfires Spread?
– Rothermel Spread Equation
• Basis for all US Systems (1960’s
• Not because it’s right, but because
its’ useful
• Data Assimilation
– Filling the gap between models and missing
data
UNDERSTANDING WILDLAND FIRES:
The Future
• Need for a better physical model.
– How do Wildfires Spread?
– Rothermel Spread Equation
• Basis for all US Systems (1960’s
• Not because it’s right, but because
its’ useful
• Data Assimilation
– Filling the gap between models and missing data
• Improved Measurements
– Higher resolution and time response
– Improve understanding and response
– New satellites, UAV’s, larger fires, etc.
NASA’s Ihanka Unmanned Aerial System
Improved Spatial Measurements with VIIRS
(UMD/UCAR)
UNDERSTANDING WILDLAND FIRES:
The Future
• Need for a better physical model.
– How do Wildfires Spread?
– Rothermel Spread Equation
• Basis for all US Systems (1960’s
• Not because it’s right, but because
its’ useful
• Data Assimilation
– Filling the gap between models and missing data
• Improved Measurements
– Higher resolution and time response
– Improve understanding and response
– New satellites, UAV’s, larger fires, etc.
• Wildland-Urban Interface
– Tools and knowledge critically needed!
UNDERSTANDING WILDLAND FIRES:
The End

Fire Modeling - Understanding Wildland Fires

  • 1.
    Fire Modeling Michael J.Gollner Assistant Professor Department of Fire Protection Engineering University of Maryland, College Park UNDERSTANDING WILDLAND FIRES: How new research can help fire-management efforts to protect lives and property
  • 2.
    UNDERSTANDING WILDLAND FIRES: TheFire Problem 1985 1990 1995 2000 2005 2010 2015 0 50 100 150 200 250 300 350 400 NumberofFires(K) 1985 1990 1995 2000 2005 2010 2015 0 5 10 15 20 25 30 35 40 Year AreaBurned(Kkm 2 ) National Interagency Fire Center Statistics
  • 3.
    UNDERSTANDING WILDLAND FIRES: TheFire Problem 1985 1990 1995 2000 2005 2010 2015 0 50 100 150 200 250 300 350 400 NumberofFires(K) 1985 1990 1995 2000 2005 2010 2015 0 5 10 15 20 25 30 35 40 Year AreaBurned(Kkm 2 ) Increasing Area Burned Similar Number of Fires National Interagency Fire Center Statistics 95% of area burned by 3% of fires!
  • 4.
    UNDERSTANDING WILDLAND FIRES: TheFire Problem 1985 1990 1995 2000 2005 2010 2015 0 50 100 150 200 250 300 350 400 NumberofFires(K) 1985 1990 1995 2000 2005 2010 2015 0 5 10 15 20 25 30 35 40 Year AreaBurned(Kkm 2 ) Increasing Area Burned Similar Number of Fires National Interagency Fire Center Statistics Larger Fires are Occurring More Often 95% of area burned by 3% of fires!
  • 5.
    UNDERSTANDING WILDLAND FIRES: TheFire Problem 1985 1990 1995 2000 2005 2010 2015 0 50 100 150 200 250 300 350 400 NumberofFires(K) 1985 1990 1995 2000 2005 2010 2015 0 5 10 15 20 25 30 35 40 Year AreaBurned(Kkm 2 ) 1980 2000 2020 0 $500M $1B $1.5B $2B FederalSuppressionCosts Year Suppression Costs Similarly Increasing National Interagency Fire Center Statistics 95% of area burned by 3% of fires!
  • 6.
    UNDERSTANDING WILDLAND FIRES: TheFire Problem 1985 1990 1995 2000 2005 2010 2015 0 50 100 150 200 250 300 350 400 NumberofFires(K) 1985 1990 1995 2000 2005 2010 2015 0 5 10 15 20 25 30 35 40 Year AreaBurned(Kkm 2 ) 1980 2000 2020 0 $500M $1B $1.5B $2B FederalSuppressionCosts Year Suppression Costs Similarly Increasing National Interagency Fire Center Statistics Suppression is only small fraction of real costs 95% of area burned by 3% of fires!
  • 7.
    UNDERSTANDING WILDLAND FIRES: TheFire Problem 1985 1990 1995 2000 2005 2010 2015 0 50 100 150 200 250 300 350 400 NumberofFires(K) 1985 1990 1995 2000 2005 2010 2015 0 5 10 15 20 25 30 35 40 Year AreaBurned(Kkm 2 ) Increasing Area Burned Similar Number of Fires National Interagency Fire Center Statistics Larger Fires are Occurring More Often “Megafires”
  • 8.
    UNDERSTANDING WILDLAND FIRES: CedarFire San Diego, CA (2003) 2,200+ Homes Lost $27 million – Suppression ~$1 billion – Insured Losses 14 Fatalities
  • 9.
    UNDERSTANDING WILDLAND FIRES: Ft.McMurray Fire Alberta, Canada, 2016 $3.58 billion Insured Damages ~$9.5 billion direct & indirect 1.45 million acres 2,400 buildings destroyed 2 indirect fatalities CBC News, W. Snowdon, Jan 17, 2017
  • 10.
  • 11.
    UNDERSTANDING WILDLAND FIRES: FirebrandIgnitions Luis Hidalgo/AP Union Tribune
  • 12.
    UNDERSTANDING WILDLAND FIRES: FirebrandIgnitions Luis Hidalgo/AP Union Tribune Most homes at the Wildland-Urban Interface ignite due to small, flying embers, not the main fire Maranghides, Mell, 2009, A Case Study of a Community Affected by the Witch and Guejito Fires (NIST TN
  • 13.
    UNDERSTANDING WILDLAND FIRES: Compiledand mapped by the Fire Modeling Institute; Fire, Fuel and Smoke Program; Rocky Mountain Research Station; Missoula, MT; 4/5/2012
  • 14.
    UNDERSTANDING WILDLAND FIRES: Hazards YarnellHill, AZ (2013) 19 Firefighter Fatalities Lack of situational awareness & communication
  • 15.
    UNDERSTANDING WILDLAND FIRES: FireModels: A critical tool • Operational Fire Management • Active Fires • Fire Danger Rating • Dispatch Rules • Evacuations • Planning • Risk Analysis • Fuel Treatment Design • Management Plans • Training • Fire Behavior • NWCG S-Courses • Research • Climate • Ecology • Fire Behavior Prescribed burn - White Mountain National Forest (USDA FS) Probability contours and exposure of resources and assets. Calkin, Finney, et al.
  • 16.
    UNDERSTANDING WILDLAND FIRES: ModelingFire: The Challenge • Fire modeling occurs over many scales
  • 17.
    UNDERSTANDING WILDLAND FIRES: ModelingFire: The Challenge • Fire modeling occurs over many scales Flame Dynamics Home Ignition Smoke and Emissions Topography Wind and WeatherFuels and Ecology
  • 18.
    UNDERSTANDING WILDLAND FIRES: ModelingFire: The Challenge • Fire modeling occurs over many scales • Many disparate communities – Foresters, Ecologists – Engineers – Atmospheric Scientists – Remote Sensing
  • 19.
    UNDERSTANDING WILDLAND FIRES: ModelingFire: The Challenge • Fire modeling occurs over many scales • Many disparate communities – Foresters, Ecologists – Engineers – Atmospheric Scientists – Remote Sensing • Lack of good data – Most on-the-ground data from smaller, prescribed burns – Satellites lack spatial, temporal resolution
  • 20.
    UNDERSTANDING WILDLAND FIRES: CurrentState of the Art • Empirically-based Models – BehavePlus (Rothermel/USFS RMRS Missoula) – FARSITE (Finney/USFS RMRS Missoula) – FlamMap (Finney/USFS RMRS Missoula) – WFDSS (Finney/Calkin) – Incorporating Fire Spread with Risk Management
  • 21.
    UNDERSTANDING WILDLAND FIRES: CurrentState of the Art • Empirically-based Models – BehavePlus (Rothermel/USFS RMRS Missoula) – FARSITE (Finney/USFS RMRS Missoula) – FlamMap (Finney/USFS RMRS Missoula) – WFDSS (Finney/Calkin) – Incorporating Fire Spread with Risk Management • Coupled Atmospheric Models (weather + surface) – WRF-Fire (Coen/NCAR) • Incorporate weather with empirical surface model – FireTEC (Rodd Linn/Los Alamos National Lab) • Incorporate weather with semi-physical surface model (slow, research only) – Fire Dynamics Simulator (Mell/McGrattan – NIST/USFS) • CFD with focus on Wildland-Urban Interface
  • 22.
    UNDERSTANDING WILDLAND FIRES: CurrentState of the Art • Empirically-based Models – BehavePlus (Rothermel/USFS RMRS Missoula) – FARSITE (Finney/USFS RMRS Missoula) – FlamMap (Finney/USFS RMRS Missoula) – WFDSS (Finney/Calkin) – Incorporating Fire Spread with Risk Management • Coupled Atmospheric Models (weather + surface) – WRF-Fire (Coen/NCAR) • Incorporate weather with empirical surface model – FireTEC (Rodd Linn/Los Alamos National Lab) • Incorporate weather with semi-physical surface model (slow, research only) – Fire Dynamics Simulator (Mell/McGrattan – NIST/USFS) • CFD with focus on Wildland-Urban Interface • Mapping – Fuel Mapping (Landfire, Landsat) – Satellite Fire Detection (MODIS, VIIRS) – Airborn IR (NIROPS)
  • 23.
    UNDERSTANDING WILDLAND FIRES: TheFuture • Need for a better physical model. – How do Wildfires Spread? Missoula Comb Burn
  • 24.
    UNDERSTANDING WILDLAND FIRES: TheFuture • Need for a better physical model. – How do Wildfires Spread? – Rothermel Spread Equation • Basis for all US Systems (1960’s) • Not because it’s right, but because its’ useful Texas Prescribed Fire Crown Fire Experiments Missoula Comb Burn ScalingKnowledgeUp
  • 25.
    UNDERSTANDING WILDLAND FIRES: TheFuture • Need for a better physical model. – How do Wildfires Spread? – Rothermel Spread Equation • Basis for all US Systems (1960’s • Not because it’s right, but because its’ useful • Data Assimilation – Filling the gap between models and missing data
  • 26.
    UNDERSTANDING WILDLAND FIRES: TheFuture • Need for a better physical model. – How do Wildfires Spread? – Rothermel Spread Equation • Basis for all US Systems (1960’s • Not because it’s right, but because its’ useful • Data Assimilation – Filling the gap between models and missing data • Improved Measurements – Higher resolution and time response – Improve understanding and response – New satellites, UAV’s, larger fires, etc. NASA’s Ihanka Unmanned Aerial System Improved Spatial Measurements with VIIRS (UMD/UCAR)
  • 27.
    UNDERSTANDING WILDLAND FIRES: TheFuture • Need for a better physical model. – How do Wildfires Spread? – Rothermel Spread Equation • Basis for all US Systems (1960’s • Not because it’s right, but because its’ useful • Data Assimilation – Filling the gap between models and missing data • Improved Measurements – Higher resolution and time response – Improve understanding and response – New satellites, UAV’s, larger fires, etc. • Wildland-Urban Interface – Tools and knowledge critically needed!
  • 28.