1. PRACTICE
0
20
40
60
80
100
120
1975 1980 1985 1990 1995 2000
Number
of
Times
eaten
per
year
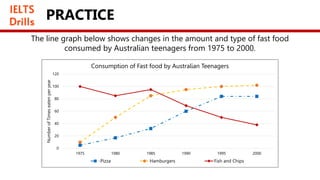
Consumption of Fast food by Australian Teenagers
Pizza Hamburgers Fish and Chips
The line graph below shows changes in the amount and type of fast food
consumed by Australian teenagers from 1975 to 2000.
2. HOMEWORK 1
The table below gives information about the values ($NZ) of exports of kiwi
fruits from New Zealand to five countries between 2010 and 2012. (Actual
Test on 08/02/20)
Country 2010 2011 2012
Japan $271,100,000 $287,400,000 $325,000,000
China $74,900,000 $84,800,000 $94,000,000
Mexico $6,000,000 $2,400,000 $3,300,000
Russia $960,000 $1,585,000 $2,404,000
Saudi Arabia $290,000 $407,000 $82,000
Value ($NZ) of exports of kiwi fruits from New Zealand, 2010 – 2012
3. HOMEWORK 2
The graph below shows the percentage of Australian exports to 4 countries
from 1990 to 2012. (Actual Test on 18/07/19)
0%
5%
10%
15%
20%
25%
30%
1990 1995 2000 2005 2010 2012
% Exports from Australia to 4 countries
Japan US China India
4. HOMEWORK 3
The chart shows the number of students in a UK university who completed (on time
or late), failed to write, and rewrote their dissertation in 1990, 2000, 2010. (Actual
Test on 22/06/19)
0
50
100
150
200
250
300
350
Completed (on time) Completed (late) Failed to write Rewrote
The number of students who completed their dissertationprojects
1990
2000
2010
5. HOMEWORK 4
The chart below shows the number of jobs in tourism-related industries in
one UK city between 1989 and 2009. (Actual Test on 13/06/19)
0
200
400
600
800
1000
1200
1400
1600
1800
1989 1994 1999 2004 2009
Jobs in tourism-related industries
Restaurants
Hotels
Sports and leisure
Travel and tours
6. HOMEWORK 5
The chart below shows information about fuel used in the transport sector in
different countries in Europe, compared to the EU average, in 2009 and 2010.
(Actual Test on 07/04/19)
0.00%
1.00%
2.00%
3.00%
4.00%
5.00%
6.00%
7.00%
8.00%
9.00%
10.00%
Slovakia Italy France Austria Spain Greece EU Average
Fuel used in transport in 6 EU countries, compared to the average
2009
2010
7. HOMEWORK 6
The charts below show the percentage of volunteers by organization in 2008
and 2014. (Actual Test on 19/01/19 and 30/09/21)
21%
18%
15%
7%
24%
15%
2008
Environmental
Arts
Sports
Health Care
Educational
Others
29%
12%
25%
8%
17%
9%
2014
8. PRACTICE 1
The table shows the amount of money given to developing countries by the
USA, EU countries, and other countries from 2006 to 2010.
(Actual test on 10/03/19)
Countries 2006 2007 2008 2009 2010
USA 9.8 11 17 16.7 20.3
EU 3.1 3.4 3.9 3.6 4.1
Other
countries
2.8 3.2 3.5 3.2 3.7
Total 15.7 17.6 24.4 23.5 28.1
Financial support (millions of dollars) to developing countries from 2006-2010
9. PRACTICE 2
The charts below show a comparison of different kinds of energy production
in France in 1995 and 2005. (Actual test on 24/05/18)
29.80%
4.90%
6.40%
29.27%
29.63%
1995
Coal
Others
Nuclear
Petro
Gas
30.93%
9.10%
10.10%
19.55%
30.31%
2005
10. PRACTICE 3
The table shows the export values of various products in 2009 and 2010.
(Actual Test on 25/05/21)
$HK Billions 2009 2010 % Change
Equipment 10.3 11.6 +13%
Telecommunication
s
7.9 12.7 +61%
Clothing 6 5 -17%
Manufacturing 5.5 4 -27%
Metals 2.3 5.1 +122%
Overall 32 38.4 +20%
Changes in exports in $HK Billions, 2009 – 2010
11. PRACTICE 4
The table below shows the weight of people in a particular
country from 1999 to 2009. (Actual Test on 05/05/2018)
Changes in people’s weight, 1999 – 2009
Women Men
1999 2004 2009 1999 2004 2009
Under weight 27% 29% 28% 22% 20% 23%
Normal weight 49% 51% 47% 41% 48% 47%
Over weight 18% 21% 19% 30% 23% 19%
12. PRACTICE 5
The graph gives information about the number of people in Australia who used
Chinese, Arabic, Italian or Greek as their first language. (Actual Test on 17/07/2021)
0
50000
100000
150000
200000
250000
300000
350000
400000
1986 1991 1996 2001 2006 2011
Arabic, Chinese, Italian, and Greek as the first language
Arabic Chinese Italian Greek
13. PRACTICE 6
The chart below shows the percentage of households in owned and rented accommodation
in England and Wales between 1918 and 2011. (Cambridge 13 – Test 2)
0
10
20
30
40
50
60
70
80
1918 1939 1953 1961 1971 1981 1991 2001 2011
%
of
households
Households owning and renting accommodation
in England and Wales 1918 and 2011
Households in owned accommodation Households inrented accommodation
14. PRACTICE 7
The charts below show the percentage of people working in different sectors
in town A and town B in 1960, 2010. (Actual test on 01/02/2020)
20%
16%
64%
2010
70%
20%
10%
1960
Town A
53%
22%
25%
2010
41%
30%
29%
1960
Town B
15. PRACTICE 8
The graphs show changes in the trends of the urban and rural population
and by age group from 1950 to 2040. (Actual test on 24/09/2020)
0
5
10
15
20
25
30
35
40
45
50
1950 1980 2000 2040
%
Urban and rural population trends
total urban rural
0
5
10
15
20
25
30
1950 1980 2000 2040
%
Trend in Age Structure
0-15 16-65 65+
16. PRACTICE 9
The chart below gives information about the urban population in
certain parts of the world including the prediction of the future.
0%
10%
20%
30%
40%
50%
60%
70%
80%
90%
Whole world Africa Asia Latin American/ Caribbean
Population of towns and cities – Percentage of total
1950
2000
2030
17. PRACTICE 10
The line graph shows the number of books that were borrowed in four different months in
2014 from four village libraries, and the pie chart shows the percentage of books, by type,
that were borrowed over this time.
0
50
100
150
200
250
300
350
JUNE JULY AUGUST SEPTEMBER
NUMBER OF BOOKS
BORROWED FROM FOUR
VILLAGE LIBRARIES
West Eaton Ryeslip Sutton Wood Church Mount 10%
43%
14%
14%
19%
TYPES OF BOOK BORROWED
Self-help
Fiction
History
Science
Biography
18. PRACTICE 11
The line graph shows visits to and from the UK from 1979 to 1999, and the bar
graph shows the most popular countries visited by UK residents in 1999.
0
10
20
30
40
50
60
1979 1984 1989 1994 1999
millions
Visits to and from the UK
Visits abroad by UK residents
Visits to the UK by overseas residents
0 2 4 6 8 10 12 14
Turkey
Greece
USA
Spain
France
Millions of UK visitors
Most popular countries visited by UK
residents in 1999