SlideShare a Scribd company logo
1 of 19
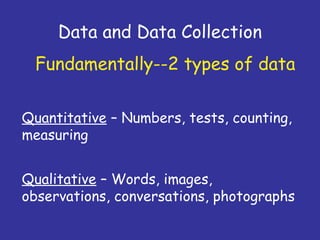
Data and Data Collection
Quantitative – Numbers, tests, counting,
measuring
Fundamentally--2 types of data
Qualitative – Words, images,
observations, conversations, photographs
Data Collection Techniques 
Observations,
Tests,
Surveys,
Document analysis
(the research literature) 
Quantitative Methods 
Experiment: Research situation with at
least one independent variable, which is
manipulated by the researcher
Independent Variable: The variable in the
study under consideration. The cause for
the outcome for the study.
Dependent Variable: The variable being
affected by the independent variable.
The effect of the study
y = f(x)
Which is which here?
Key Factors for High Quality
Experimental Design
Data should not be contaminated by poor
measurement or errors in procedure.
Eliminate confounding variables from study or
minimize effects on variables.
Representativeness: Does your sample
represent the population you are studying?
Must use random sample techniques.
What Makes a Good
Quantitative Research Design? 
4 Key Elements
1. Freedom from Bias
2. Freedom from Confounding
3. Control of Extraneous Variables
4. Statistical Precision to Test Hypothesis
Bias: When observations favor some
individuals in the population over others. 
Confounding: When the effects of two
or more variables cannot be separated.
Extraneous Variables: Any variable that
has an effect on the dependent variable.
Need to identify and minimize these variables.
e.g., Erosion potential as a function of clay content.
rainfall intensity, vegetation & duration would be
considered extraneous variables.
Precision versus accuracy
"Precise" means sharply defined or
measured.
"Accurate" means truthful or correct.
Accurate
Not precise
Accurate
Not precise
Neither accurate
nor precise
Neither accurate
nor precise
Not accurate
But precise
Not accurate
But precise
Both Accurate
and Precise
Both Accurate
and Precise
Interpreting Results of
Experiments 
Goal of research is to draw conclusions.
What did the study mean?
What, if any, is the cause and effect of
the outcome?  
Introduction to Sampling
Sampling is the problem of accurately
acquiring the necessary data in order to
form a representative view of the
problem.
This is much more difficult to do than is
generally realized.
Overall Methodology:
* State the objectives of the survey
* Define the target population
* Define the data to be collected
* Define the variables to be determined
* Define the required precision & accuracy
* Define the measurement `instrument'
* Define the sample size & sampling method,
then select the sample
Sampling
Distributions:
When you form a sample you often show
it by a plotted distribution known as a
histogram .
A histogram is the distribution of
frequency of occurrence of a certain
variable within a specified range.
NOT A BAR GRAPH WHICH LOOKS VERY SIMILAR
Interpreting quantitative
findings 
Descriptive Statistics : Mean, median,
mode, frequencies
Error analyses
Mean
• In science the term mean is really the
arithmetic mean
• Given by the equation
• X = 1
/n Σxi
n
i=1
Or more simply put, the sum of values divided by the
number of values summed
Median
• Consider the set
• 1, 1, 2, 2, 3, 6, 7, 11, 11, 13, 14, 16, 19
– In this case there are 13 values so the median
is the middle value, or (n+1) / 2
– (13+1) /2 = 7
• Consider the set
• 1, 1, 2, 2, 3, 6, 7, 11, 11, 13, 14, 16
– In the second case, the mean of the two middle
values is the median or (n+1) /2
(12 + 1) / 2 = 6.5 ~ (6+7) / 2 = 6.5
Or more simply put the mid value separating all
values in the upper 1/2 of the values from those
in the lower half of the values
Mode
The most frequent value in a data set
• Consider the set
• 1, 1, 1, 1, 2, 2, 3, 6, 11, 11, 11, 13, 14, 16, 19
– In this case the mode is 1 because it is the most
common value
• There may be cases where there are more than
one mode as in this case
• Consider the set
• 1, 1, 1, 1, 2, 2, 3, 6, 11, 11, 11, 11, 13, 14, 16, 19
– In this case there are two modes (bimodal) : 1 and 11
because both occur 4 times in the data set.

More Related Content

What's hot

Statistical Methods in Research
Statistical Methods in ResearchStatistical Methods in Research
Statistical Methods in ResearchManoj Sharma
 
RESEARCH METHODOLOGY- PROCESSING OF DATA
RESEARCH METHODOLOGY- PROCESSING OF DATARESEARCH METHODOLOGY- PROCESSING OF DATA
RESEARCH METHODOLOGY- PROCESSING OF DATAjeni jerry
 
Univariate & bivariate analysis
Univariate & bivariate analysisUnivariate & bivariate analysis
Univariate & bivariate analysissristi1992
 
Selection of appropriate data analysis technique
Selection of appropriate data analysis techniqueSelection of appropriate data analysis technique
Selection of appropriate data analysis techniqueRajaKrishnan M
 
Topic interpretation of data and its analysis
Topic   interpretation of data and its analysisTopic   interpretation of data and its analysis
Topic interpretation of data and its analysisKmTriptiSingh
 
Data Analysis: Descriptive Statistics
Data Analysis: Descriptive StatisticsData Analysis: Descriptive Statistics
Data Analysis: Descriptive StatisticsMahmood Ahmad
 
Univariate analysis:Medical statistics Part IV
Univariate analysis:Medical statistics Part IVUnivariate analysis:Medical statistics Part IV
Univariate analysis:Medical statistics Part IVRamachandra Barik
 
Choosing the Right Statistical Techniques
Choosing the Right Statistical TechniquesChoosing the Right Statistical Techniques
Choosing the Right Statistical TechniquesBodhiya Wijaya Mulya
 
DATA PROCESSING AND STATISTICAL TREATMENT
DATA PROCESSING AND STATISTICAL TREATMENTDATA PROCESSING AND STATISTICAL TREATMENT
DATA PROCESSING AND STATISTICAL TREATMENTAdolf Odani
 
Choosing the best measure of central tendency
Choosing the best measure of central tendencyChoosing the best measure of central tendency
Choosing the best measure of central tendencybujols
 
Quantitative data analysis
Quantitative data analysisQuantitative data analysis
Quantitative data analysisRonaldLucasia1
 
Data Processing and Statistical Treatment: Spreads and Correlation
Data Processing and Statistical Treatment: Spreads and CorrelationData Processing and Statistical Treatment: Spreads and Correlation
Data Processing and Statistical Treatment: Spreads and CorrelationJanet Penilla
 
Measure of Central Tendency
Measure of Central TendencyMeasure of Central Tendency
Measure of Central TendencySharmin_Abeer
 
Ch21 22 data analysis and interpretation
Ch21 22 data analysis and interpretationCh21 22 data analysis and interpretation
Ch21 22 data analysis and interpretationJay Tanna
 
Analysis and interpretation of data
Analysis and interpretation of dataAnalysis and interpretation of data
Analysis and interpretation of datateppxcrown98
 

What's hot (20)

Statistical Methods in Research
Statistical Methods in ResearchStatistical Methods in Research
Statistical Methods in Research
 
Data analysis copy
Data analysis   copyData analysis   copy
Data analysis copy
 
Descriptive statistics
Descriptive statisticsDescriptive statistics
Descriptive statistics
 
Introduction to statistics
Introduction to statisticsIntroduction to statistics
Introduction to statistics
 
RESEARCH METHODOLOGY- PROCESSING OF DATA
RESEARCH METHODOLOGY- PROCESSING OF DATARESEARCH METHODOLOGY- PROCESSING OF DATA
RESEARCH METHODOLOGY- PROCESSING OF DATA
 
Univariate & bivariate analysis
Univariate & bivariate analysisUnivariate & bivariate analysis
Univariate & bivariate analysis
 
Univariate Analysis
Univariate AnalysisUnivariate Analysis
Univariate Analysis
 
Selection of appropriate data analysis technique
Selection of appropriate data analysis techniqueSelection of appropriate data analysis technique
Selection of appropriate data analysis technique
 
Topic interpretation of data and its analysis
Topic   interpretation of data and its analysisTopic   interpretation of data and its analysis
Topic interpretation of data and its analysis
 
Data Analysis: Descriptive Statistics
Data Analysis: Descriptive StatisticsData Analysis: Descriptive Statistics
Data Analysis: Descriptive Statistics
 
Univariate analysis:Medical statistics Part IV
Univariate analysis:Medical statistics Part IVUnivariate analysis:Medical statistics Part IV
Univariate analysis:Medical statistics Part IV
 
Choosing the Right Statistical Techniques
Choosing the Right Statistical TechniquesChoosing the Right Statistical Techniques
Choosing the Right Statistical Techniques
 
Inferential statistics
Inferential statisticsInferential statistics
Inferential statistics
 
DATA PROCESSING AND STATISTICAL TREATMENT
DATA PROCESSING AND STATISTICAL TREATMENTDATA PROCESSING AND STATISTICAL TREATMENT
DATA PROCESSING AND STATISTICAL TREATMENT
 
Choosing the best measure of central tendency
Choosing the best measure of central tendencyChoosing the best measure of central tendency
Choosing the best measure of central tendency
 
Quantitative data analysis
Quantitative data analysisQuantitative data analysis
Quantitative data analysis
 
Data Processing and Statistical Treatment: Spreads and Correlation
Data Processing and Statistical Treatment: Spreads and CorrelationData Processing and Statistical Treatment: Spreads and Correlation
Data Processing and Statistical Treatment: Spreads and Correlation
 
Measure of Central Tendency
Measure of Central TendencyMeasure of Central Tendency
Measure of Central Tendency
 
Ch21 22 data analysis and interpretation
Ch21 22 data analysis and interpretationCh21 22 data analysis and interpretation
Ch21 22 data analysis and interpretation
 
Analysis and interpretation of data
Analysis and interpretation of dataAnalysis and interpretation of data
Analysis and interpretation of data
 

Similar to Data collection

Data and Data Collection - Quantitative and Qualitative
Data and Data Collection - Quantitative and QualitativeData and Data Collection - Quantitative and Qualitative
Data and Data Collection - Quantitative and Qualitativessuserc2c311
 
UNIT I -Data and Data Collection.ppt
UNIT I -Data and Data Collection.pptUNIT I -Data and Data Collection.ppt
UNIT I -Data and Data Collection.pptCHRISCONFORTE
 
UNIT I -Data and Data Collection1.ppt
UNIT I -Data and Data Collection1.pptUNIT I -Data and Data Collection1.ppt
UNIT I -Data and Data Collection1.pptNAGESH108233
 
UNIT I -Data and Data Collection1.ppt
UNIT I -Data and Data Collection1.pptUNIT I -Data and Data Collection1.ppt
UNIT I -Data and Data Collection1.pptNAGESH108233
 
CABT Math 8 measures of central tendency and dispersion
CABT Math 8   measures of central tendency and dispersionCABT Math 8   measures of central tendency and dispersion
CABT Math 8 measures of central tendency and dispersionGilbert Joseph Abueg
 
data_management_review_descriptive_statistics.ppt
data_management_review_descriptive_statistics.pptdata_management_review_descriptive_statistics.ppt
data_management_review_descriptive_statistics.pptRestyLlagas1
 
3. measures of central tendency
3. measures of central tendency3. measures of central tendency
3. measures of central tendencyrenz50
 
STATISTICS.pptx for the scholars and students
STATISTICS.pptx for the scholars and studentsSTATISTICS.pptx for the scholars and students
STATISTICS.pptx for the scholars and studentsssuseref12b21
 
Introduction to Biostatistics_20_4_17.ppt
Introduction to Biostatistics_20_4_17.pptIntroduction to Biostatistics_20_4_17.ppt
Introduction to Biostatistics_20_4_17.pptnyakundi340
 
Machine learning pre requisite
Machine learning pre requisiteMachine learning pre requisite
Machine learning pre requisiteRam Singh
 
scope and need of biostatics
scope and need of  biostaticsscope and need of  biostatics
scope and need of biostaticsdr_sharmajyoti01
 
Week 2 measures of disease occurence
Week 2  measures of disease occurenceWeek 2  measures of disease occurence
Week 2 measures of disease occurenceHamdi Alhakimi
 
ANALYSIS ANDINTERPRETATION OF DATA Analysis and Interpr.docx
ANALYSIS ANDINTERPRETATION  OF DATA Analysis and Interpr.docxANALYSIS ANDINTERPRETATION  OF DATA Analysis and Interpr.docx
ANALYSIS ANDINTERPRETATION OF DATA Analysis and Interpr.docxcullenrjzsme
 
Medical Statistics.ppt
Medical Statistics.pptMedical Statistics.ppt
Medical Statistics.pptssuserf0d95a
 

Similar to Data collection (20)

Data and Data Collection - Quantitative and Qualitative
Data and Data Collection - Quantitative and QualitativeData and Data Collection - Quantitative and Qualitative
Data and Data Collection - Quantitative and Qualitative
 
UNIT I -Data and Data Collection.ppt
UNIT I -Data and Data Collection.pptUNIT I -Data and Data Collection.ppt
UNIT I -Data and Data Collection.ppt
 
UNIT I -Data and Data Collection1.ppt
UNIT I -Data and Data Collection1.pptUNIT I -Data and Data Collection1.ppt
UNIT I -Data and Data Collection1.ppt
 
UNIT I -Data and Data Collection1.ppt
UNIT I -Data and Data Collection1.pptUNIT I -Data and Data Collection1.ppt
UNIT I -Data and Data Collection1.ppt
 
CABT Math 8 measures of central tendency and dispersion
CABT Math 8   measures of central tendency and dispersionCABT Math 8   measures of central tendency and dispersion
CABT Math 8 measures of central tendency and dispersion
 
Intro to Biostat. ppt
Intro to Biostat. pptIntro to Biostat. ppt
Intro to Biostat. ppt
 
data_management_review_descriptive_statistics.ppt
data_management_review_descriptive_statistics.pptdata_management_review_descriptive_statistics.ppt
data_management_review_descriptive_statistics.ppt
 
Stat and prob a recap
Stat and prob   a recapStat and prob   a recap
Stat and prob a recap
 
3. measures of central tendency
3. measures of central tendency3. measures of central tendency
3. measures of central tendency
 
STATISTICS.pptx for the scholars and students
STATISTICS.pptx for the scholars and studentsSTATISTICS.pptx for the scholars and students
STATISTICS.pptx for the scholars and students
 
Chapter 11 Psrm
Chapter 11 PsrmChapter 11 Psrm
Chapter 11 Psrm
 
Introduction to Biostatistics_20_4_17.ppt
Introduction to Biostatistics_20_4_17.pptIntroduction to Biostatistics_20_4_17.ppt
Introduction to Biostatistics_20_4_17.ppt
 
Data analysis
Data analysisData analysis
Data analysis
 
Machine learning pre requisite
Machine learning pre requisiteMachine learning pre requisite
Machine learning pre requisite
 
biostatistics
biostatisticsbiostatistics
biostatistics
 
scope and need of biostatics
scope and need of  biostaticsscope and need of  biostatics
scope and need of biostatics
 
Data in science
Data in science Data in science
Data in science
 
Week 2 measures of disease occurence
Week 2  measures of disease occurenceWeek 2  measures of disease occurence
Week 2 measures of disease occurence
 
ANALYSIS ANDINTERPRETATION OF DATA Analysis and Interpr.docx
ANALYSIS ANDINTERPRETATION  OF DATA Analysis and Interpr.docxANALYSIS ANDINTERPRETATION  OF DATA Analysis and Interpr.docx
ANALYSIS ANDINTERPRETATION OF DATA Analysis and Interpr.docx
 
Medical Statistics.ppt
Medical Statistics.pptMedical Statistics.ppt
Medical Statistics.ppt
 

Recently uploaded

ECONOMIC CONTEXT - PAPER 1 Q3: NEWSPAPERS.pptx
ECONOMIC CONTEXT - PAPER 1 Q3: NEWSPAPERS.pptxECONOMIC CONTEXT - PAPER 1 Q3: NEWSPAPERS.pptx
ECONOMIC CONTEXT - PAPER 1 Q3: NEWSPAPERS.pptxiammrhaywood
 
Biting mechanism of poisonous snakes.pdf
Biting mechanism of poisonous snakes.pdfBiting mechanism of poisonous snakes.pdf
Biting mechanism of poisonous snakes.pdfadityarao40181
 
EPANDING THE CONTENT OF AN OUTLINE using notes.pptx
EPANDING THE CONTENT OF AN OUTLINE using notes.pptxEPANDING THE CONTENT OF AN OUTLINE using notes.pptx
EPANDING THE CONTENT OF AN OUTLINE using notes.pptxRaymartEstabillo3
 
Capitol Tech U Doctoral Presentation - April 2024.pptx
Capitol Tech U Doctoral Presentation - April 2024.pptxCapitol Tech U Doctoral Presentation - April 2024.pptx
Capitol Tech U Doctoral Presentation - April 2024.pptxCapitolTechU
 
Framing an Appropriate Research Question 6b9b26d93da94caf993c038d9efcdedb.pdf
Framing an Appropriate Research Question 6b9b26d93da94caf993c038d9efcdedb.pdfFraming an Appropriate Research Question 6b9b26d93da94caf993c038d9efcdedb.pdf
Framing an Appropriate Research Question 6b9b26d93da94caf993c038d9efcdedb.pdfUjwalaBharambe
 
Introduction to AI in Higher Education_draft.pptx
Introduction to AI in Higher Education_draft.pptxIntroduction to AI in Higher Education_draft.pptx
Introduction to AI in Higher Education_draft.pptxpboyjonauth
 
Organic Name Reactions for the students and aspirants of Chemistry12th.pptx
Organic Name Reactions  for the students and aspirants of Chemistry12th.pptxOrganic Name Reactions  for the students and aspirants of Chemistry12th.pptx
Organic Name Reactions for the students and aspirants of Chemistry12th.pptxVS Mahajan Coaching Centre
 
Interactive Powerpoint_How to Master effective communication
Interactive Powerpoint_How to Master effective communicationInteractive Powerpoint_How to Master effective communication
Interactive Powerpoint_How to Master effective communicationnomboosow
 
Computed Fields and api Depends in the Odoo 17
Computed Fields and api Depends in the Odoo 17Computed Fields and api Depends in the Odoo 17
Computed Fields and api Depends in the Odoo 17Celine George
 
Types of Journalistic Writing Grade 8.pptx
Types of Journalistic Writing Grade 8.pptxTypes of Journalistic Writing Grade 8.pptx
Types of Journalistic Writing Grade 8.pptxEyham Joco
 
Final demo Grade 9 for demo Plan dessert.pptx
Final demo Grade 9 for demo Plan dessert.pptxFinal demo Grade 9 for demo Plan dessert.pptx
Final demo Grade 9 for demo Plan dessert.pptxAvyJaneVismanos
 
18-04-UA_REPORT_MEDIALITERAСY_INDEX-DM_23-1-final-eng.pdf
18-04-UA_REPORT_MEDIALITERAСY_INDEX-DM_23-1-final-eng.pdf18-04-UA_REPORT_MEDIALITERAСY_INDEX-DM_23-1-final-eng.pdf
18-04-UA_REPORT_MEDIALITERAСY_INDEX-DM_23-1-final-eng.pdfssuser54595a
 
Presiding Officer Training module 2024 lok sabha elections
Presiding Officer Training module 2024 lok sabha electionsPresiding Officer Training module 2024 lok sabha elections
Presiding Officer Training module 2024 lok sabha electionsanshu789521
 
Crayon Activity Handout For the Crayon A
Crayon Activity Handout For the Crayon ACrayon Activity Handout For the Crayon A
Crayon Activity Handout For the Crayon AUnboundStockton
 
Painted Grey Ware.pptx, PGW Culture of India
Painted Grey Ware.pptx, PGW Culture of IndiaPainted Grey Ware.pptx, PGW Culture of India
Painted Grey Ware.pptx, PGW Culture of IndiaVirag Sontakke
 
History Class XII Ch. 3 Kinship, Caste and Class (1).pptx
History Class XII Ch. 3 Kinship, Caste and Class (1).pptxHistory Class XII Ch. 3 Kinship, Caste and Class (1).pptx
History Class XII Ch. 3 Kinship, Caste and Class (1).pptxsocialsciencegdgrohi
 

Recently uploaded (20)

ECONOMIC CONTEXT - PAPER 1 Q3: NEWSPAPERS.pptx
ECONOMIC CONTEXT - PAPER 1 Q3: NEWSPAPERS.pptxECONOMIC CONTEXT - PAPER 1 Q3: NEWSPAPERS.pptx
ECONOMIC CONTEXT - PAPER 1 Q3: NEWSPAPERS.pptx
 
Biting mechanism of poisonous snakes.pdf
Biting mechanism of poisonous snakes.pdfBiting mechanism of poisonous snakes.pdf
Biting mechanism of poisonous snakes.pdf
 
EPANDING THE CONTENT OF AN OUTLINE using notes.pptx
EPANDING THE CONTENT OF AN OUTLINE using notes.pptxEPANDING THE CONTENT OF AN OUTLINE using notes.pptx
EPANDING THE CONTENT OF AN OUTLINE using notes.pptx
 
TataKelola dan KamSiber Kecerdasan Buatan v022.pdf
TataKelola dan KamSiber Kecerdasan Buatan v022.pdfTataKelola dan KamSiber Kecerdasan Buatan v022.pdf
TataKelola dan KamSiber Kecerdasan Buatan v022.pdf
 
Capitol Tech U Doctoral Presentation - April 2024.pptx
Capitol Tech U Doctoral Presentation - April 2024.pptxCapitol Tech U Doctoral Presentation - April 2024.pptx
Capitol Tech U Doctoral Presentation - April 2024.pptx
 
Framing an Appropriate Research Question 6b9b26d93da94caf993c038d9efcdedb.pdf
Framing an Appropriate Research Question 6b9b26d93da94caf993c038d9efcdedb.pdfFraming an Appropriate Research Question 6b9b26d93da94caf993c038d9efcdedb.pdf
Framing an Appropriate Research Question 6b9b26d93da94caf993c038d9efcdedb.pdf
 
Model Call Girl in Tilak Nagar Delhi reach out to us at 🔝9953056974🔝
Model Call Girl in Tilak Nagar Delhi reach out to us at 🔝9953056974🔝Model Call Girl in Tilak Nagar Delhi reach out to us at 🔝9953056974🔝
Model Call Girl in Tilak Nagar Delhi reach out to us at 🔝9953056974🔝
 
Introduction to AI in Higher Education_draft.pptx
Introduction to AI in Higher Education_draft.pptxIntroduction to AI in Higher Education_draft.pptx
Introduction to AI in Higher Education_draft.pptx
 
Organic Name Reactions for the students and aspirants of Chemistry12th.pptx
Organic Name Reactions  for the students and aspirants of Chemistry12th.pptxOrganic Name Reactions  for the students and aspirants of Chemistry12th.pptx
Organic Name Reactions for the students and aspirants of Chemistry12th.pptx
 
OS-operating systems- ch04 (Threads) ...
OS-operating systems- ch04 (Threads) ...OS-operating systems- ch04 (Threads) ...
OS-operating systems- ch04 (Threads) ...
 
Interactive Powerpoint_How to Master effective communication
Interactive Powerpoint_How to Master effective communicationInteractive Powerpoint_How to Master effective communication
Interactive Powerpoint_How to Master effective communication
 
Computed Fields and api Depends in the Odoo 17
Computed Fields and api Depends in the Odoo 17Computed Fields and api Depends in the Odoo 17
Computed Fields and api Depends in the Odoo 17
 
Types of Journalistic Writing Grade 8.pptx
Types of Journalistic Writing Grade 8.pptxTypes of Journalistic Writing Grade 8.pptx
Types of Journalistic Writing Grade 8.pptx
 
Final demo Grade 9 for demo Plan dessert.pptx
Final demo Grade 9 for demo Plan dessert.pptxFinal demo Grade 9 for demo Plan dessert.pptx
Final demo Grade 9 for demo Plan dessert.pptx
 
18-04-UA_REPORT_MEDIALITERAСY_INDEX-DM_23-1-final-eng.pdf
18-04-UA_REPORT_MEDIALITERAСY_INDEX-DM_23-1-final-eng.pdf18-04-UA_REPORT_MEDIALITERAСY_INDEX-DM_23-1-final-eng.pdf
18-04-UA_REPORT_MEDIALITERAСY_INDEX-DM_23-1-final-eng.pdf
 
Presiding Officer Training module 2024 lok sabha elections
Presiding Officer Training module 2024 lok sabha electionsPresiding Officer Training module 2024 lok sabha elections
Presiding Officer Training module 2024 lok sabha elections
 
Crayon Activity Handout For the Crayon A
Crayon Activity Handout For the Crayon ACrayon Activity Handout For the Crayon A
Crayon Activity Handout For the Crayon A
 
Painted Grey Ware.pptx, PGW Culture of India
Painted Grey Ware.pptx, PGW Culture of IndiaPainted Grey Ware.pptx, PGW Culture of India
Painted Grey Ware.pptx, PGW Culture of India
 
Model Call Girl in Bikash Puri Delhi reach out to us at 🔝9953056974🔝
Model Call Girl in Bikash Puri  Delhi reach out to us at 🔝9953056974🔝Model Call Girl in Bikash Puri  Delhi reach out to us at 🔝9953056974🔝
Model Call Girl in Bikash Puri Delhi reach out to us at 🔝9953056974🔝
 
History Class XII Ch. 3 Kinship, Caste and Class (1).pptx
History Class XII Ch. 3 Kinship, Caste and Class (1).pptxHistory Class XII Ch. 3 Kinship, Caste and Class (1).pptx
History Class XII Ch. 3 Kinship, Caste and Class (1).pptx
 

Data collection

  • 1. Data and Data Collection Quantitative – Numbers, tests, counting, measuring Fundamentally--2 types of data Qualitative – Words, images, observations, conversations, photographs
  • 3. Quantitative Methods  Experiment: Research situation with at least one independent variable, which is manipulated by the researcher
  • 4. Independent Variable: The variable in the study under consideration. The cause for the outcome for the study. Dependent Variable: The variable being affected by the independent variable. The effect of the study y = f(x) Which is which here?
  • 5. Key Factors for High Quality Experimental Design Data should not be contaminated by poor measurement or errors in procedure. Eliminate confounding variables from study or minimize effects on variables. Representativeness: Does your sample represent the population you are studying? Must use random sample techniques.
  • 6. What Makes a Good Quantitative Research Design?  4 Key Elements 1. Freedom from Bias 2. Freedom from Confounding 3. Control of Extraneous Variables 4. Statistical Precision to Test Hypothesis
  • 7. Bias: When observations favor some individuals in the population over others.  Confounding: When the effects of two or more variables cannot be separated. Extraneous Variables: Any variable that has an effect on the dependent variable. Need to identify and minimize these variables. e.g., Erosion potential as a function of clay content. rainfall intensity, vegetation & duration would be considered extraneous variables.
  • 8. Precision versus accuracy "Precise" means sharply defined or measured. "Accurate" means truthful or correct.
  • 9. Accurate Not precise Accurate Not precise Neither accurate nor precise Neither accurate nor precise Not accurate But precise Not accurate But precise Both Accurate and Precise Both Accurate and Precise
  • 10. Interpreting Results of Experiments  Goal of research is to draw conclusions. What did the study mean? What, if any, is the cause and effect of the outcome?  
  • 11. Introduction to Sampling Sampling is the problem of accurately acquiring the necessary data in order to form a representative view of the problem. This is much more difficult to do than is generally realized.
  • 12. Overall Methodology: * State the objectives of the survey * Define the target population * Define the data to be collected * Define the variables to be determined * Define the required precision & accuracy * Define the measurement `instrument' * Define the sample size & sampling method, then select the sample
  • 13. Sampling Distributions: When you form a sample you often show it by a plotted distribution known as a histogram . A histogram is the distribution of frequency of occurrence of a certain variable within a specified range. NOT A BAR GRAPH WHICH LOOKS VERY SIMILAR
  • 14.
  • 15.
  • 16. Interpreting quantitative findings  Descriptive Statistics : Mean, median, mode, frequencies Error analyses
  • 17. Mean • In science the term mean is really the arithmetic mean • Given by the equation • X = 1 /n Σxi n i=1 Or more simply put, the sum of values divided by the number of values summed
  • 18. Median • Consider the set • 1, 1, 2, 2, 3, 6, 7, 11, 11, 13, 14, 16, 19 – In this case there are 13 values so the median is the middle value, or (n+1) / 2 – (13+1) /2 = 7 • Consider the set • 1, 1, 2, 2, 3, 6, 7, 11, 11, 13, 14, 16 – In the second case, the mean of the two middle values is the median or (n+1) /2 (12 + 1) / 2 = 6.5 ~ (6+7) / 2 = 6.5 Or more simply put the mid value separating all values in the upper 1/2 of the values from those in the lower half of the values
  • 19. Mode The most frequent value in a data set • Consider the set • 1, 1, 1, 1, 2, 2, 3, 6, 11, 11, 11, 13, 14, 16, 19 – In this case the mode is 1 because it is the most common value • There may be cases where there are more than one mode as in this case • Consider the set • 1, 1, 1, 1, 2, 2, 3, 6, 11, 11, 11, 11, 13, 14, 16, 19 – In this case there are two modes (bimodal) : 1 and 11 because both occur 4 times in the data set.