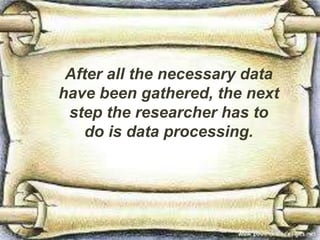
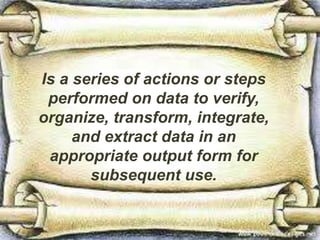
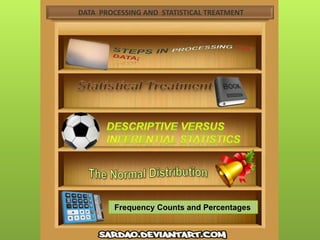
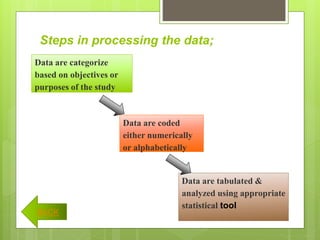
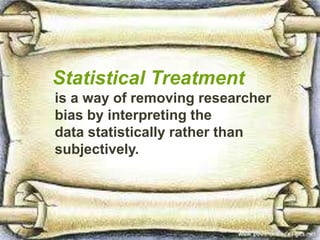
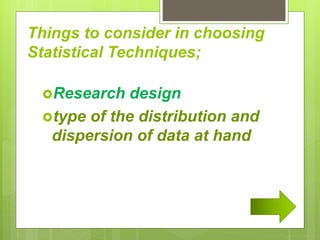
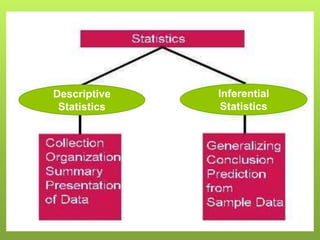
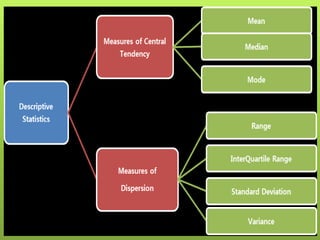
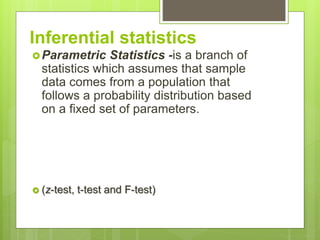
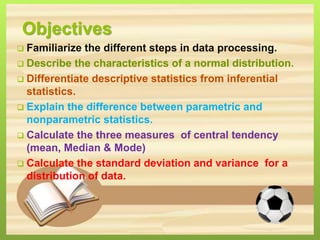
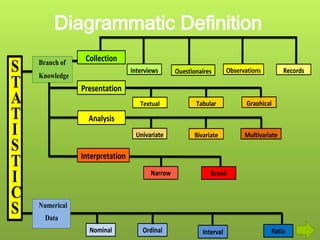
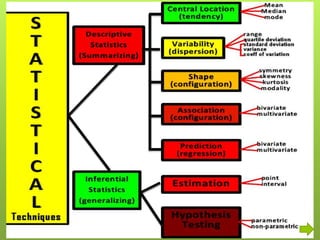
SECTION 9
DATA PROCESSING AND
STATISTICAL TREATMENT
After all the necessary data
have been gathered, the next
step the researcher has to
do is data processing.
Is a series of actions or steps
performed on data to verify,
organize, transform, integrate,
and extract data in an
appropriate output form for
subsequent use.
DATA PROCESSING AND STATISTICAL TREATMENT
Frequency Counts and Percentages
Steps in processing the data;
Data are categorize
based on objectives or
purposes of the study
Data are coded
either numerically
or alphabetically
Data are tabulated &
analyzed using appropriate
statistical tool
BACK
Statistical Treatment
is a way of removing researcher
bias by interpreting the
data statistically rather than
subjectively.
Things to consider in choosing
Statistical Techniques;
Research design
type of the distribution and
dispersion of data at hand
Descriptive
Statistics
Inferential
Statistics
Inferential statistics
Parametric Statistics -is a branch of
statistics which assumes that sample
data comes from a population that
follows a probability distribution based
on a fixed set of parameters.
 (z-test, t-test and F-test)
Nonparametric Statistics- refer to a
statistical method wherein the data is not
required to fit a normal distribution.
Nonparametric statistics uses data that is
often ordinal, meaning it does not rely on
numbers, but rather a ranking or order of
sorts.
(Most commonly used non-parametric test is the chi-square
test)
Example:
Survey conveying consumer
preferences ranging from like to
dislike.
The Normal Distribution
(Gaussian Distribution)
-an average distribution of values that,
when plotted on a graph, resembles the
shape of a bell.
-Abraham De Moivre (1733) was the mathematician who
first develop the mathematical equation of the normal
curve.
In early 19th century:
-Karl Friedrich Gauss (1777-1827) & Marquiz Pierre Simon
de Laplace (1749-1827) further develop the concept of the
curve and probability.
BACK
Frequency Counts and Percentages
-Statistical tools which are usually used to
answer profile questions and those that
involved mere counting.
To determine the percentage per group of
data, simply divide the frequency of each
group (fi) by the total frequency (N) as
shown below:
X 100%Percentage = fi
N
Averages
(Measures the central Tendency)
number expressing the central or typical
value in a set of data, in particular the mode,
median, or (most commonly) the mean,
which is calculated by dividing the sum of
the values in the set by their number.
Go
 Mean- is determined by adding up all of the
scores or values in the distribution and then
dividing this sum by the total number of scores
or values ,where ;
= sum of all the scores or
values in the distribution;
and
n= total number of scores in the
distribution.
Median- is the midpoint of the
distribution the point below and above
of which 50 percent of the scores in
the distribution fall.
Mode- is the most frequent score
or value in the distribution. Either
unimodal, bimodal or multimodal.
Spreads
A measure of spread tells us how
much a data sample is spread out or
scattered. Two distributions may have
identical means but have different
spread or variability.
Two distributions may have identical means but
have different spread or variability or the other
way around.
The Standard Deviation
Considered as the most useful index of
variability or dispersion. This measure indicates
how closely the scores are clustered around the
mean.
S
D
SD=
The Variance
is the expectation of the squared deviation
of a random variable from its mean, and it
informally measures how far a set of
(random) numbers are spread out from
their mean.
Objectives
 Familiarize the different steps in data processing.
 Describe the characteristics of a normal distribution.
 Differentiate descriptive statistics from inferential
statistics.
 Explain the difference between parametric and
nonparametric statistics.
 Calculate the three measures of central tendency
(mean, Median & Mode)
 Calculate the standard deviation and variance for a
distribution of data.
Interpretation
S
T
A
T
I
S
T
I
C
S Numerical
Data
Nominal Ordinal Interval Ratio
Collection
Presentation
Interviews Questionaires Observations Records
Textual GraphicalTabular
Analysis
Univariate MultivariateBivariate
Narrow Broad
Branch of
Knowledge
Year Level Frequency Percentage
Freshmen 150 27.27
Sophomore 142 25.82
Junior 133 24.18
Senior 125 22.73
Total 550 100
𝟕𝟎 + 𝟕𝟑 + 𝟖𝟑 + 𝟖𝟓 + 𝟗𝟎
𝟓
=
𝟒𝟎𝟏
𝟓
=80.2
𝟕𝟎, 𝟕𝟑, 𝟖𝟑, 𝟖𝟓, 𝟗𝟎
𝟏𝟎, 𝟏𝟓, 𝟏𝟔, 𝟏𝟖, 𝟏𝟗, 𝟐𝟐
1,2,2,3,4,3,4,5,4,6,7
10, 20, 30, 40, 50
Mode does
not exist
7,8,8,8,9,10,11,12,12,12,14,15
bimodal
Compute for the SD
Score(X1) (Xi – X) (Xi – X)2
5 1.4 1.96
4 0.4 0.16
4 0.4 0.16
3 -0.6 0.36
2 -1.6 2.56
X=3.6 Σ(Xi – X) 2 =5.20
SD=
𝜮 (Xi – X)2
𝒏
=
𝟓.𝟐
𝟓
= 𝟏. 𝟎𝟒 = 1.02
SD=
𝜮 (Xi – X)2
𝒏
=
𝟓.𝟐
𝟓
= 𝟏. 𝟎𝟒 = 1.02
1.04
= 1.08

Statistical treatment and data processing copy

  • 1.
    SECTION 9 DATA PROCESSINGAND STATISTICAL TREATMENT
  • 3.
    After all thenecessary data have been gathered, the next step the researcher has to do is data processing.
  • 4.
    Is a seriesof actions or steps performed on data to verify, organize, transform, integrate, and extract data in an appropriate output form for subsequent use.
  • 5.
    DATA PROCESSING ANDSTATISTICAL TREATMENT Frequency Counts and Percentages
  • 6.
    Steps in processingthe data; Data are categorize based on objectives or purposes of the study Data are coded either numerically or alphabetically Data are tabulated & analyzed using appropriate statistical tool BACK
  • 7.
    Statistical Treatment is away of removing researcher bias by interpreting the data statistically rather than subjectively.
  • 8.
    Things to considerin choosing Statistical Techniques; Research design type of the distribution and dispersion of data at hand
  • 9.
  • 11.
    Inferential statistics Parametric Statistics-is a branch of statistics which assumes that sample data comes from a population that follows a probability distribution based on a fixed set of parameters.  (z-test, t-test and F-test)
  • 12.
    Nonparametric Statistics- referto a statistical method wherein the data is not required to fit a normal distribution. Nonparametric statistics uses data that is often ordinal, meaning it does not rely on numbers, but rather a ranking or order of sorts. (Most commonly used non-parametric test is the chi-square test) Example: Survey conveying consumer preferences ranging from like to dislike.
  • 13.
  • 14.
    -an average distributionof values that, when plotted on a graph, resembles the shape of a bell.
  • 15.
    -Abraham De Moivre(1733) was the mathematician who first develop the mathematical equation of the normal curve. In early 19th century: -Karl Friedrich Gauss (1777-1827) & Marquiz Pierre Simon de Laplace (1749-1827) further develop the concept of the curve and probability. BACK
  • 16.
    Frequency Counts andPercentages -Statistical tools which are usually used to answer profile questions and those that involved mere counting. To determine the percentage per group of data, simply divide the frequency of each group (fi) by the total frequency (N) as shown below:
  • 17.
  • 19.
    Averages (Measures the centralTendency) number expressing the central or typical value in a set of data, in particular the mode, median, or (most commonly) the mean, which is calculated by dividing the sum of the values in the set by their number.
  • 20.
  • 21.
     Mean- isdetermined by adding up all of the scores or values in the distribution and then dividing this sum by the total number of scores or values ,where ; = sum of all the scores or values in the distribution; and n= total number of scores in the distribution.
  • 22.
    Median- is themidpoint of the distribution the point below and above of which 50 percent of the scores in the distribution fall.
  • 23.
    Mode- is themost frequent score or value in the distribution. Either unimodal, bimodal or multimodal.
  • 25.
    Spreads A measure ofspread tells us how much a data sample is spread out or scattered. Two distributions may have identical means but have different spread or variability.
  • 26.
    Two distributions mayhave identical means but have different spread or variability or the other way around.
  • 28.
    The Standard Deviation Consideredas the most useful index of variability or dispersion. This measure indicates how closely the scores are clustered around the mean. S D SD=
  • 29.
    The Variance is theexpectation of the squared deviation of a random variable from its mean, and it informally measures how far a set of (random) numbers are spread out from their mean.
  • 31.
    Objectives  Familiarize thedifferent steps in data processing.  Describe the characteristics of a normal distribution.  Differentiate descriptive statistics from inferential statistics.  Explain the difference between parametric and nonparametric statistics.  Calculate the three measures of central tendency (mean, Median & Mode)  Calculate the standard deviation and variance for a distribution of data.
  • 32.
    Interpretation S T A T I S T I C S Numerical Data Nominal OrdinalInterval Ratio Collection Presentation Interviews Questionaires Observations Records Textual GraphicalTabular Analysis Univariate MultivariateBivariate Narrow Broad Branch of Knowledge
  • 34.
    Year Level FrequencyPercentage Freshmen 150 27.27 Sophomore 142 25.82 Junior 133 24.18 Senior 125 22.73 Total 550 100
  • 35.
    𝟕𝟎 + 𝟕𝟑+ 𝟖𝟑 + 𝟖𝟓 + 𝟗𝟎 𝟓 = 𝟒𝟎𝟏 𝟓 =80.2
  • 36.
    𝟕𝟎, 𝟕𝟑, 𝟖𝟑,𝟖𝟓, 𝟗𝟎 𝟏𝟎, 𝟏𝟓, 𝟏𝟔, 𝟏𝟖, 𝟏𝟗, 𝟐𝟐
  • 37.
    1,2,2,3,4,3,4,5,4,6,7 10, 20, 30,40, 50 Mode does not exist 7,8,8,8,9,10,11,12,12,12,14,15 bimodal
  • 38.
    Compute for theSD Score(X1) (Xi – X) (Xi – X)2 5 1.4 1.96 4 0.4 0.16 4 0.4 0.16 3 -0.6 0.36 2 -1.6 2.56 X=3.6 Σ(Xi – X) 2 =5.20 SD= 𝜮 (Xi – X)2 𝒏 = 𝟓.𝟐 𝟓 = 𝟏. 𝟎𝟒 = 1.02
  • 39.
    SD= 𝜮 (Xi –X)2 𝒏 = 𝟓.𝟐 𝟓 = 𝟏. 𝟎𝟒 = 1.02 1.04 = 1.08