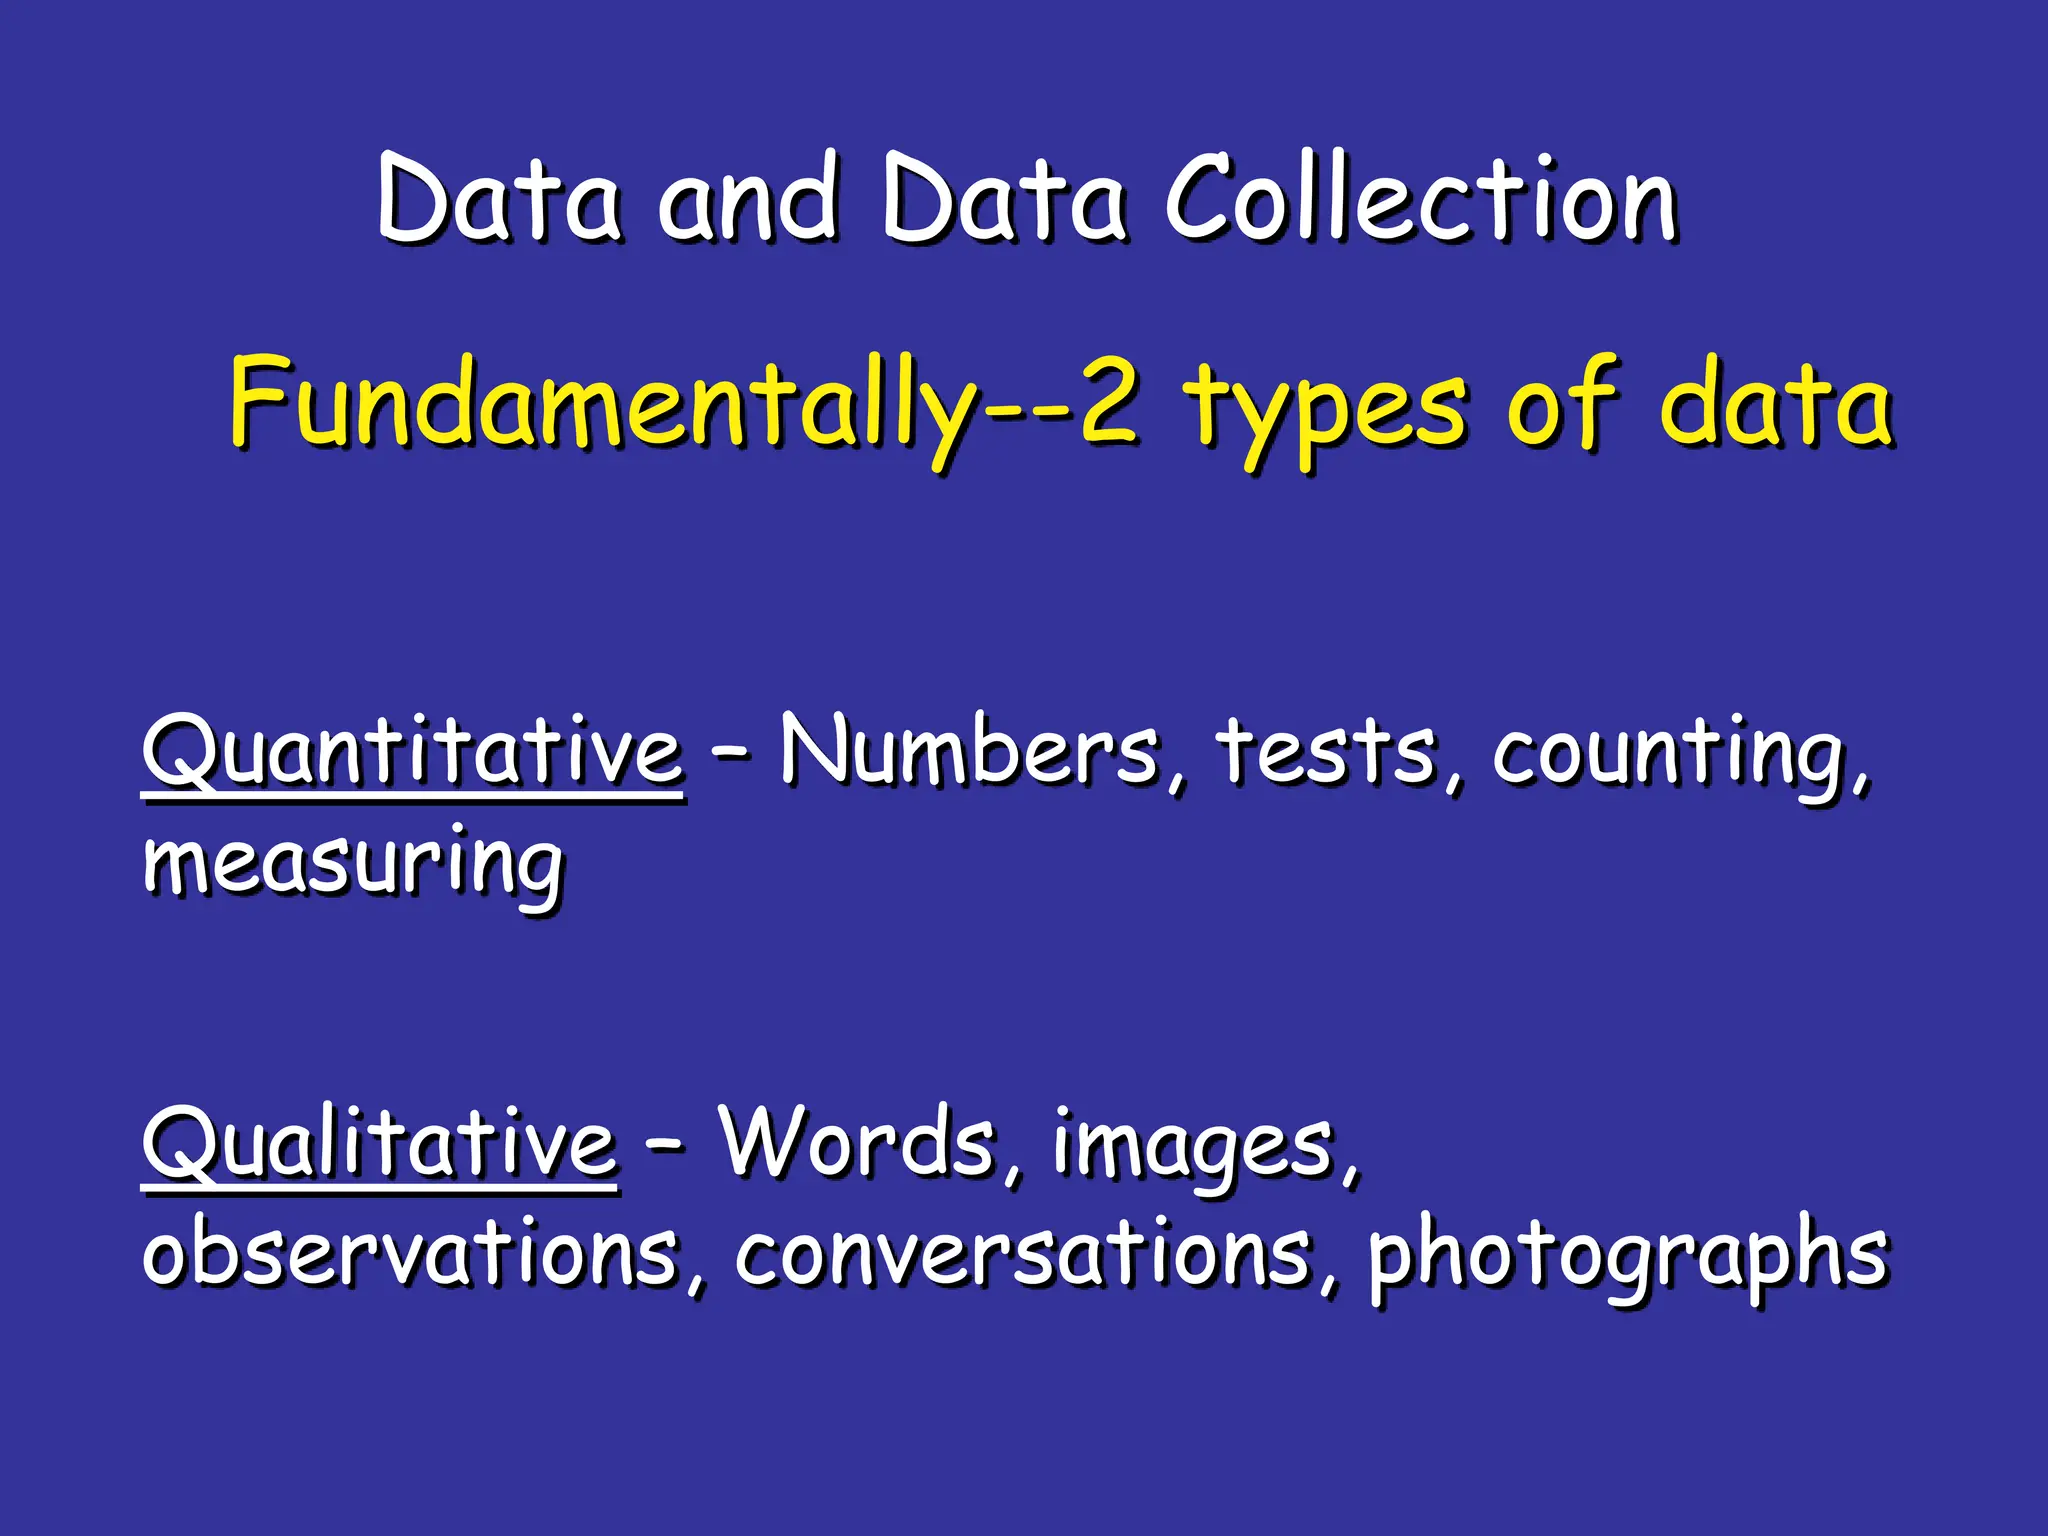
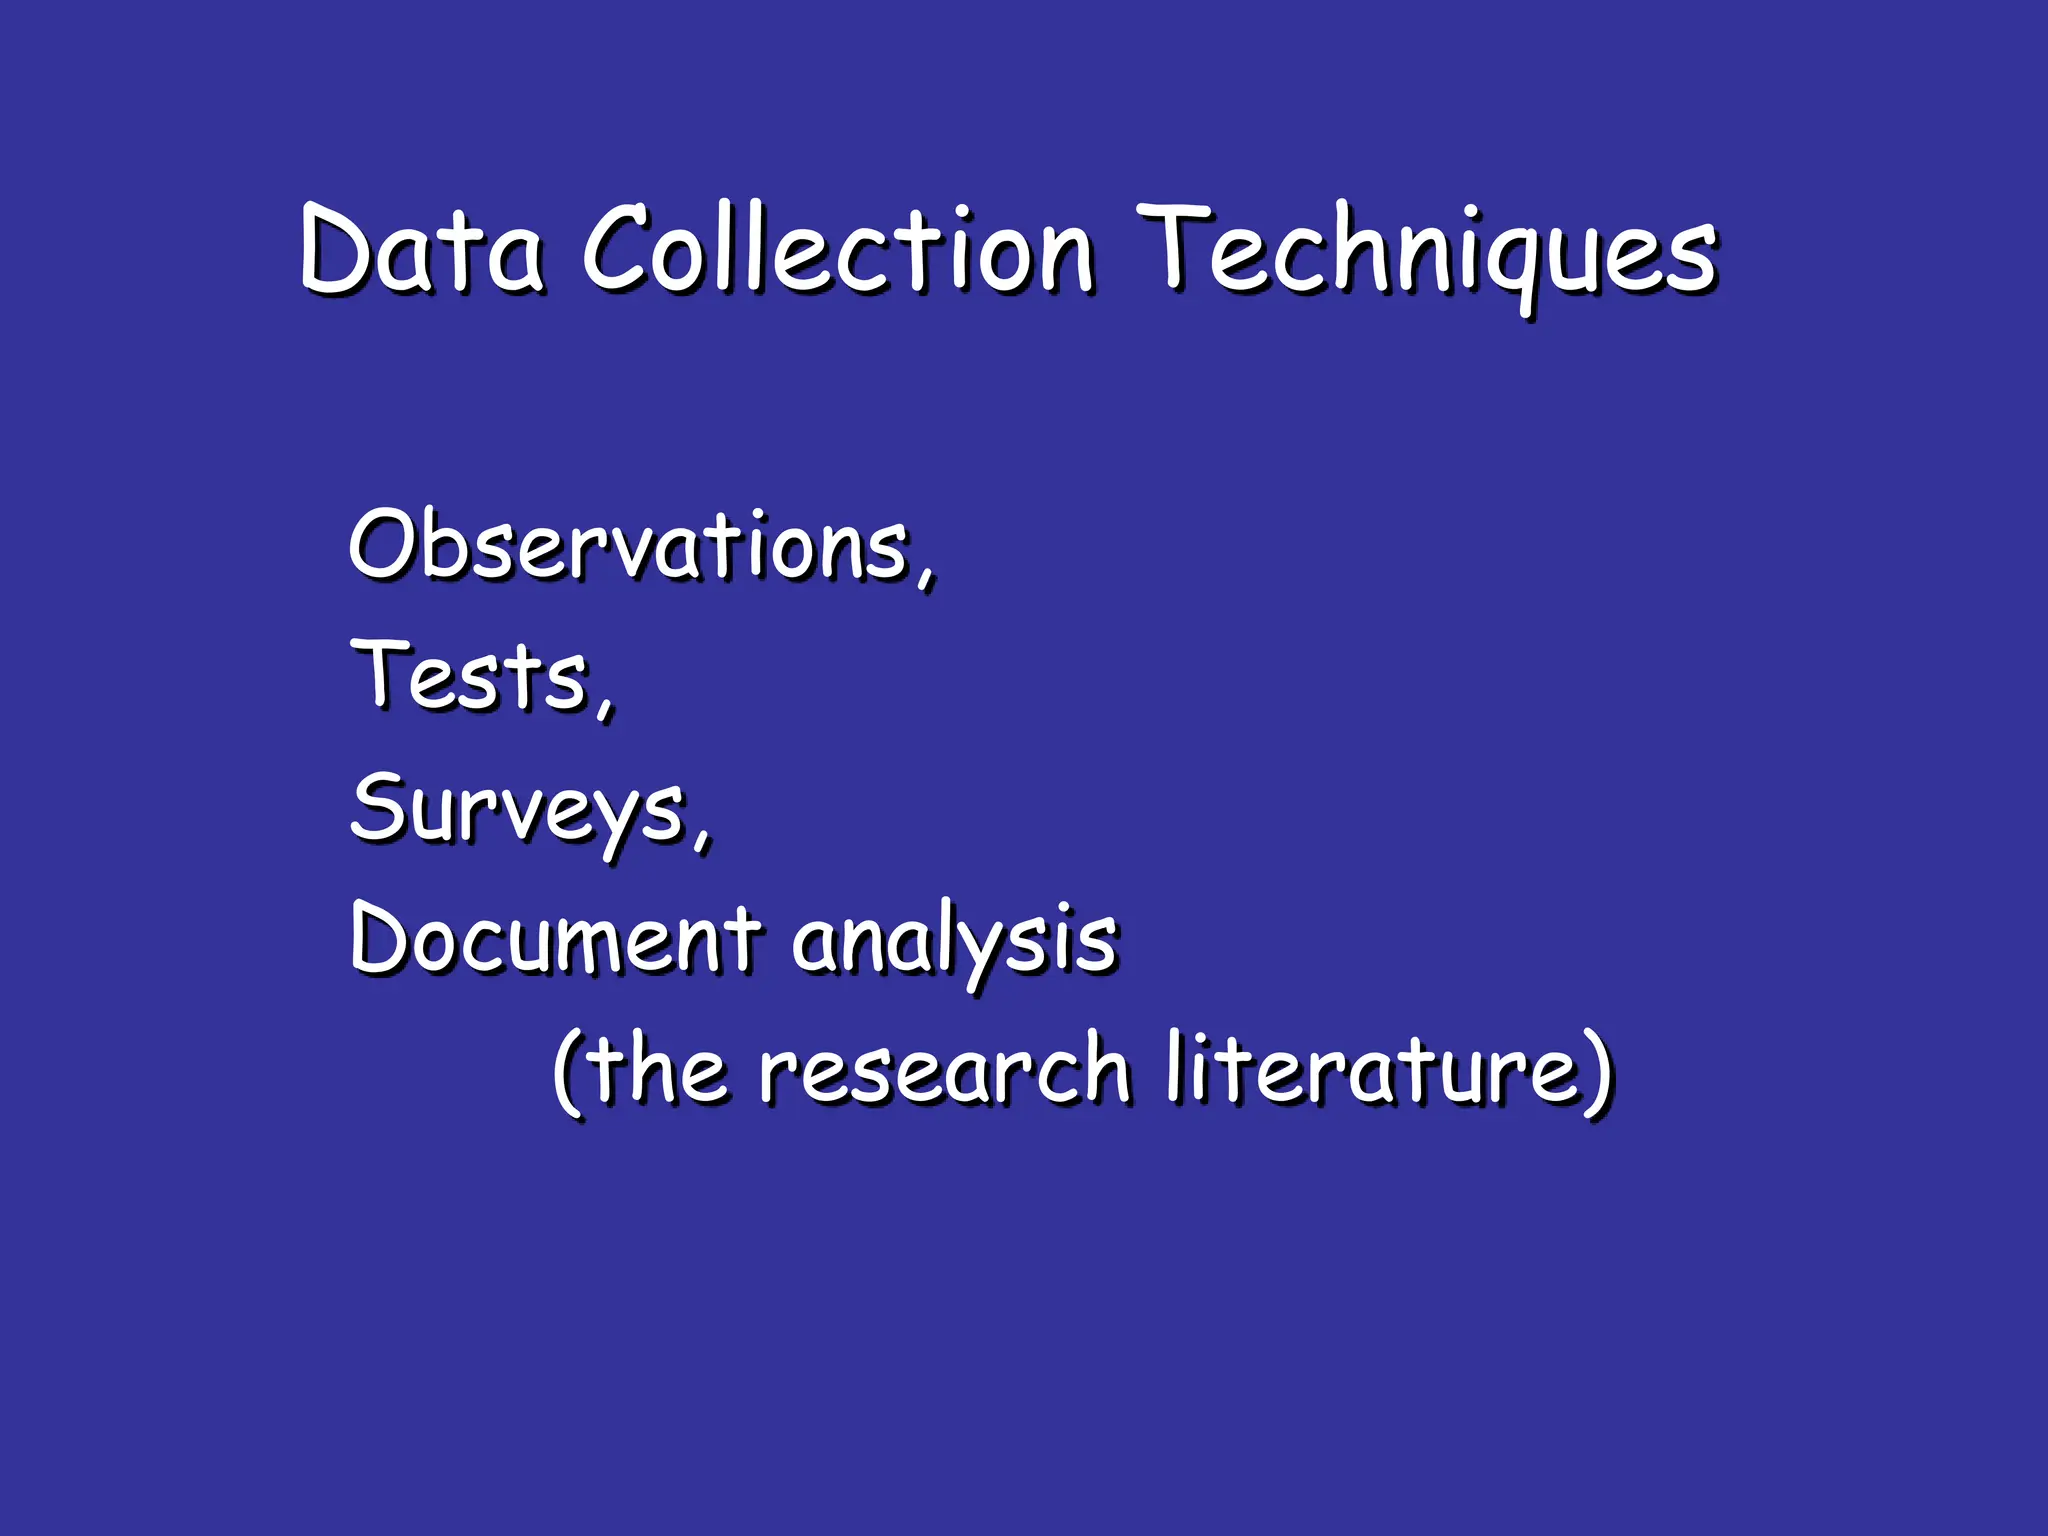
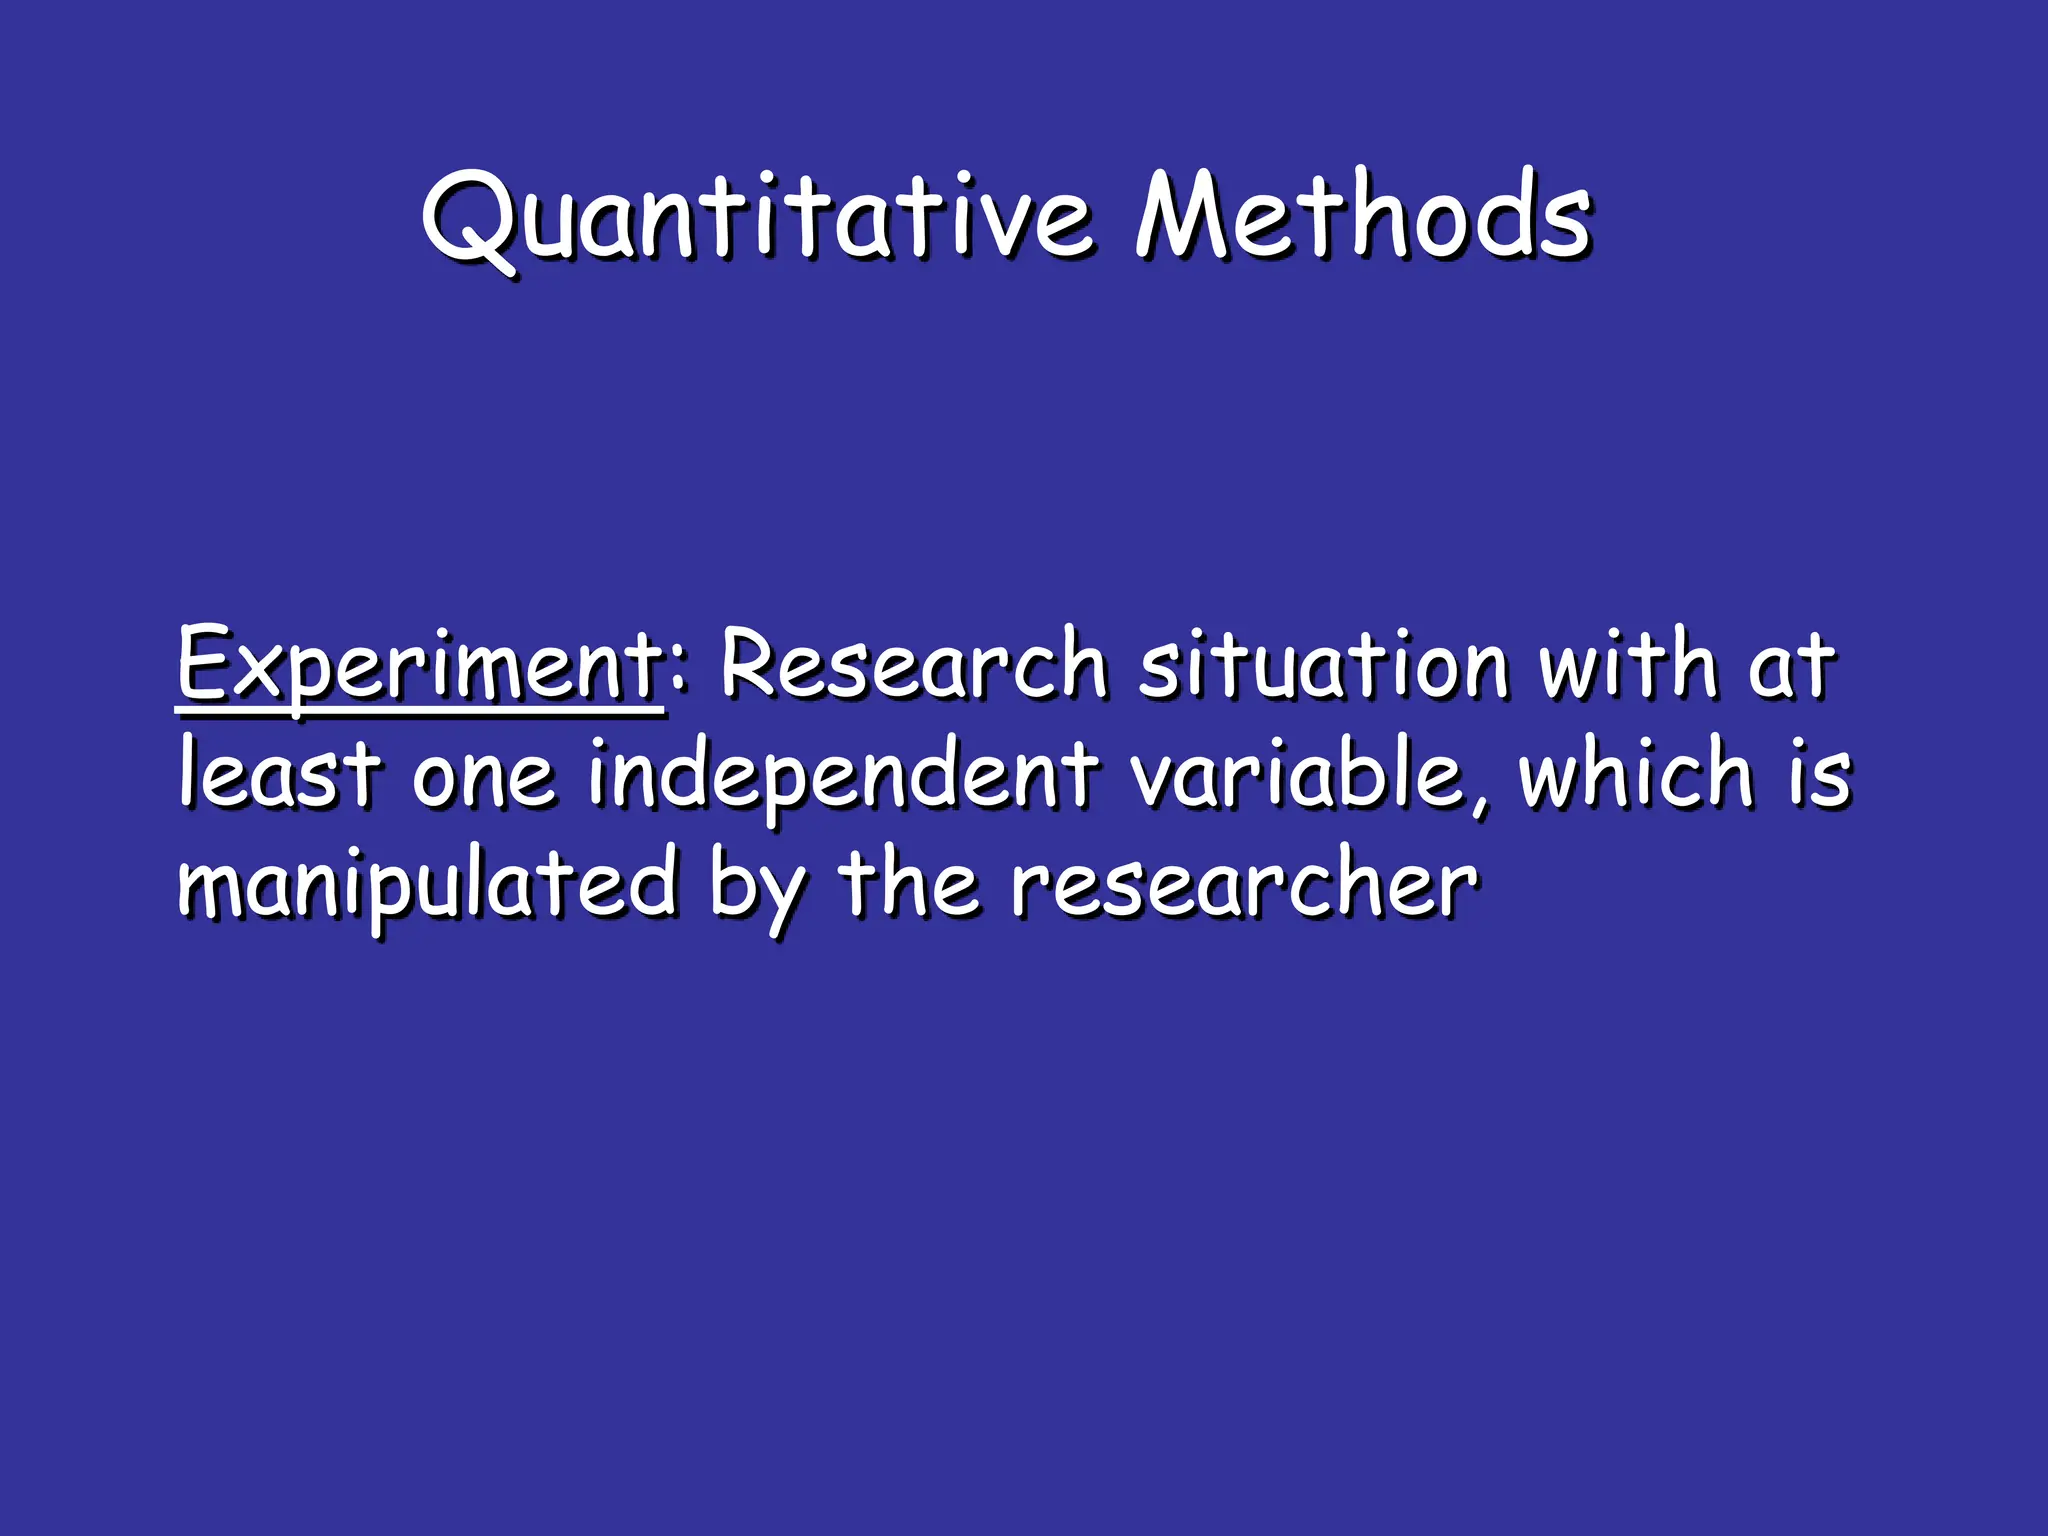
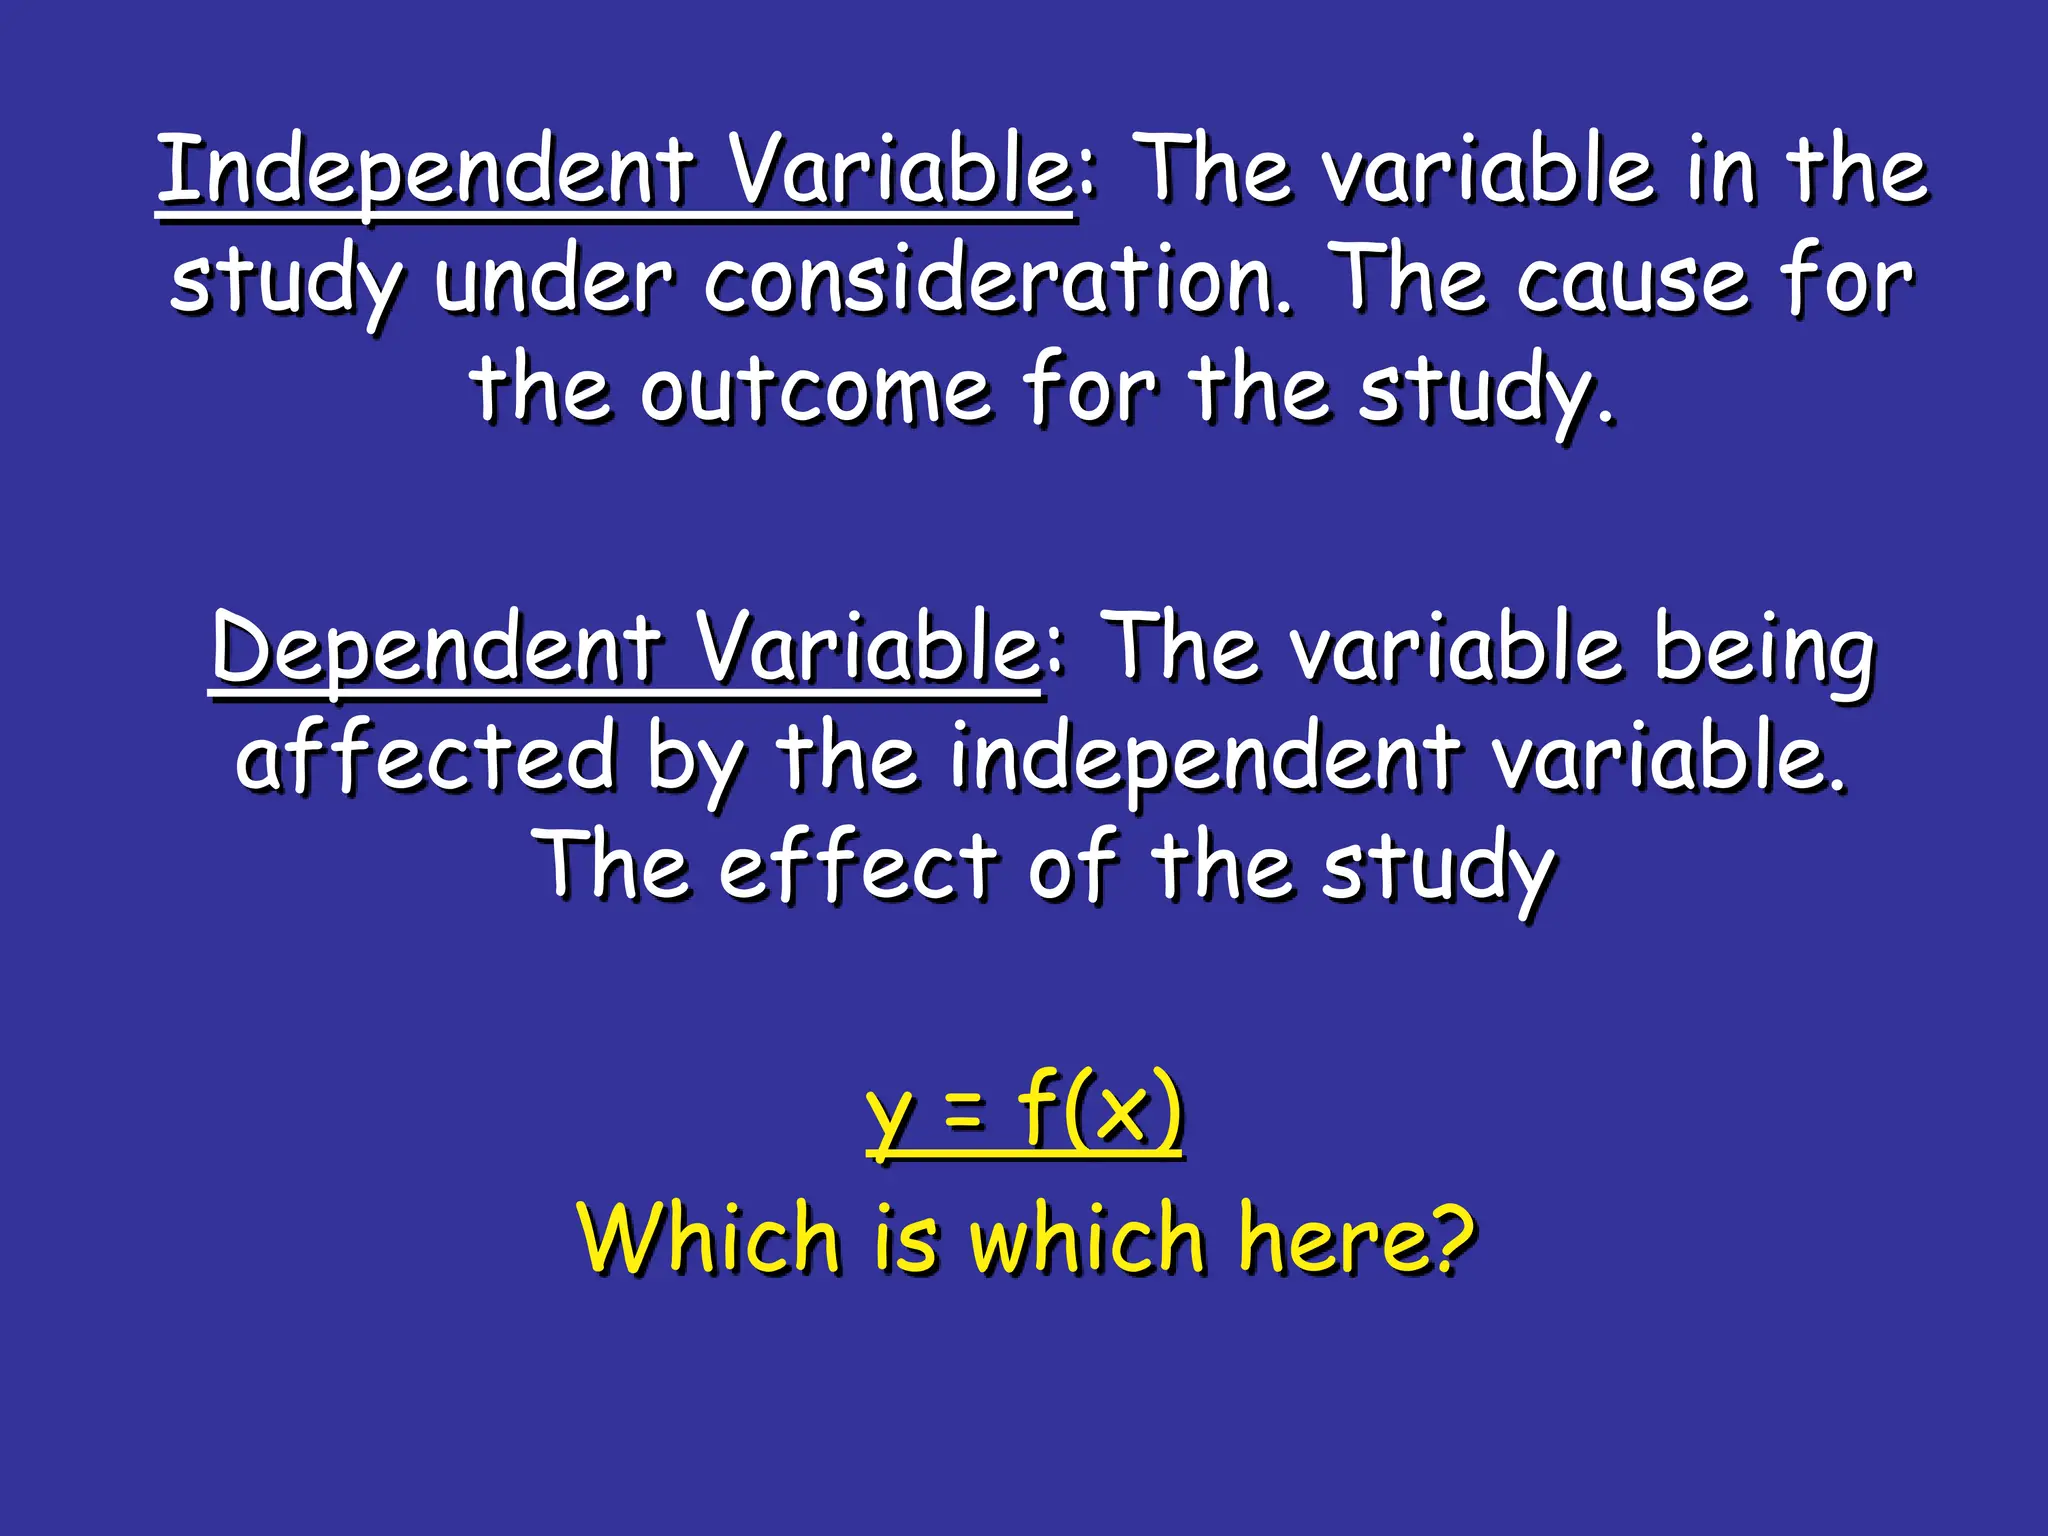
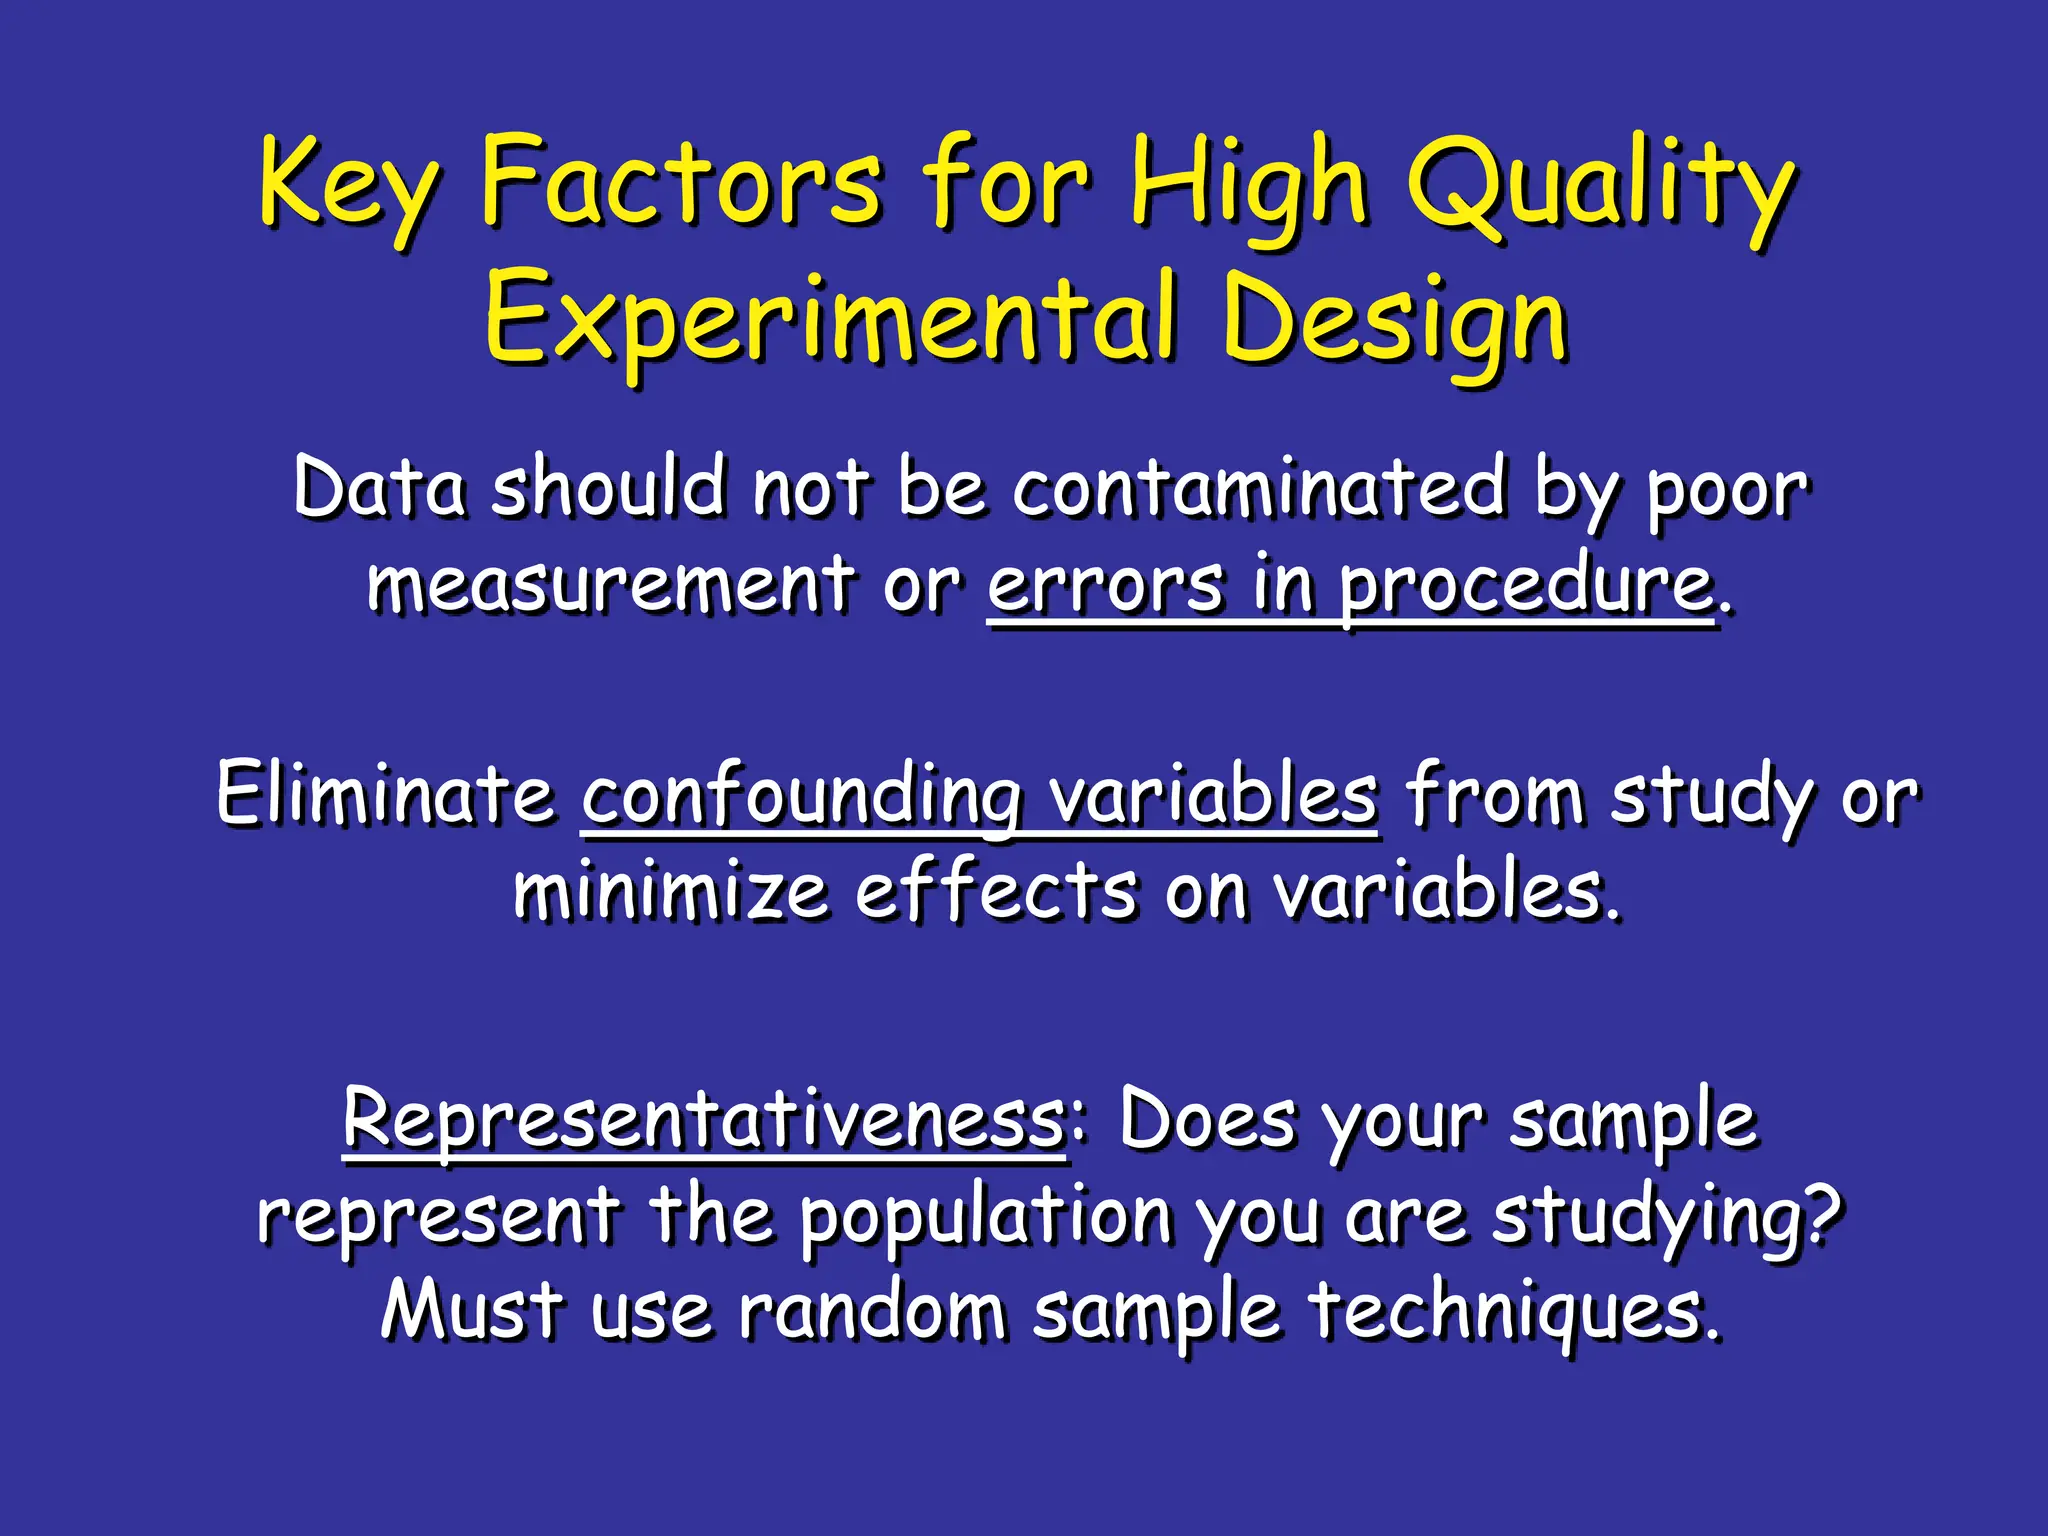
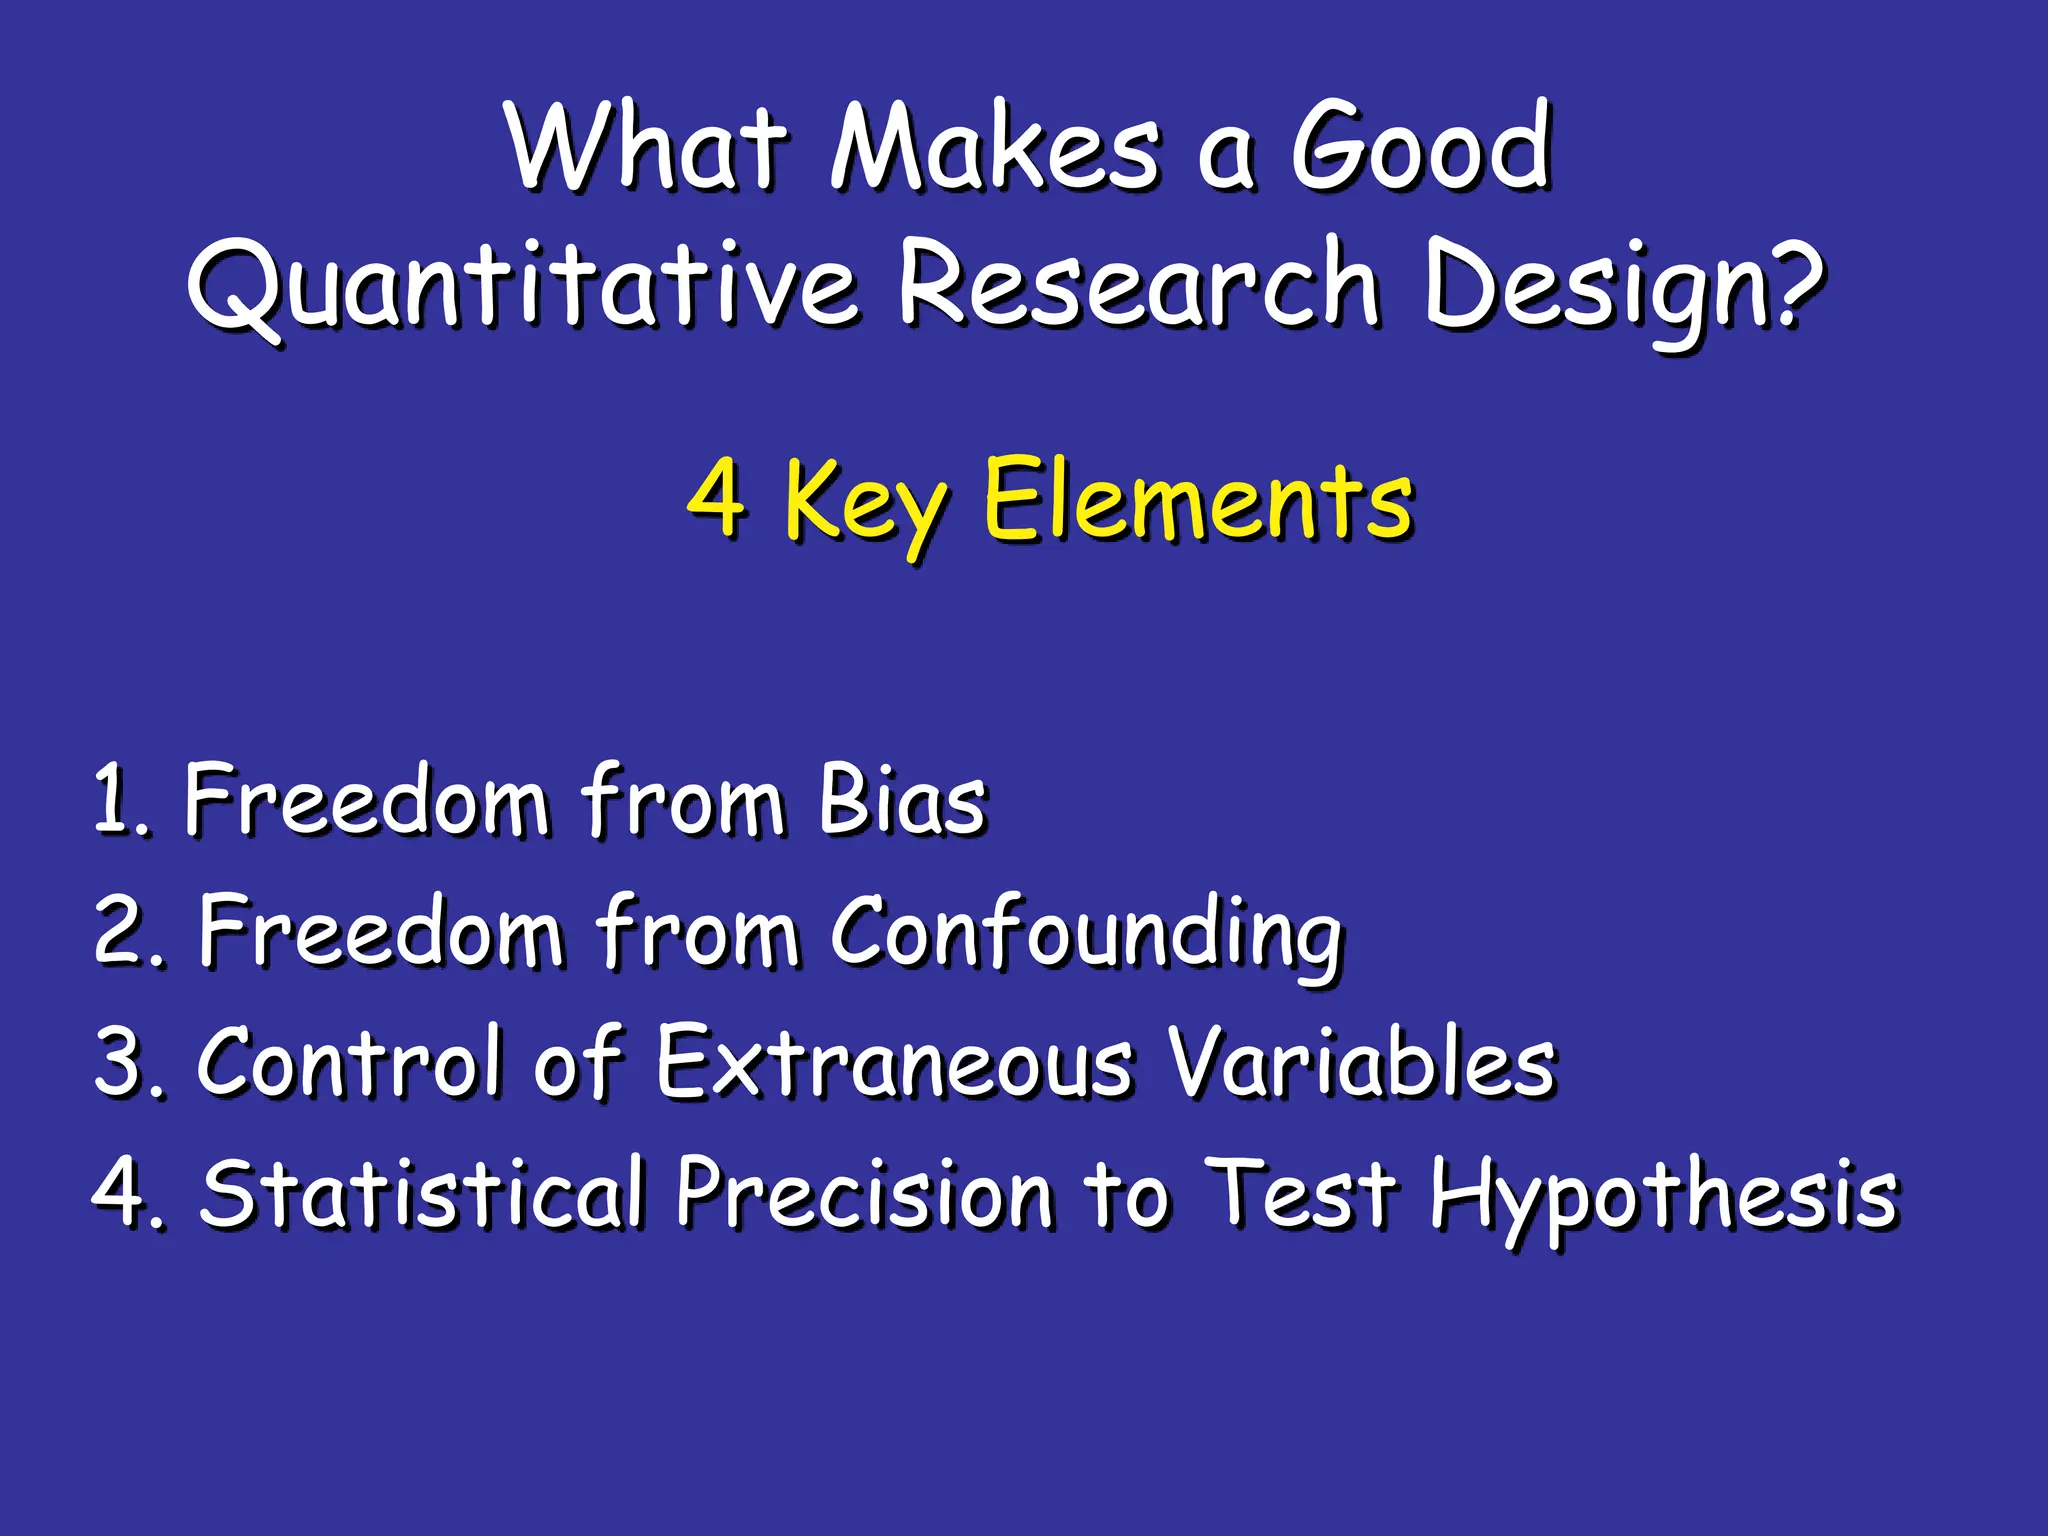
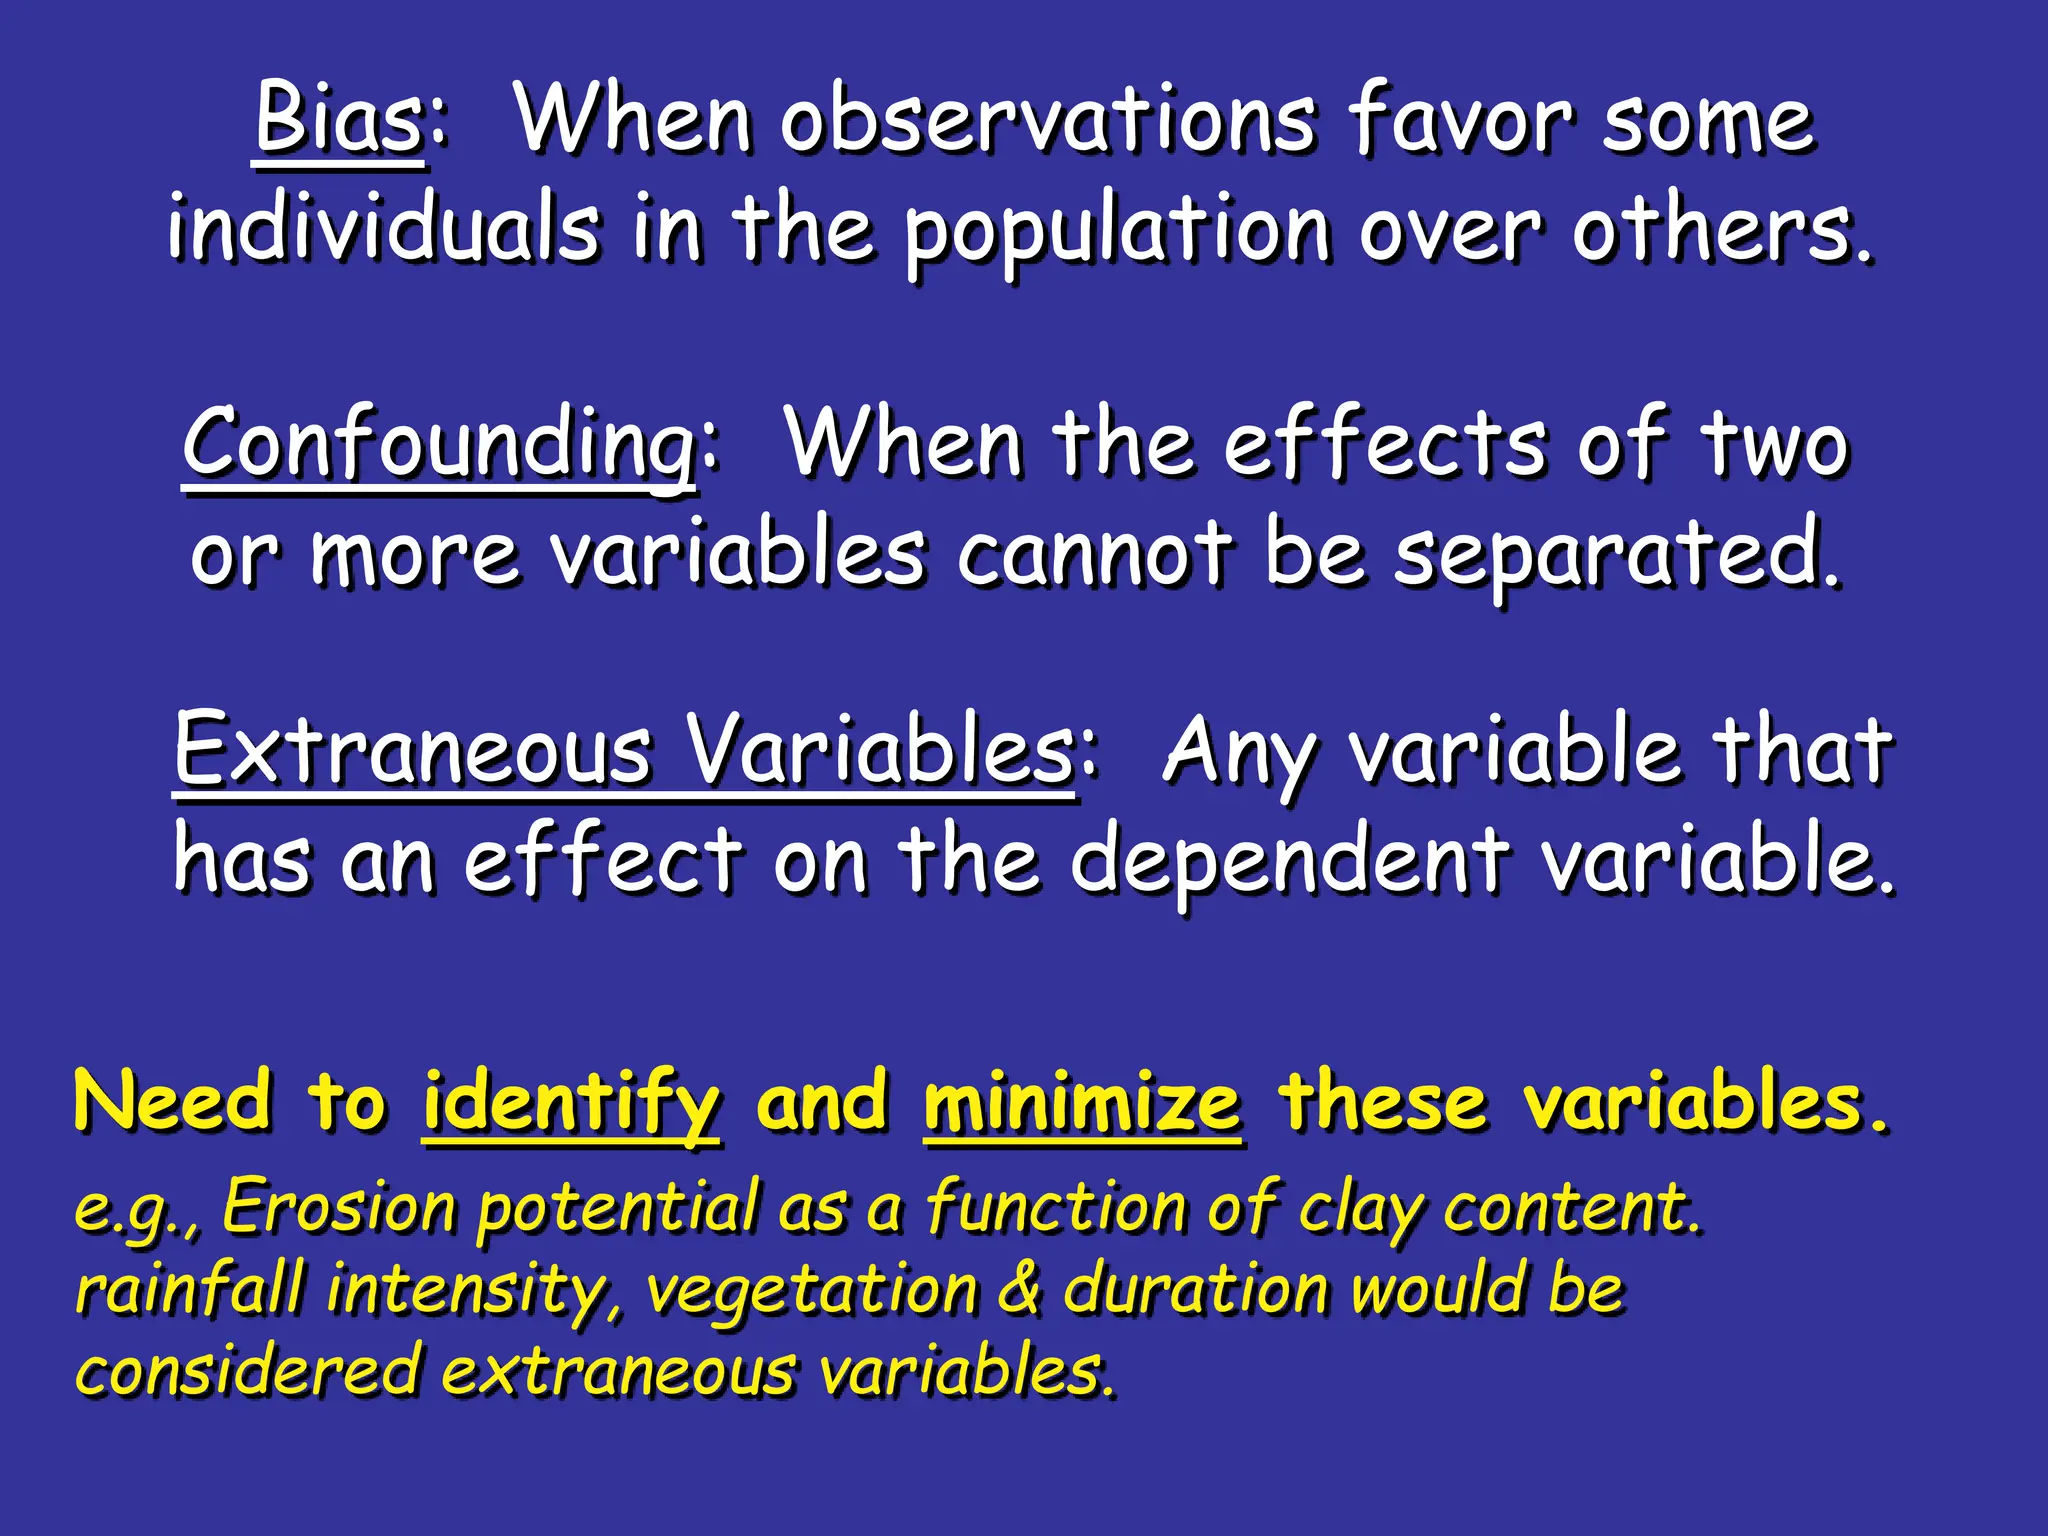
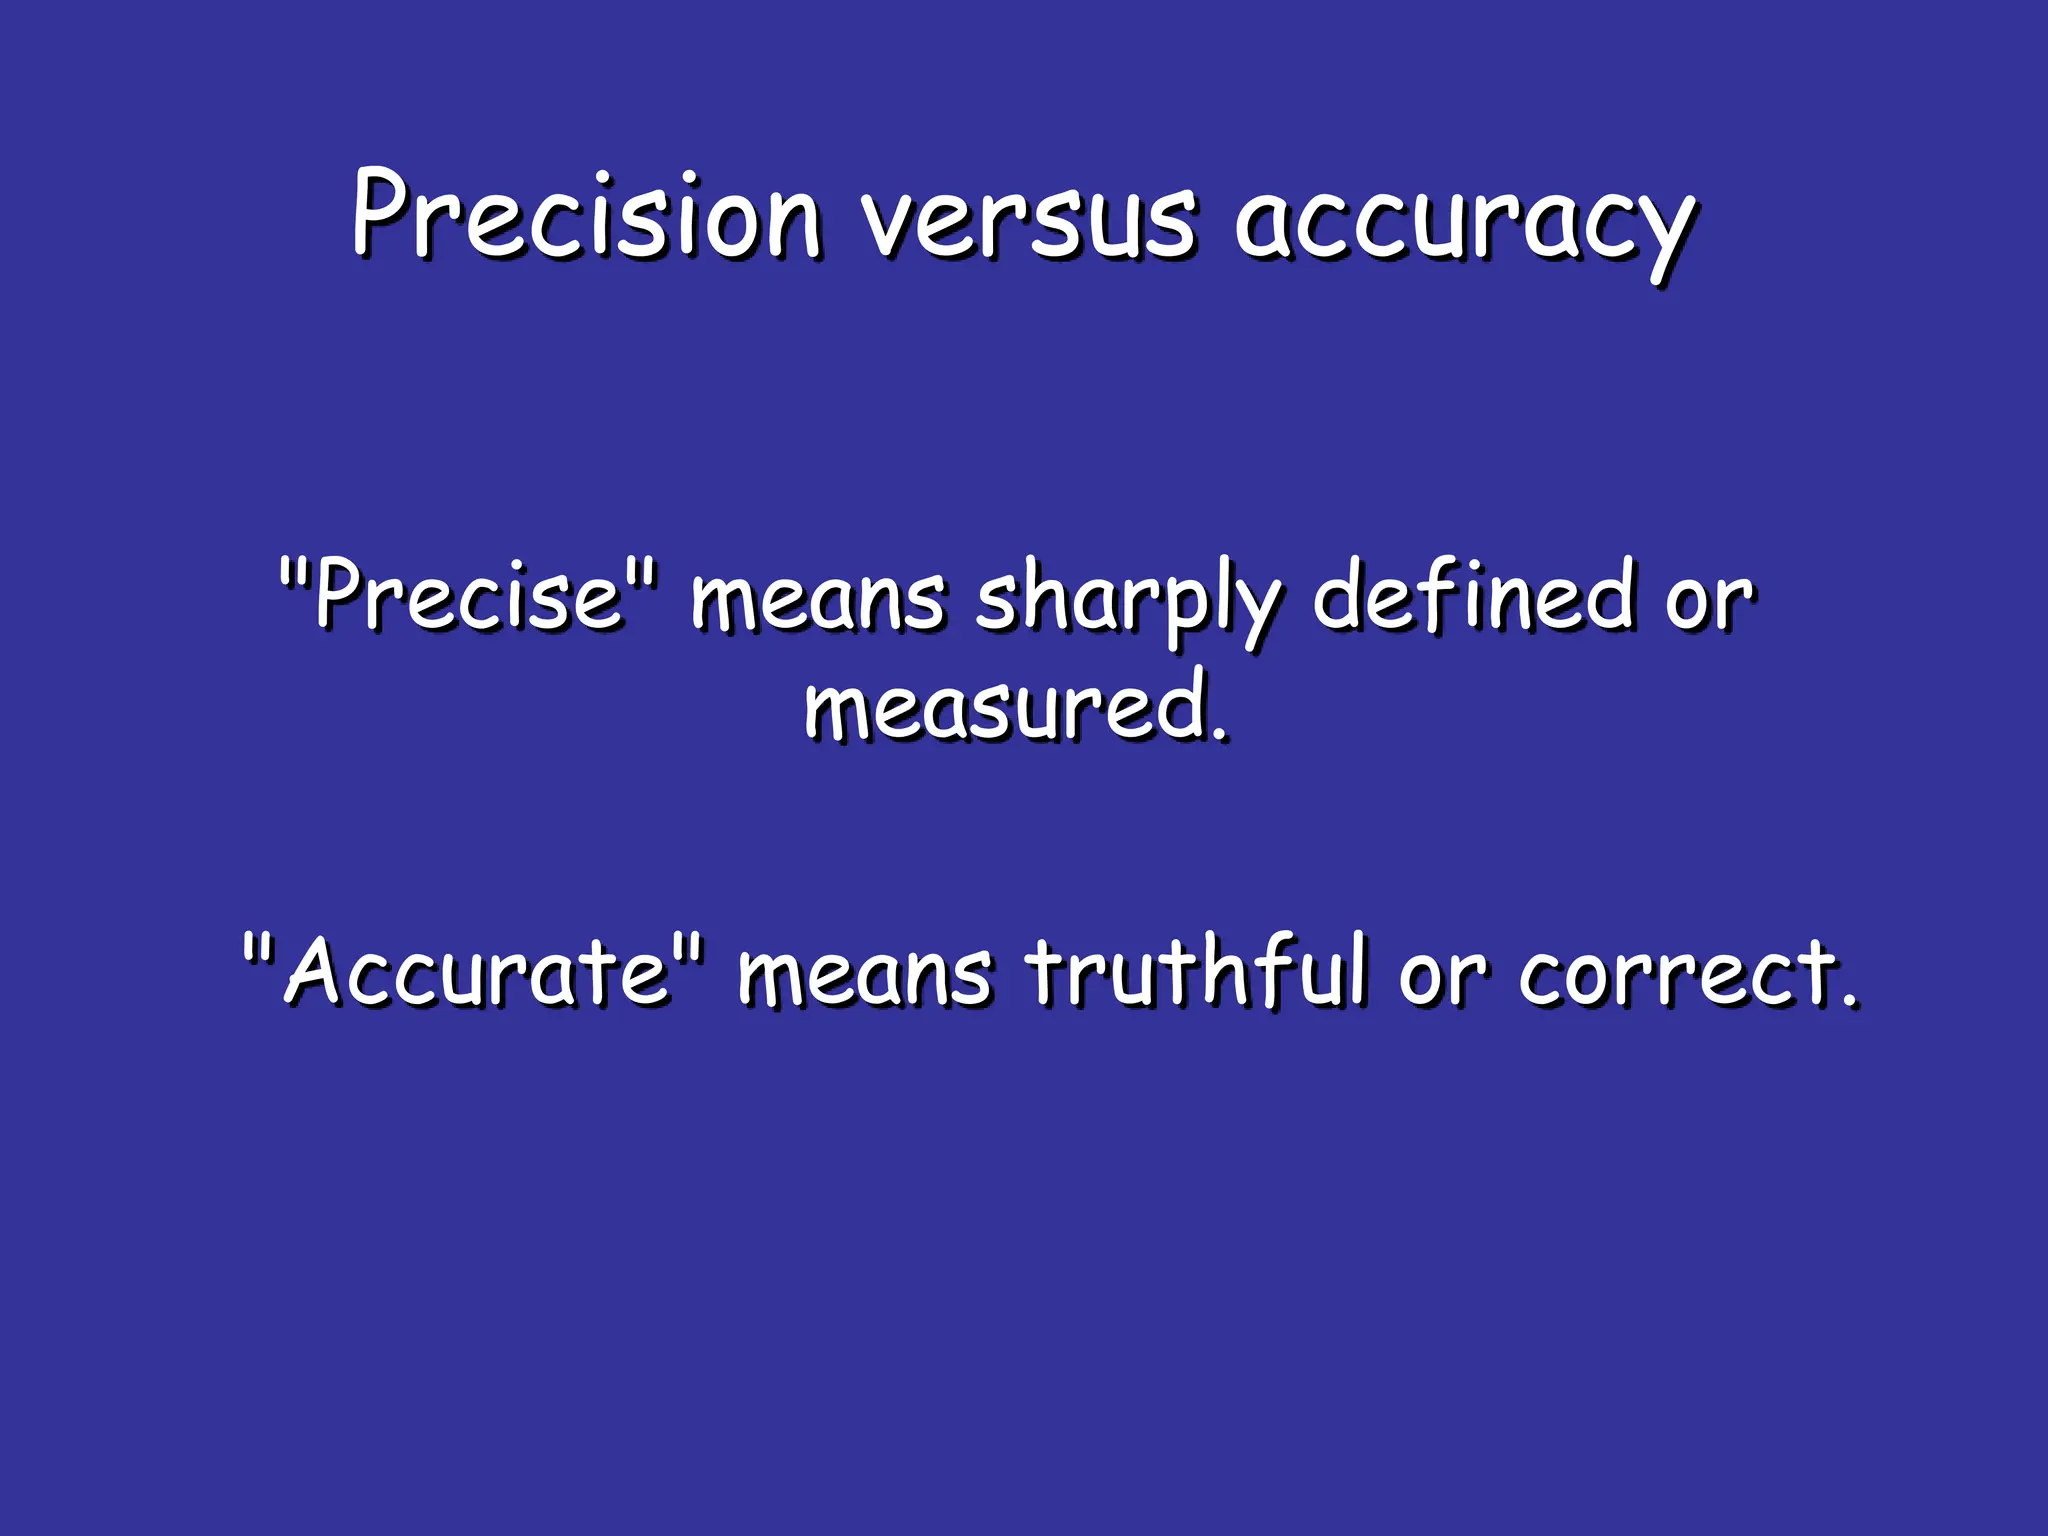
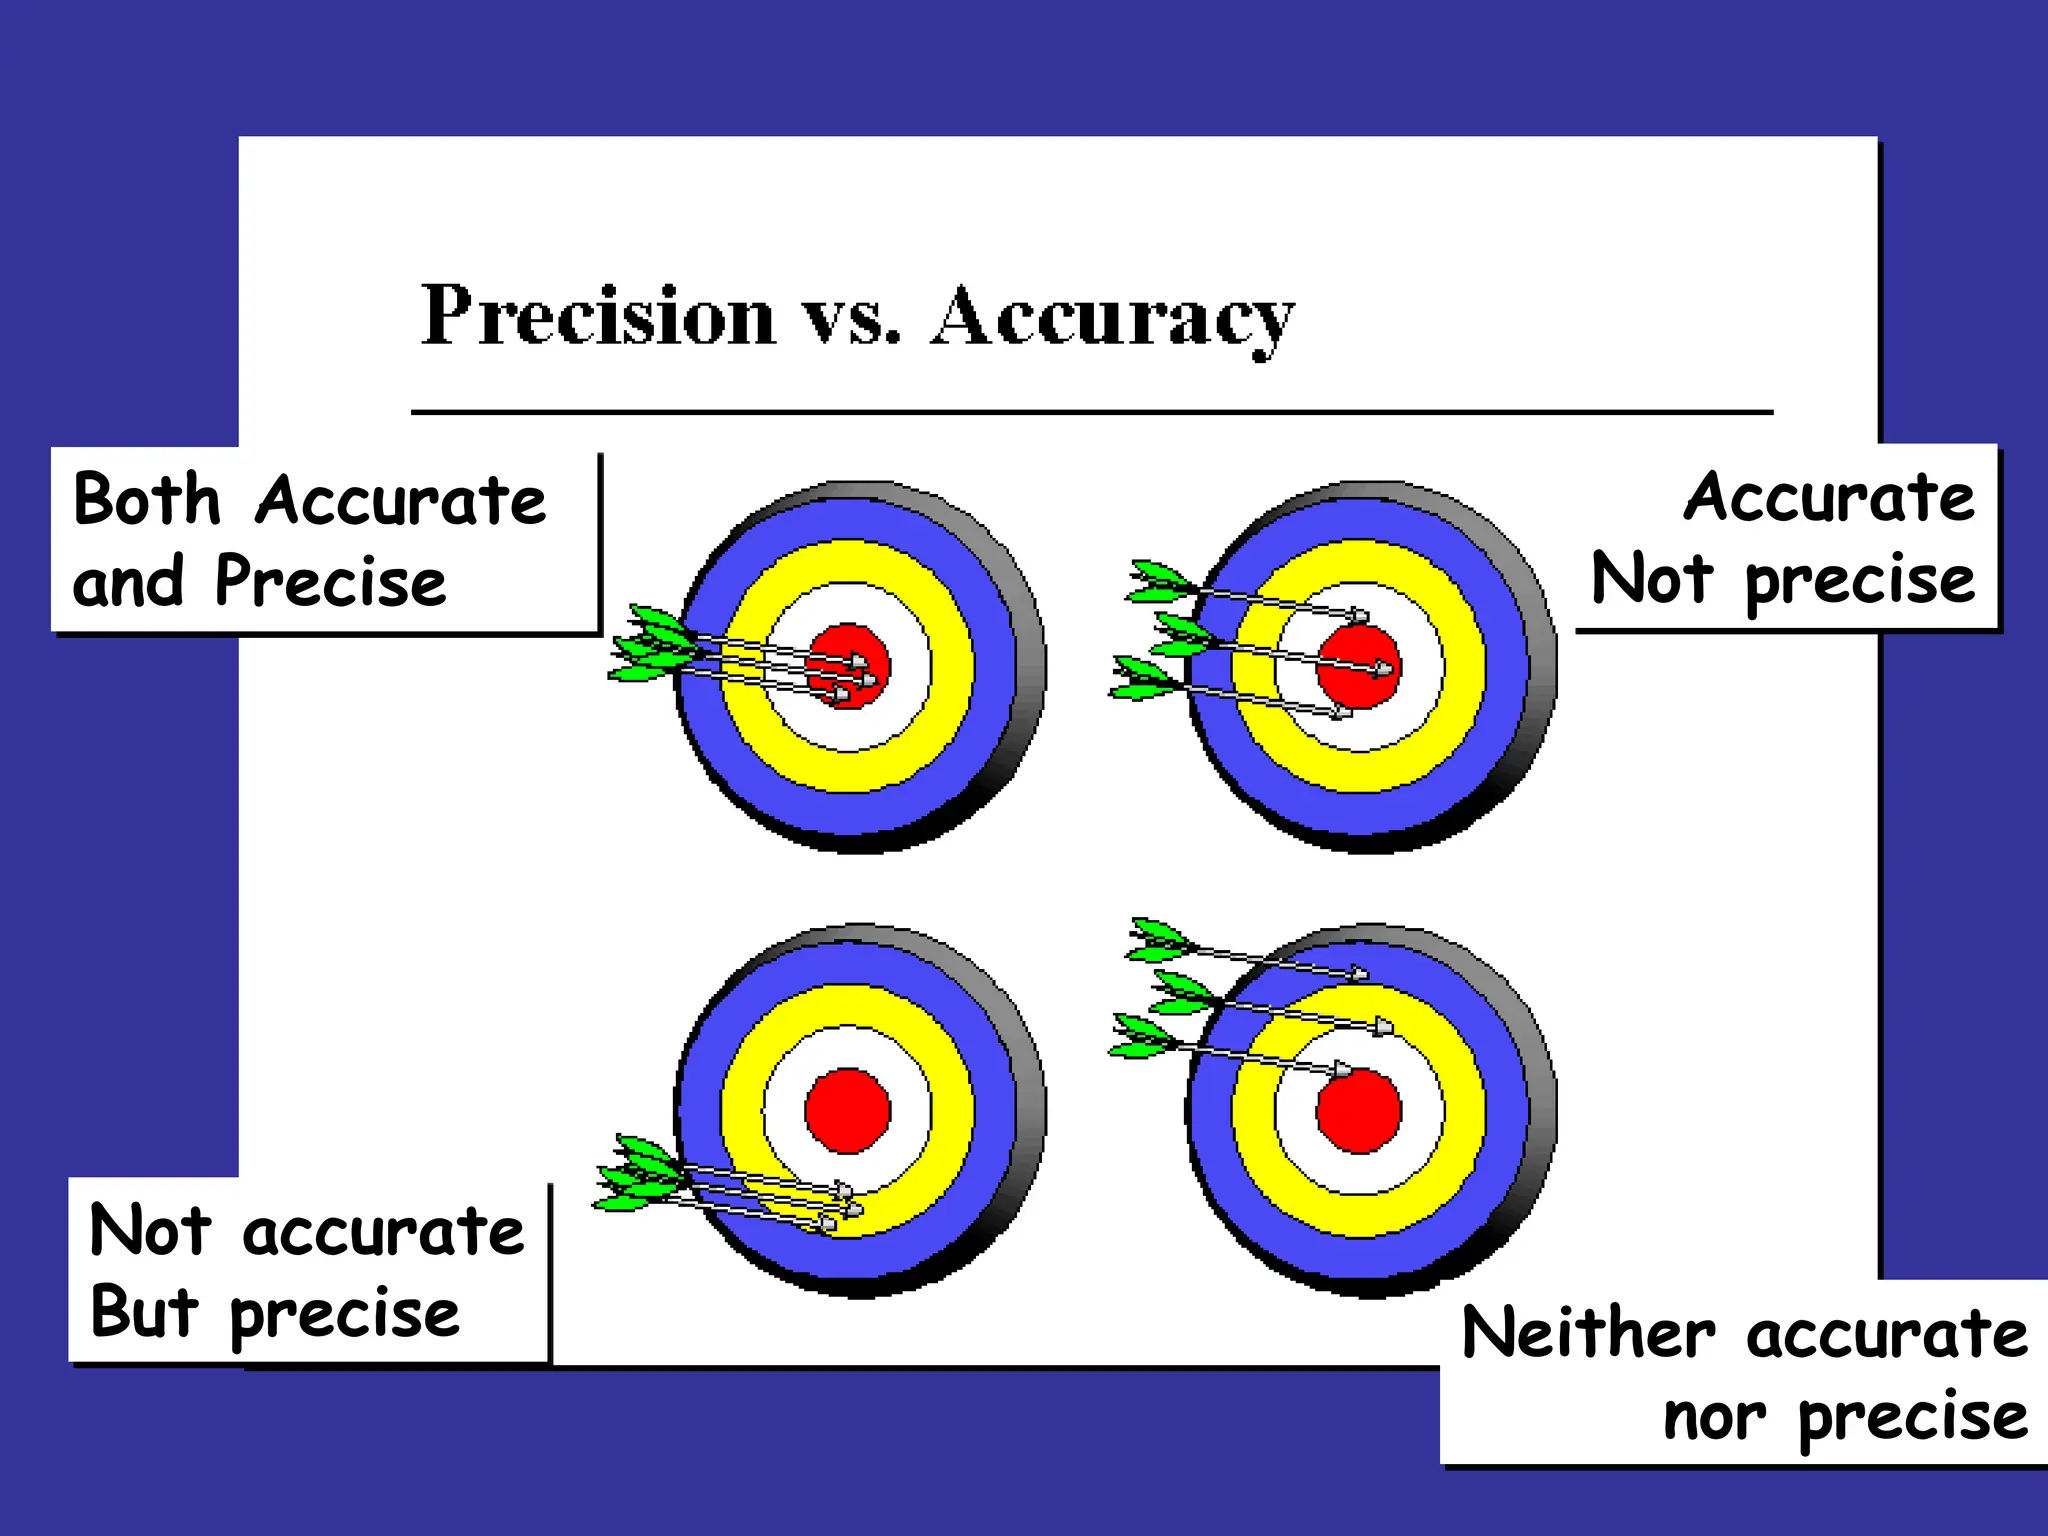
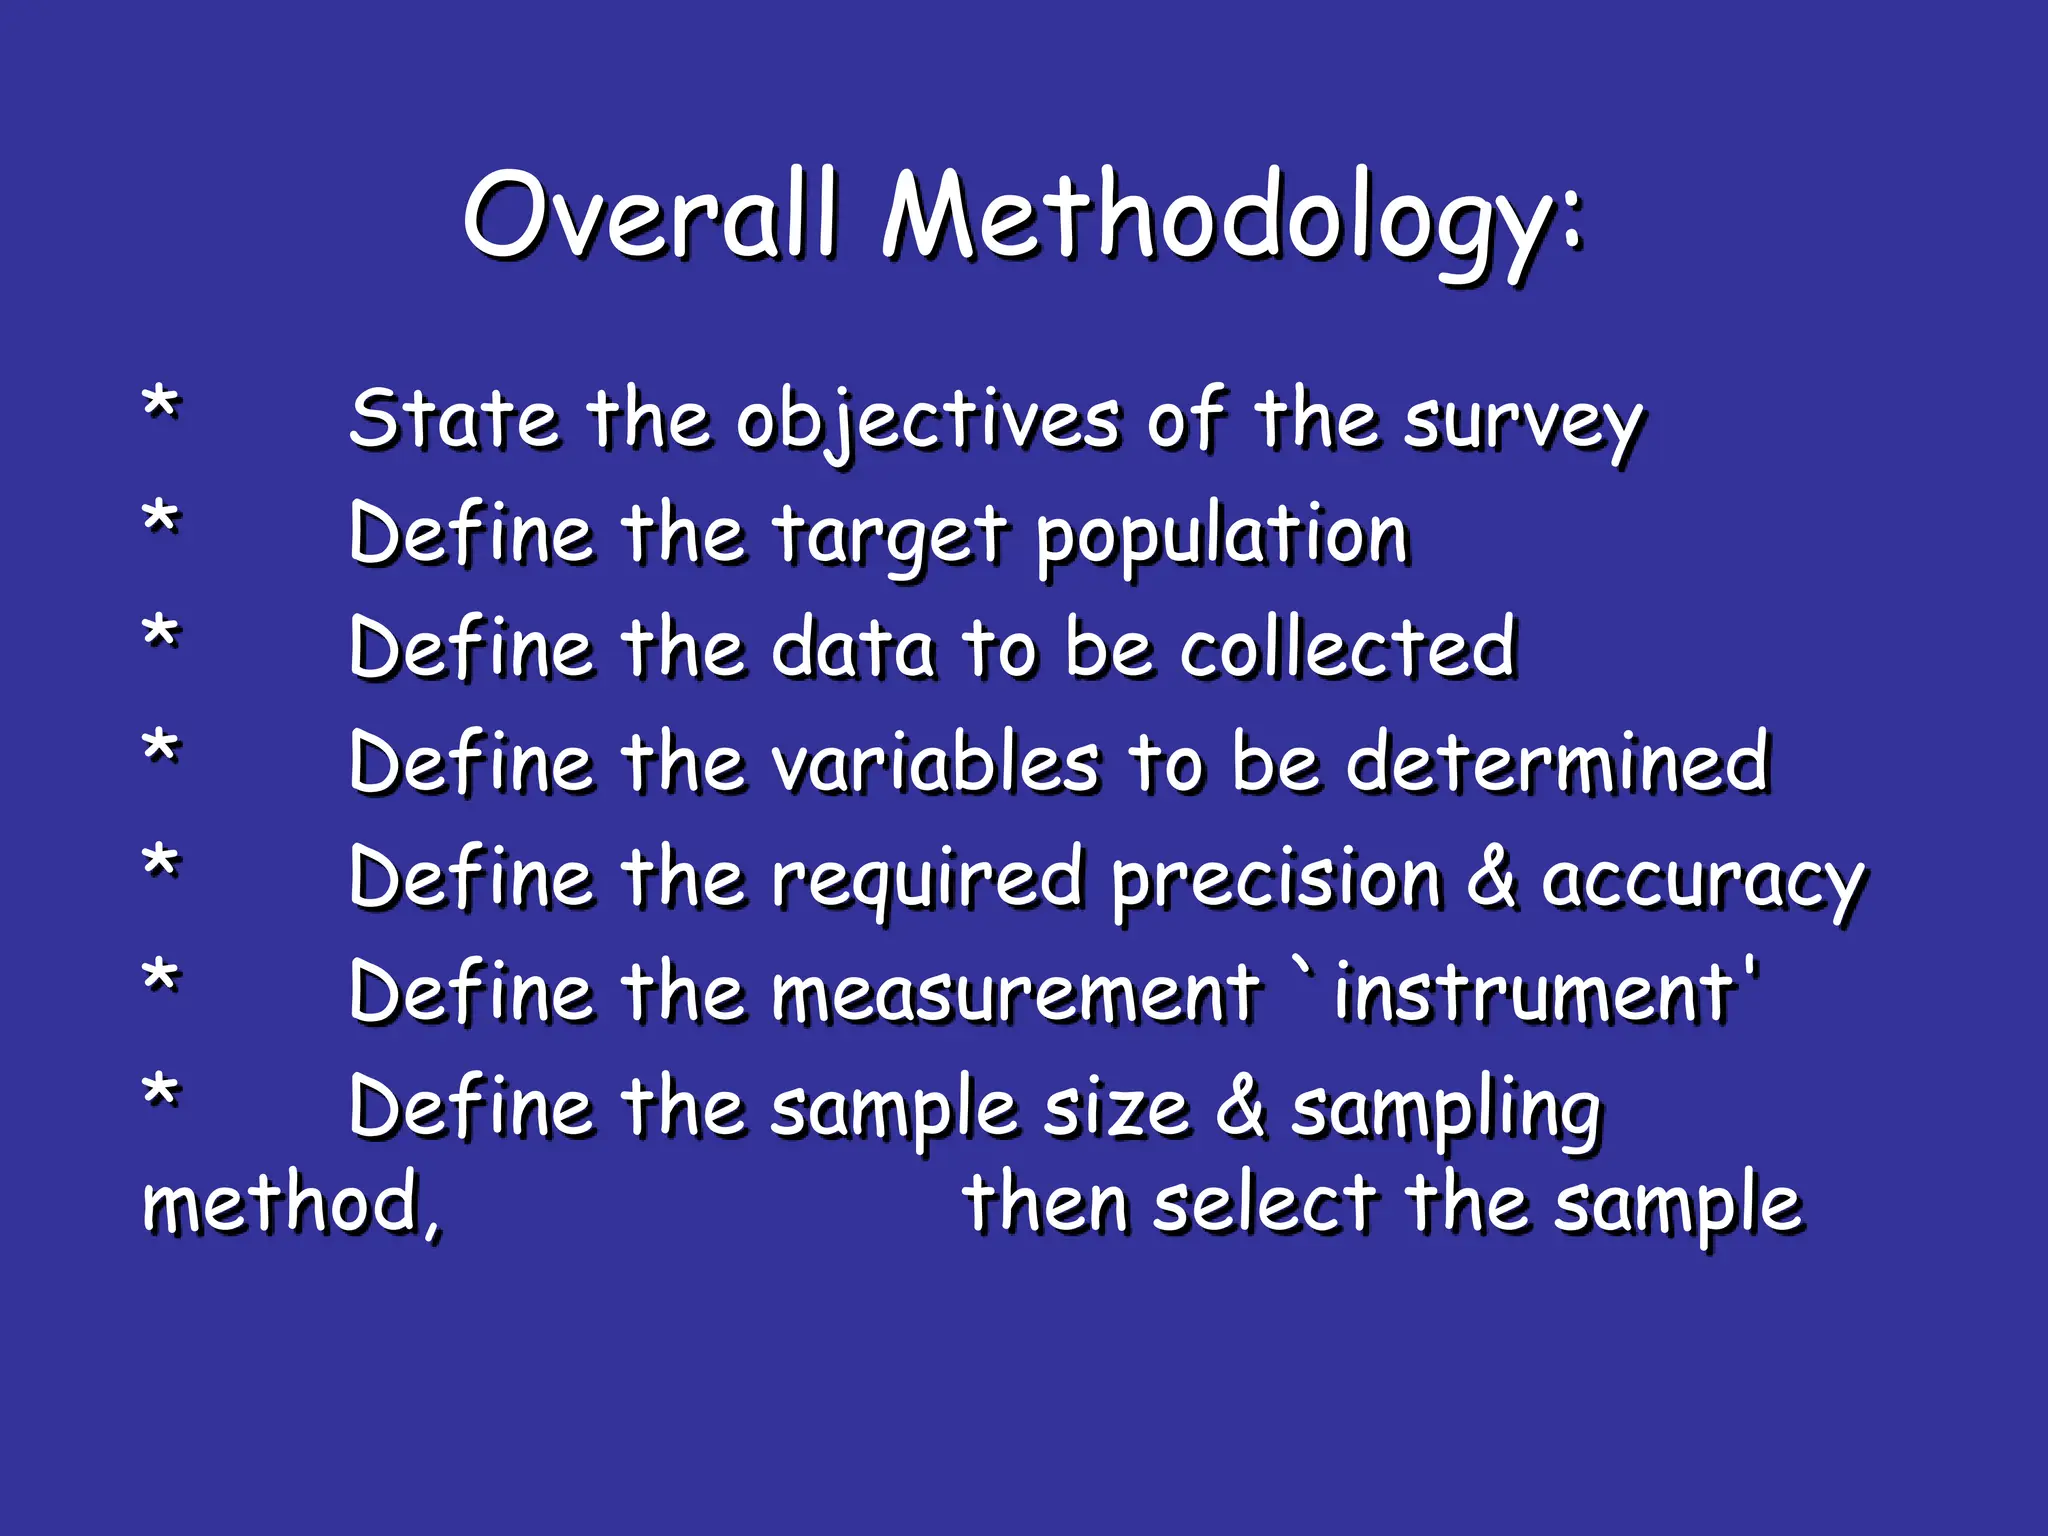
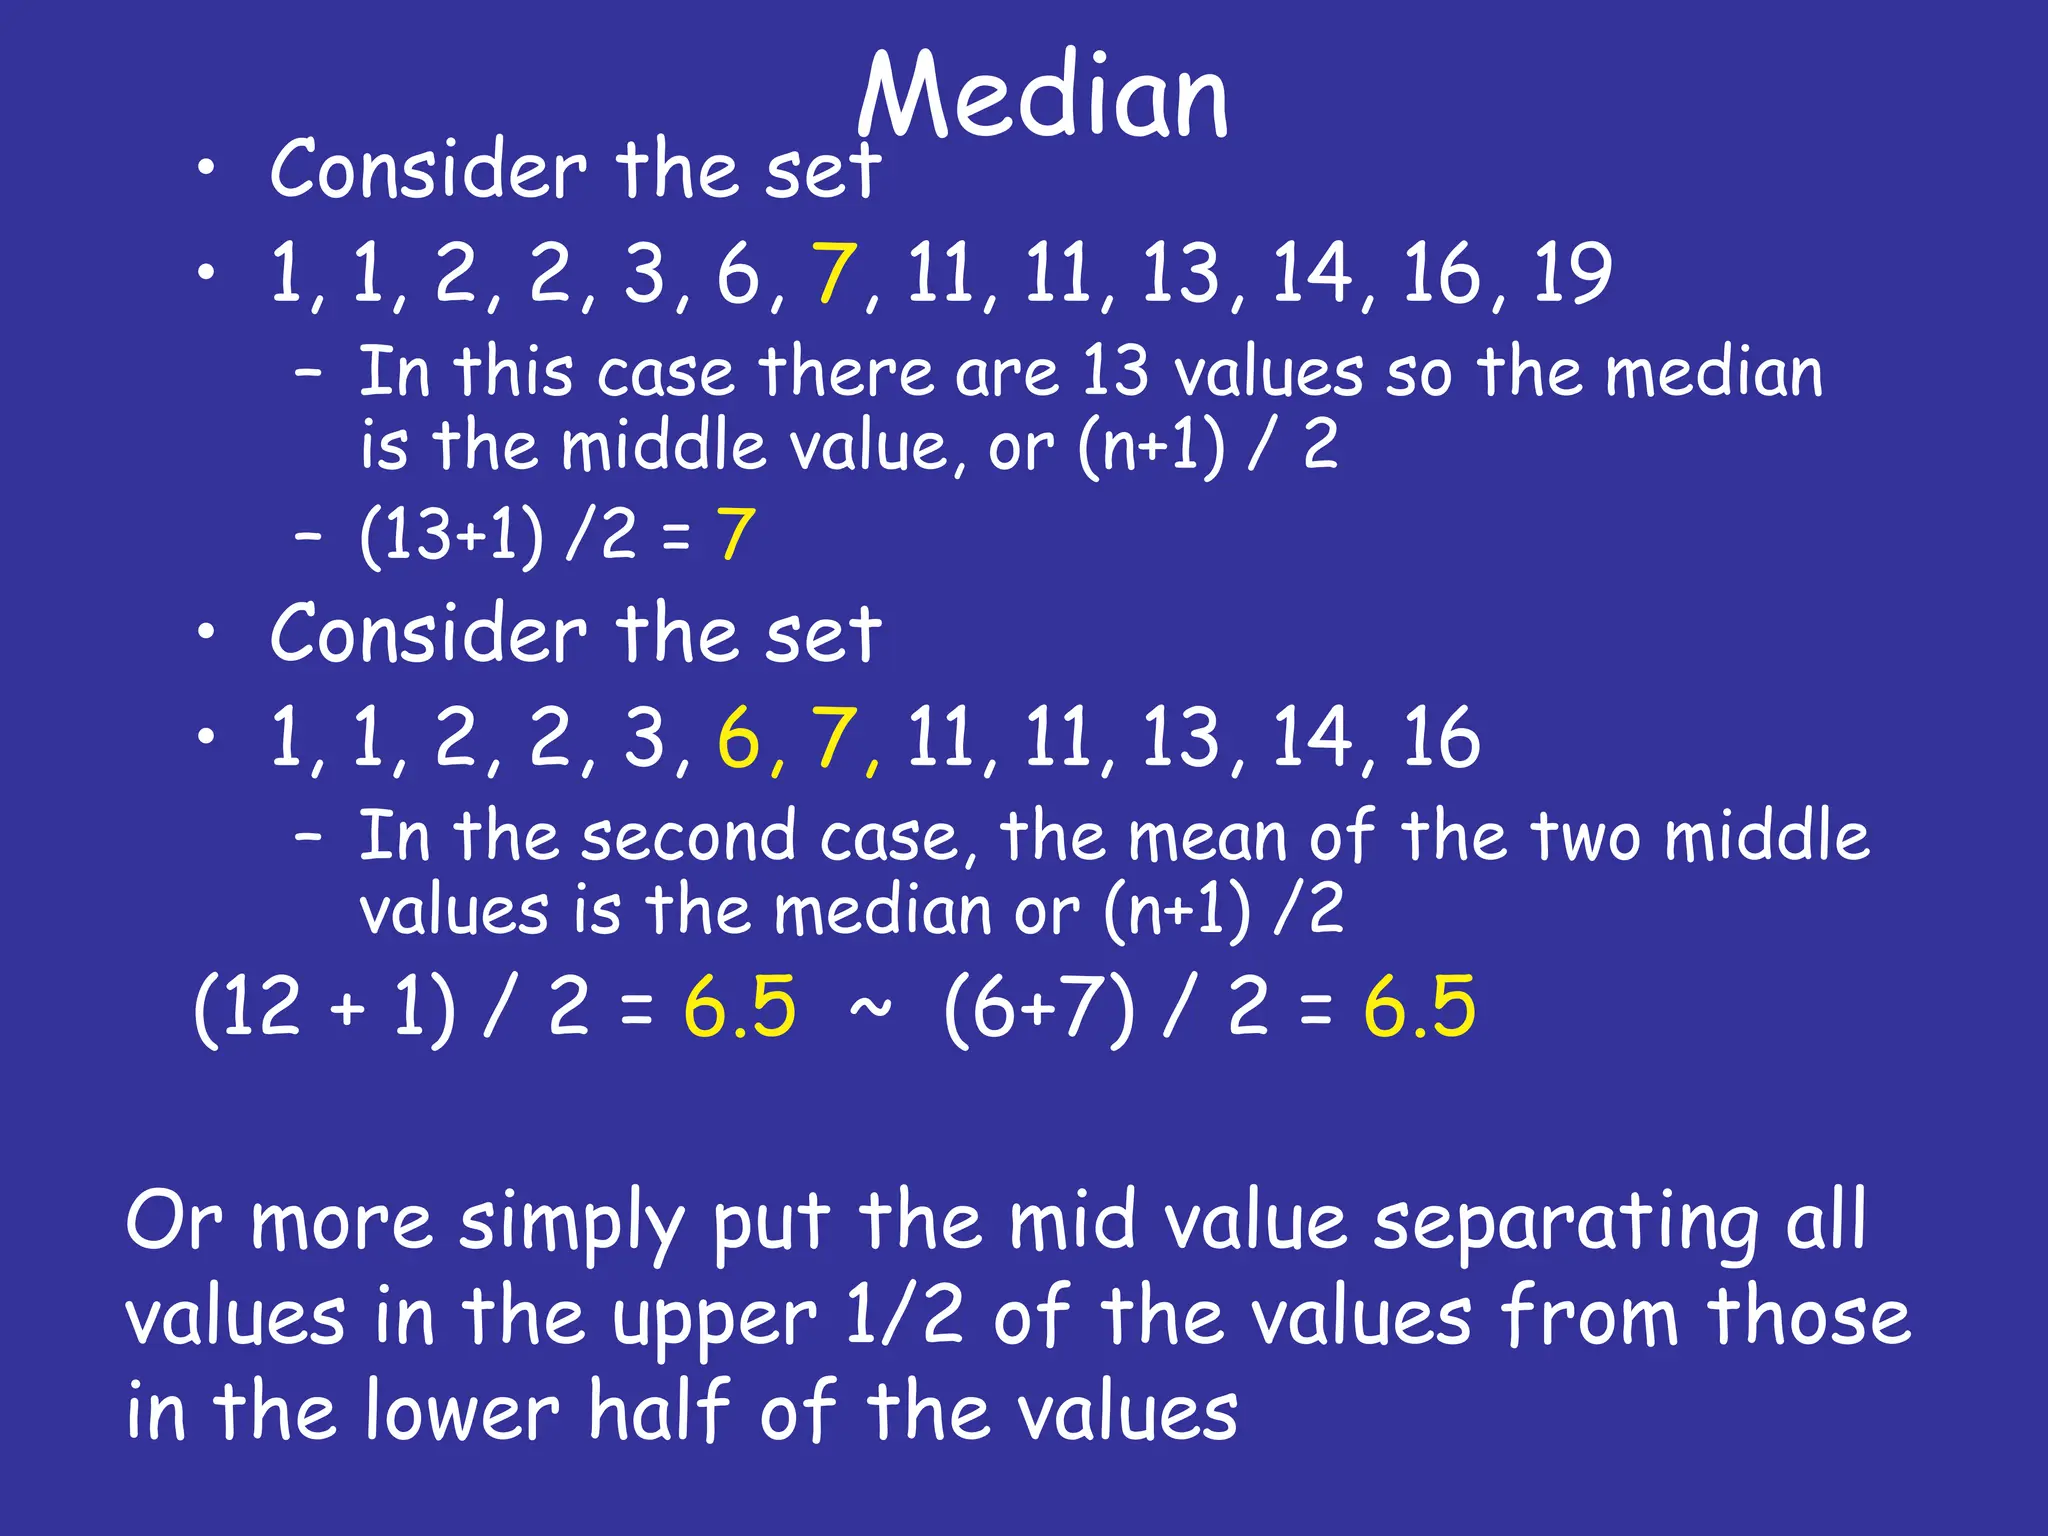
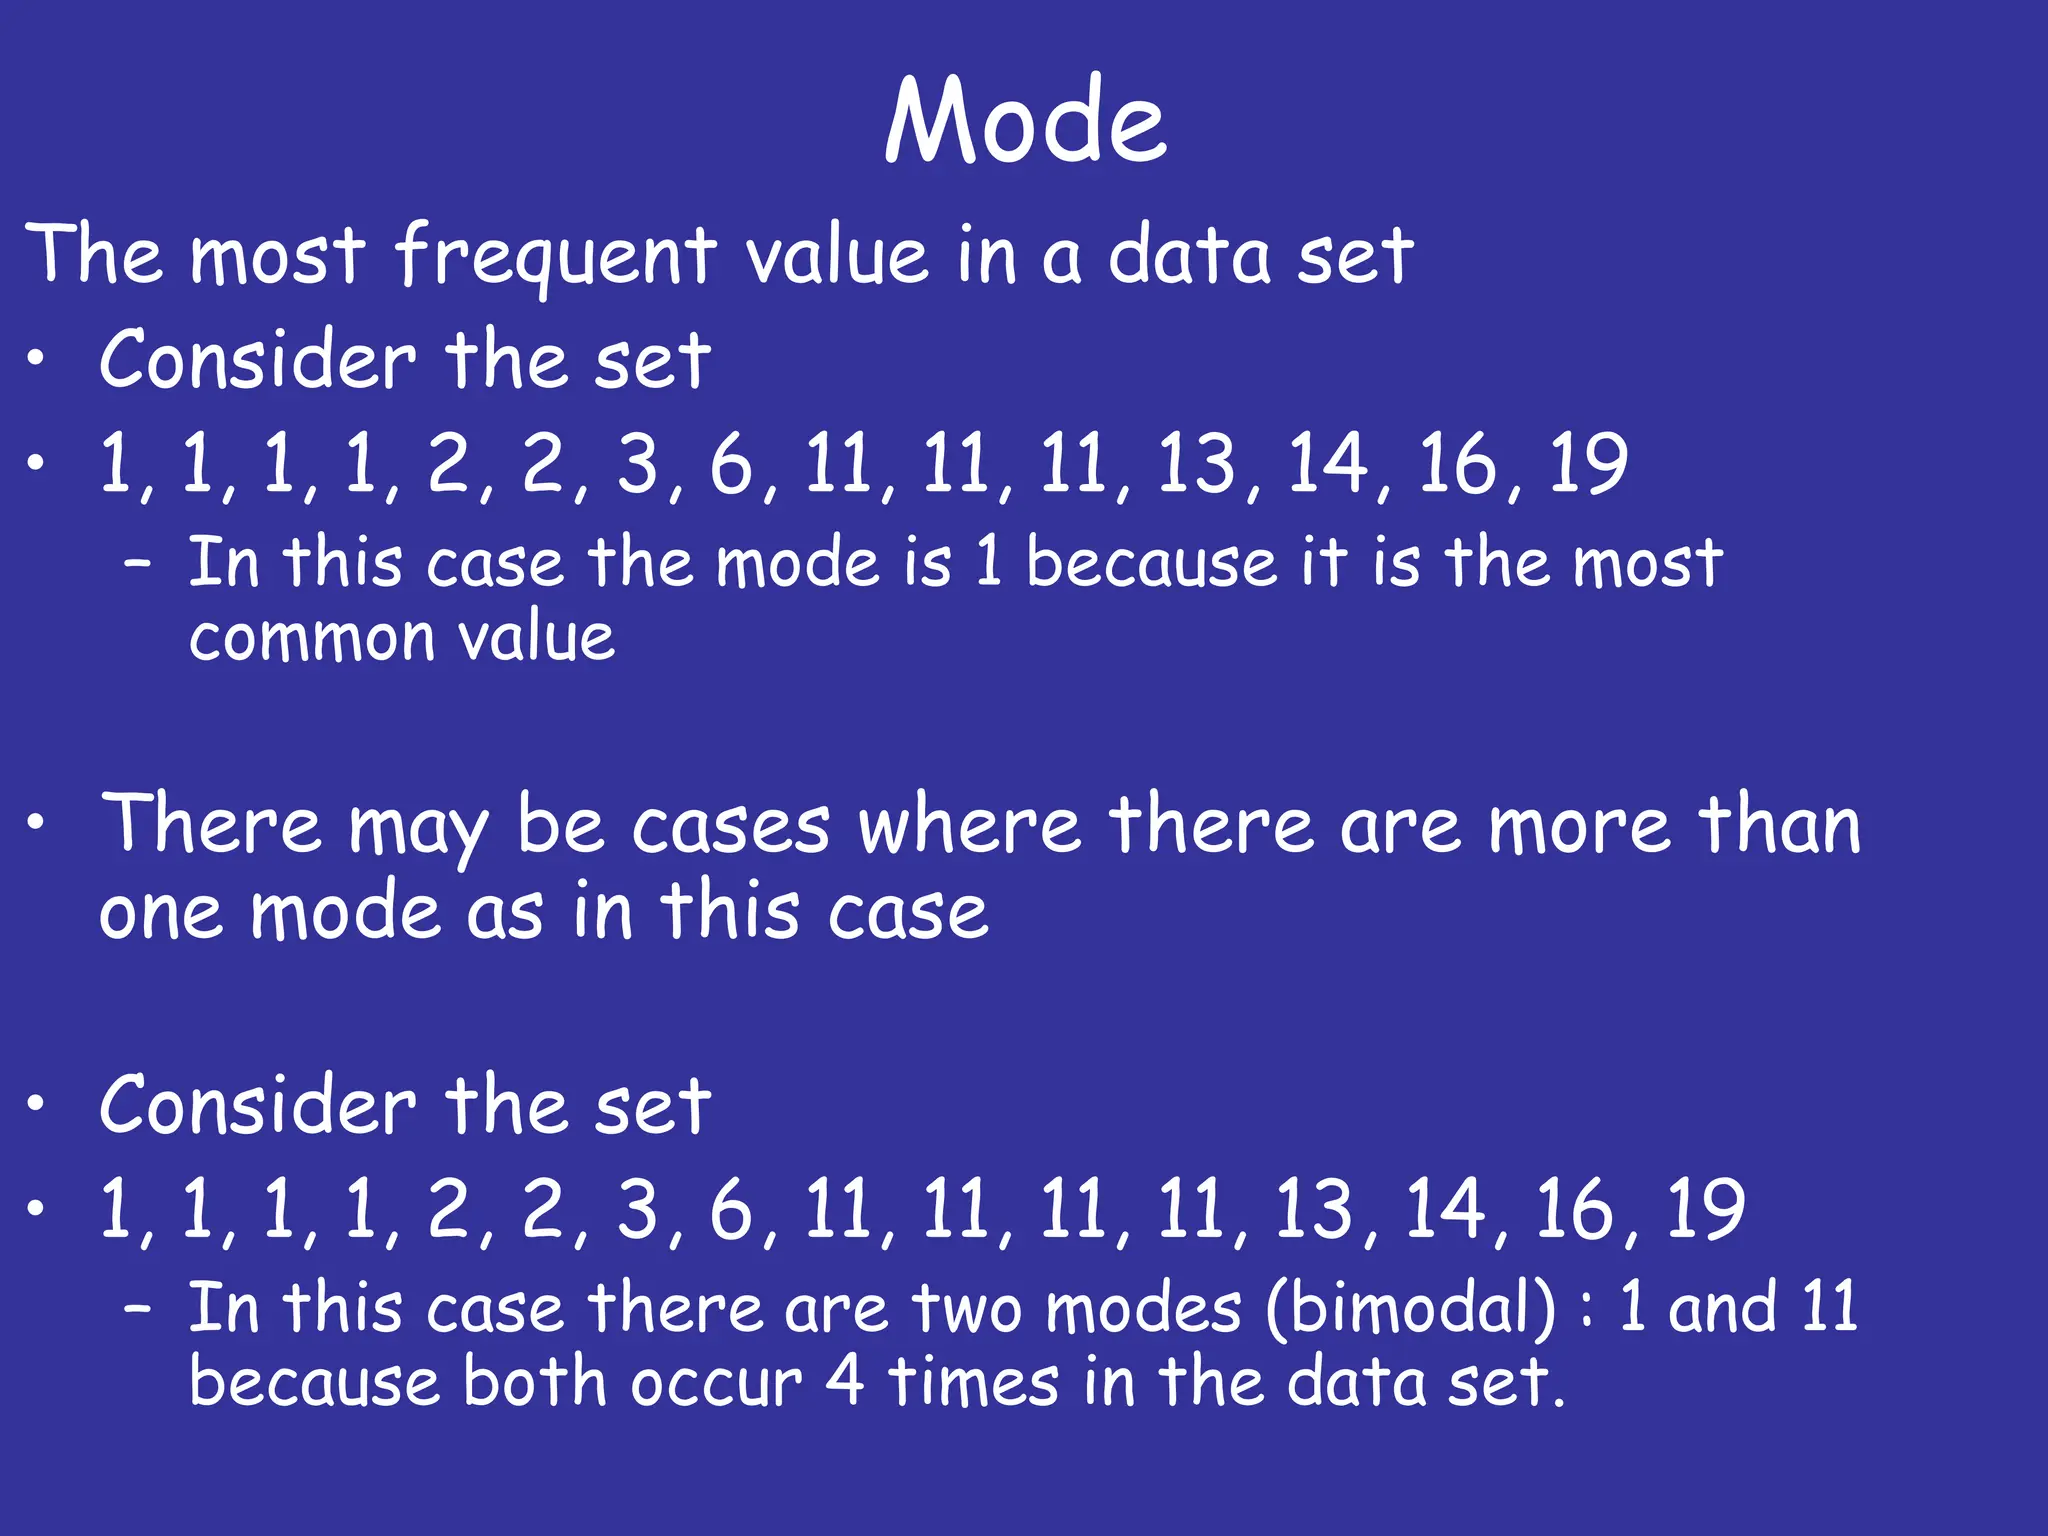
Data and Data Collection
Quantitative – Numbers, tests, counting,
measuring
Fundamentally--2 types of data
Qualitative – Words, images,
observations, conversations, photographs
Data Collection Techniques
Observations,
Tests,
Surveys,
Document analysis
(the research literature)
Quantitative Methods
Experiment: Research situation with at
least one independent variable, which is
manipulated by the researcher
Independent Variable: The variable in the
study under consideration. The cause for
the outcome for the study.
Dependent Variable: The variable being
affected by the independent variable.
The effect of the study
y = f(x)
Which is which here?
Key Factors for High Quality
Experimental Design
Data should not be contaminated by poor
measurement or errors in procedure.
Eliminate confounding variables from study or
minimize effects on variables.
Representativeness: Does your sample
represent the population you are studying?
Must use random sample techniques.
What Makes a Good
Quantitative Research Design?
4 Key Elements
1. Freedom from Bias
2. Freedom from Confounding
3. Control of Extraneous Variables
4. Statistical Precision to Test Hypothesis
Bias: When observations favor some
individuals in the population over others.
Confounding: When the effects of two
or more variables cannot be separated.
Extraneous Variables: Any variable that
has an effect on the dependent variable.
Need to identify and minimize these variables.
e.g., Erosion potential as a function of clay content.
rainfall intensity, vegetation & duration would be
considered extraneous variables.
Precision versus accuracy
"Precise" means sharply defined or
measured.
"Accurate" means truthful or correct.
Accurate
Not precise
Neither accurate
nor precise
Not accurate
But precise
Both Accurate
and Precise
Interpreting Results of
Experiments
Goal of research is to draw conclusions.
What did the study mean?
What, if any, is the cause and effect of
the outcome?
Introduction to Sampling
Sampling is the problem of accurately
acquiring the necessary data in order to
form a representative view of the
problem.
This is much more difficult to do than is
generally realized.
Overall Methodology:
* State the objectives of the survey
* Define the target population
* Define the data to be collected
* Define the variables to be determined
* Define the required precision & accuracy
* Define the measurement `instrument'
* Define the sample size & sampling
method, then select the sample
Sampling
Distributions:
When you form a sample you often show
it by a plotted distribution known as a
histogram .
A histogram is the distribution of
frequency of occurrence of a certain
variable within a specified range.
NOT A BAR GRAPH WHICH LOOKS VERY SIMILAR
Interpreting quantitative
findings
Descriptive Statistics : Mean, median,
mode, frequencies
Error analyses
Mean
• In science the term mean is really the
arithmetic mean
• Given by the equation
• X = 1/n xi
n
i=1
Or more simply put, the sum of values divided by the
number of values summed
Median
• Consider the set
• 1, 1, 2, 2, 3, 6, 7, 11, 11, 13, 14, 16, 19
– In this case there are 13 values so the median
is the middle value, or (n+1) / 2
– (13+1) /2 = 7
• Consider the set
• 1, 1, 2, 2, 3, 6, 7, 11, 11, 13, 14, 16
– In the second case, the mean of the two middle
values is the median or (n+1) /2
(12 + 1) / 2 = 6.5 ~ (6+7) / 2 = 6.5
Or more simply put the mid value separating all
values in the upper 1/2 of the values from those
in the lower half of the values
Mode
The most frequent value in a data set
• Consider the set
• 1, 1, 1, 1, 2, 2, 3, 6, 11, 11, 11, 13, 14, 16, 19
– In this case the mode is 1 because it is the most
common value
• There may be cases where there are more than
one mode as in this case
• Consider the set
• 1, 1, 1, 1, 2, 2, 3, 6, 11, 11, 11, 11, 13, 14, 16, 19
– In this case there are two modes (bimodal) : 1 and 11
because both occur 4 times in the data set.

Data and Data Collection - Quantitative and Qualitative

  • 1.
    Data and DataCollection Quantitative – Numbers, tests, counting, measuring Fundamentally--2 types of data Qualitative – Words, images, observations, conversations, photographs
  • 2.
  • 3.
    Quantitative Methods Experiment: Researchsituation with at least one independent variable, which is manipulated by the researcher
  • 4.
    Independent Variable: Thevariable in the study under consideration. The cause for the outcome for the study. Dependent Variable: The variable being affected by the independent variable. The effect of the study y = f(x) Which is which here?
  • 5.
    Key Factors forHigh Quality Experimental Design Data should not be contaminated by poor measurement or errors in procedure. Eliminate confounding variables from study or minimize effects on variables. Representativeness: Does your sample represent the population you are studying? Must use random sample techniques.
  • 6.
    What Makes aGood Quantitative Research Design? 4 Key Elements 1. Freedom from Bias 2. Freedom from Confounding 3. Control of Extraneous Variables 4. Statistical Precision to Test Hypothesis
  • 7.
    Bias: When observationsfavor some individuals in the population over others. Confounding: When the effects of two or more variables cannot be separated. Extraneous Variables: Any variable that has an effect on the dependent variable. Need to identify and minimize these variables. e.g., Erosion potential as a function of clay content. rainfall intensity, vegetation & duration would be considered extraneous variables.
  • 8.
    Precision versus accuracy "Precise"means sharply defined or measured. "Accurate" means truthful or correct.
  • 9.
    Accurate Not precise Neither accurate norprecise Not accurate But precise Both Accurate and Precise
  • 10.
    Interpreting Results of Experiments Goalof research is to draw conclusions. What did the study mean? What, if any, is the cause and effect of the outcome?
  • 11.
    Introduction to Sampling Samplingis the problem of accurately acquiring the necessary data in order to form a representative view of the problem. This is much more difficult to do than is generally realized.
  • 12.
    Overall Methodology: * Statethe objectives of the survey * Define the target population * Define the data to be collected * Define the variables to be determined * Define the required precision & accuracy * Define the measurement `instrument' * Define the sample size & sampling method, then select the sample
  • 13.
    Sampling Distributions: When you forma sample you often show it by a plotted distribution known as a histogram . A histogram is the distribution of frequency of occurrence of a certain variable within a specified range. NOT A BAR GRAPH WHICH LOOKS VERY SIMILAR
  • 16.
    Interpreting quantitative findings Descriptive Statistics: Mean, median, mode, frequencies Error analyses
  • 17.
    Mean • In sciencethe term mean is really the arithmetic mean • Given by the equation • X = 1/n xi n i=1 Or more simply put, the sum of values divided by the number of values summed
  • 18.
    Median • Consider theset • 1, 1, 2, 2, 3, 6, 7, 11, 11, 13, 14, 16, 19 – In this case there are 13 values so the median is the middle value, or (n+1) / 2 – (13+1) /2 = 7 • Consider the set • 1, 1, 2, 2, 3, 6, 7, 11, 11, 13, 14, 16 – In the second case, the mean of the two middle values is the median or (n+1) /2 (12 + 1) / 2 = 6.5 ~ (6+7) / 2 = 6.5 Or more simply put the mid value separating all values in the upper 1/2 of the values from those in the lower half of the values
  • 19.
    Mode The most frequentvalue in a data set • Consider the set • 1, 1, 1, 1, 2, 2, 3, 6, 11, 11, 11, 13, 14, 16, 19 – In this case the mode is 1 because it is the most common value • There may be cases where there are more than one mode as in this case • Consider the set • 1, 1, 1, 1, 2, 2, 3, 6, 11, 11, 11, 11, 13, 14, 16, 19 – In this case there are two modes (bimodal) : 1 and 11 because both occur 4 times in the data set.