More Related Content
Similar to Stanley_Kolosovskiy_Capstone_Poster (20)
Stanley_Kolosovskiy_Capstone_Poster
- 1. RESEARCH POSTER PRESENTATION DESIGN © 2015
www.PosterPresentations.com
Aquaponics combines aquaculture and growing plants in a soilless
media in a recirculating system. The effluent from the fish provides
the nutrients required by plants to grow. The uptake of nutrients
from the water purifies the water for the fish allowing the system
to produce fish and vegetables while generating no waste
effluent. This experiment seeks to optimize the design of a
compact home aquaponics system by utilizing current advances in
technology to create a low maintenance, semi-automated working
prototype. This design has multiple features: Firstly, custom LED
grow lights were built to maximize plant growth while minimizing
electricity usage. Secondly, electronic monitoring systems were
designed to record crucial water quality data to ensure smooth
operation of the system. Lastly, amphipods were introduced to
have in situ mineralization of organic solids in the system.
Abstract
Objectives
Preliminary Design
• More research needs to be done on the viability of this compact
aquaponics system. Topics that could be studied are production rates of
different produce, fish growth, effectiveness of the amphipods in
mineralizing organic solid waste, and plant growth on the specially
designed LED lights.
• From a purely observational perspective, the system functions as it
should. Plants have healthy roots and leaves, fish growth is apparent,
and the monitoring systems record data and control the lights and
pumps without an issue.
• The Arduino/Raspberry Pi monitoring system works well for data
collection. This shows that it is possible to build a low cost data
collection system (Arduino $5, Raspberry Pi $35, water level sensor
($1, temperature sensor $2, flow sensor $3).
Discussion
Final Prototype
Contact
Stanley Kolosovskiy
Major: Environmental Science, Watershed Management Focus
Minor: Technology and Information Management
schashch@syr.edu
(347) 609 - 5103
1. Create an aquaponics system that utilizes current technology to make it
a more effective way of producing food.
2. Implement these features:
• Maximize vertical grow space.
• Design energy efficient LED lights with an emphasis on utilizing
maximum PAR ratings.
• Introduce amphipods into the system to have in situ mineralization of
organic solids.
• Build DIY monitoring systems using Arduino technology. Implement
flow, pH, temperature, water level sensors along with relays to control
power to the lights and pumps.
• Build a home server using a Raspberry Pi to record all the data collected
by the Arduino.
• Set up a website to be able to access the data on the home server
remotely.
3. Provide a 3D model that accurately depicts all components used to build
the system so anybody can replicate the design.
4. Make all the code used in the monitoring portion of the design open
source for easy replication.
Department of Environmental Science, State University of New York, College of Environmental Science and Forestry, Syracuse, NY
Stanley Kolosovskiy
Designing an Optimized Indoor Aquaponic System
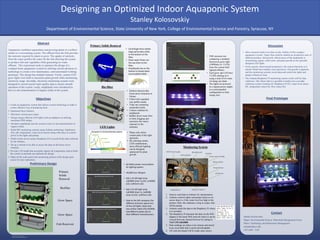
Primary
Solids
Removal
Biofilter
Grow Space
Grow Space
Fish Reservoir
Primary Solids Removal
• Centrifugal force settles
large particulate solids
to the bottom of the
filter.
• Clean water flows out
the top drain to bio-
filter.
• Amphipods live on the
bottom to break down
accumulated solids.
Bio-filter
• Harbors bacteria that
break down Ammonia to
Nitrate.
• Filled with expanded
clay pebble media.
• Traps any remaining
suspended solids.
• Creates a habitat for
amphipods.
• Baffles divert water flow
to limit clogging and
maximize the waters
exposure to the
substrate.
0
500
1000
1500
2000
2500
0 0.5 1 1.5 2 2.5 3 3.5 4 4.5
Photosyntheticallyactiveradiation(µmol)
Distance from Light Source (inches)
Photosynthetically Active Radiation Emission CFL vs LED
Compact Fluorescent LED model 1 LED model 2
0
1000
2000
3000
4000
0 200 400 600 800 1000
LightIntensity(µmol)
Wavelength (nm)
3200K LED Emission at 3.3V
0
1000
2000
3000
4000
0 200 400 600 800 1000
LightIntensity(µmol)
Wavelength (nm)
Blue LED (455nm) Emission at 3.3V
0
500
1000
1500
2000
2500
0 200 400 600 800 1000
LightIntensity(µmol)
Wavelength (nm)
6500K LED Emission at 3.3V (manufacturer 1)
• Plants only utilize
certain parts of the light
spectrum.
• By selecting certain
LED combinations,
more efficient lighting
can be designed,
optimized for plant
growth.
LED Lights
1. Sensors send data to Arduino for interpretation.
2. Arduino controls lights and pumps based on set
sensor data (i.e if the water level too high in the
primary filter, this indicates a clog in a pipe, shut
off the pump).
3. Arduino sends the data to the Raspberry Pi where
it is recorded.
4. The Raspberry Pi transmits the data via the Wifi
adapter to the home Wifi network where it can be
viewed from any internet browser by typing in
74.67.195.168:8080.
5. Data readings are taken every minute and stored
in an excel table that is easily downloadable.
6. All code developed will be made open source.
• PAR emission test
comparing a standard
fluorescent grow light
(100Watts) to 3 LEDs
from the custom built
lights(6.6Watts).
• Each grow spot will have
3 LEDs shining on it
using a total of 6.6 watts
of energy per plant.
• The lights are powered
by a laptop power supply
in a series/parallel
configuration to limit
energy loss.
• 66 Watts power consumption
for lighting system.
• 50,000 hour lifespan.
• Rail 1 of LED light strip:
1x6500K (man 1) LED, 1x3200K
LED, 1x455nm LED.
• Rail 2 of LED light strip:
1x6500K (man 1), 1x6500K
(man 2) LED, 1x455nm LED.
• Data to the left compares the
different emission spectrums
of the LED lights. Note that
two similar rated LEDs (6500K)
had different peaks due to
their different manufacturers.
Monitoring System
0
200
400
600
800
1000
1200
0 200 400 600 800 1000
LightIntensity(µmol)
Wavelength (nm)
6500K LED Emission at 3.3V (manufacturer 2)