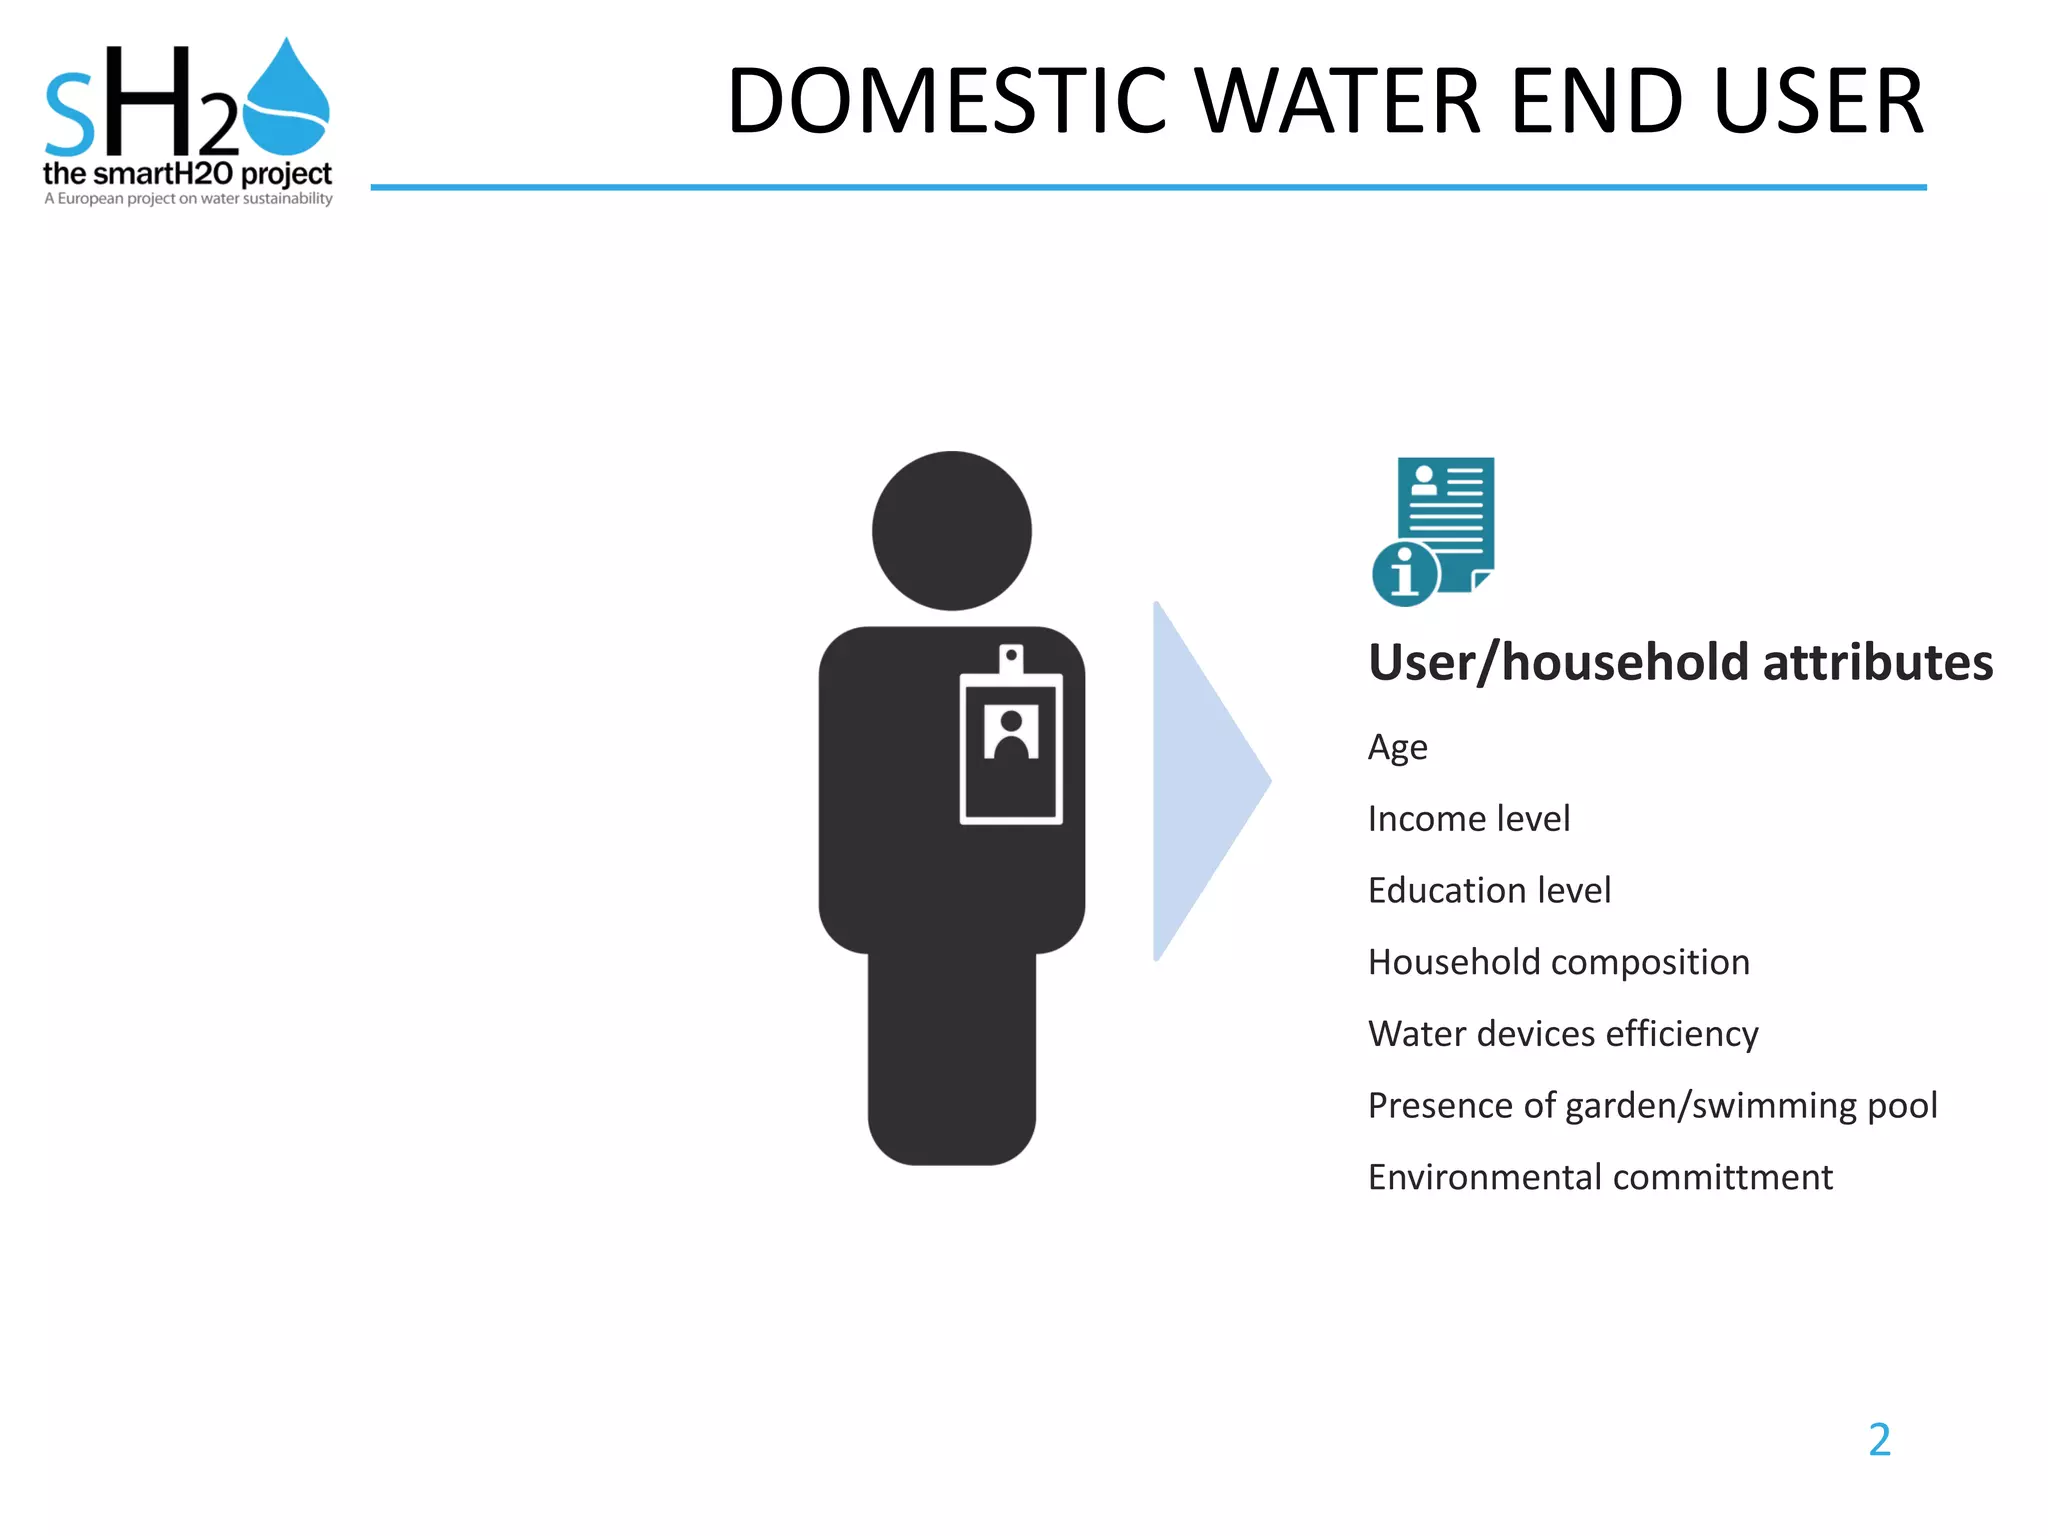
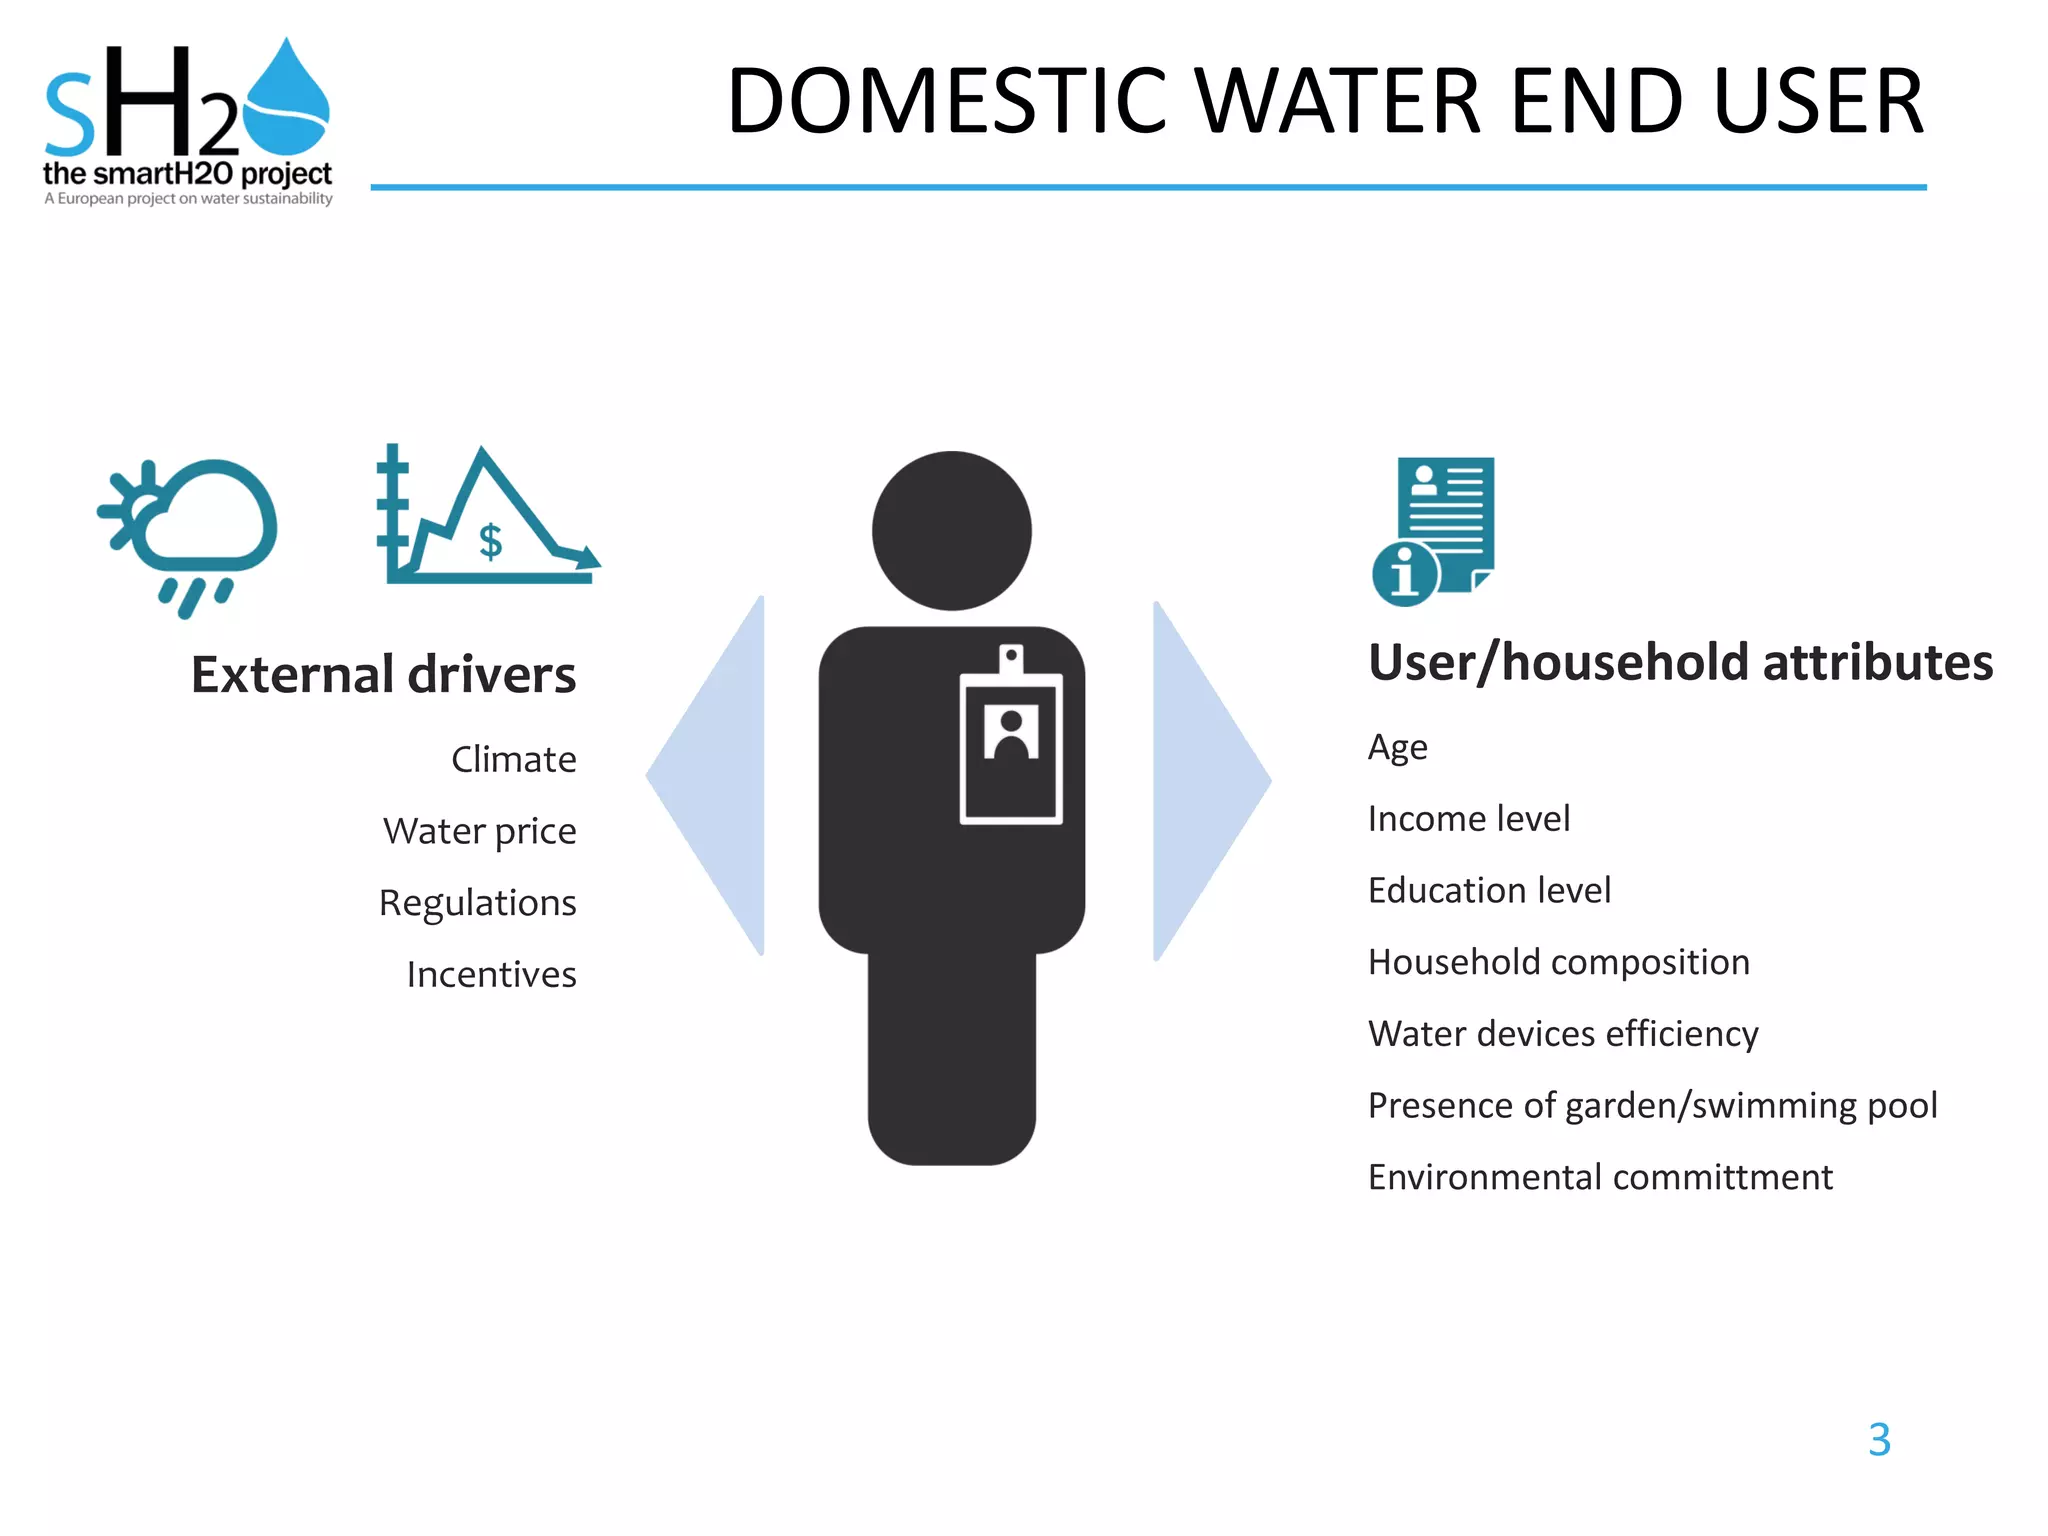
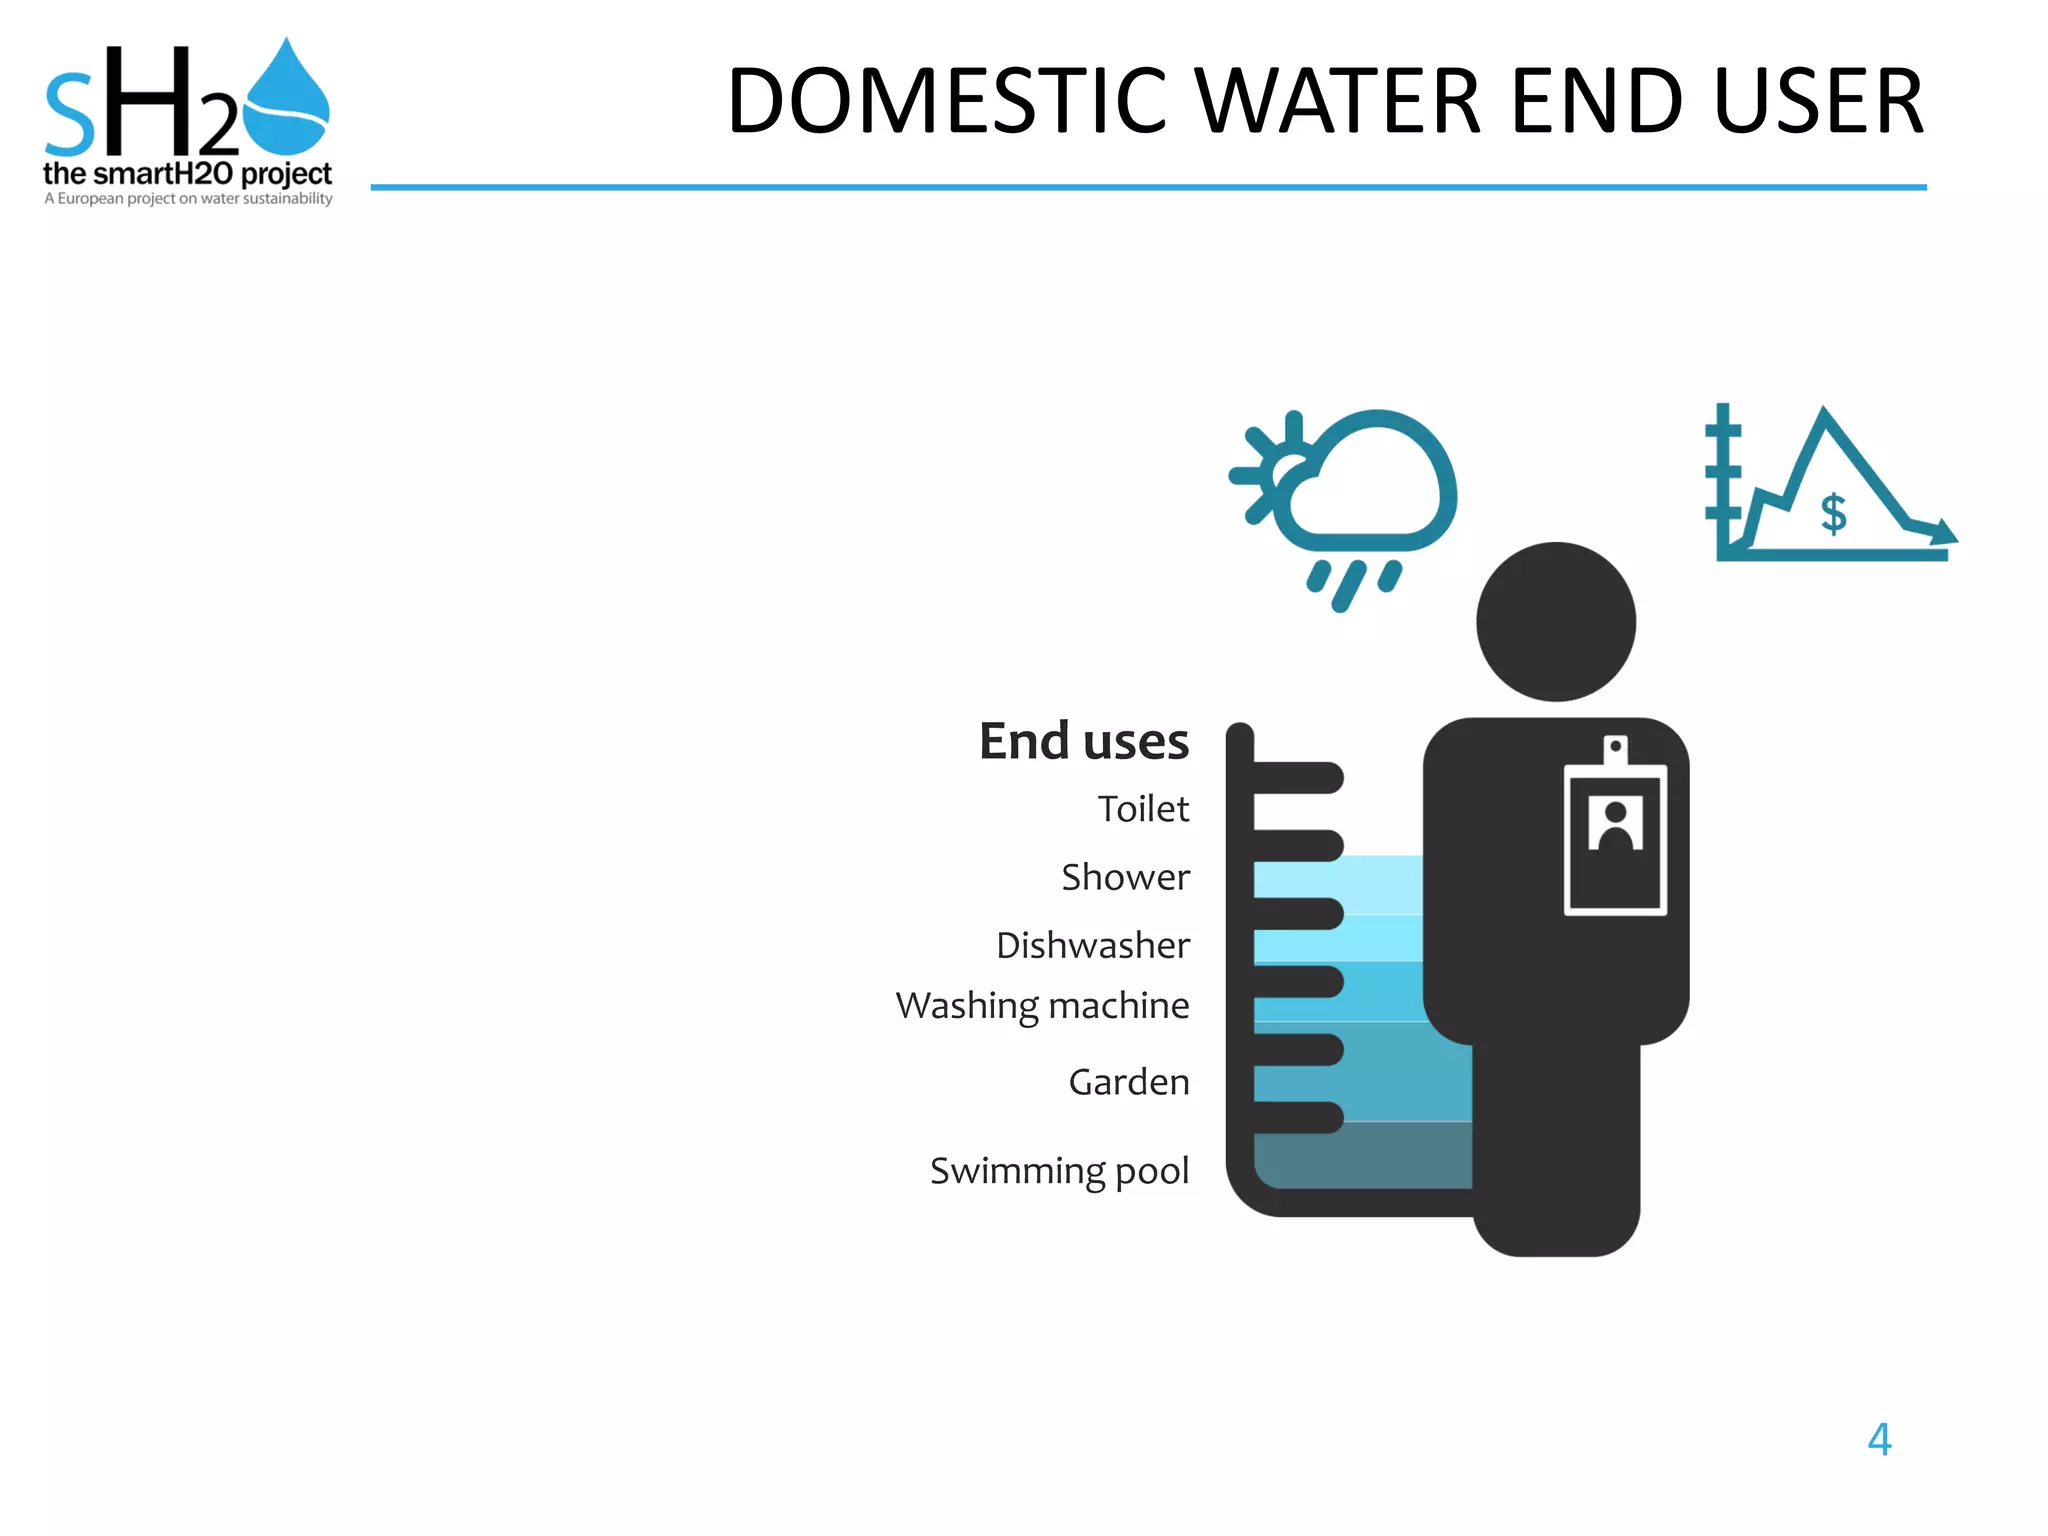
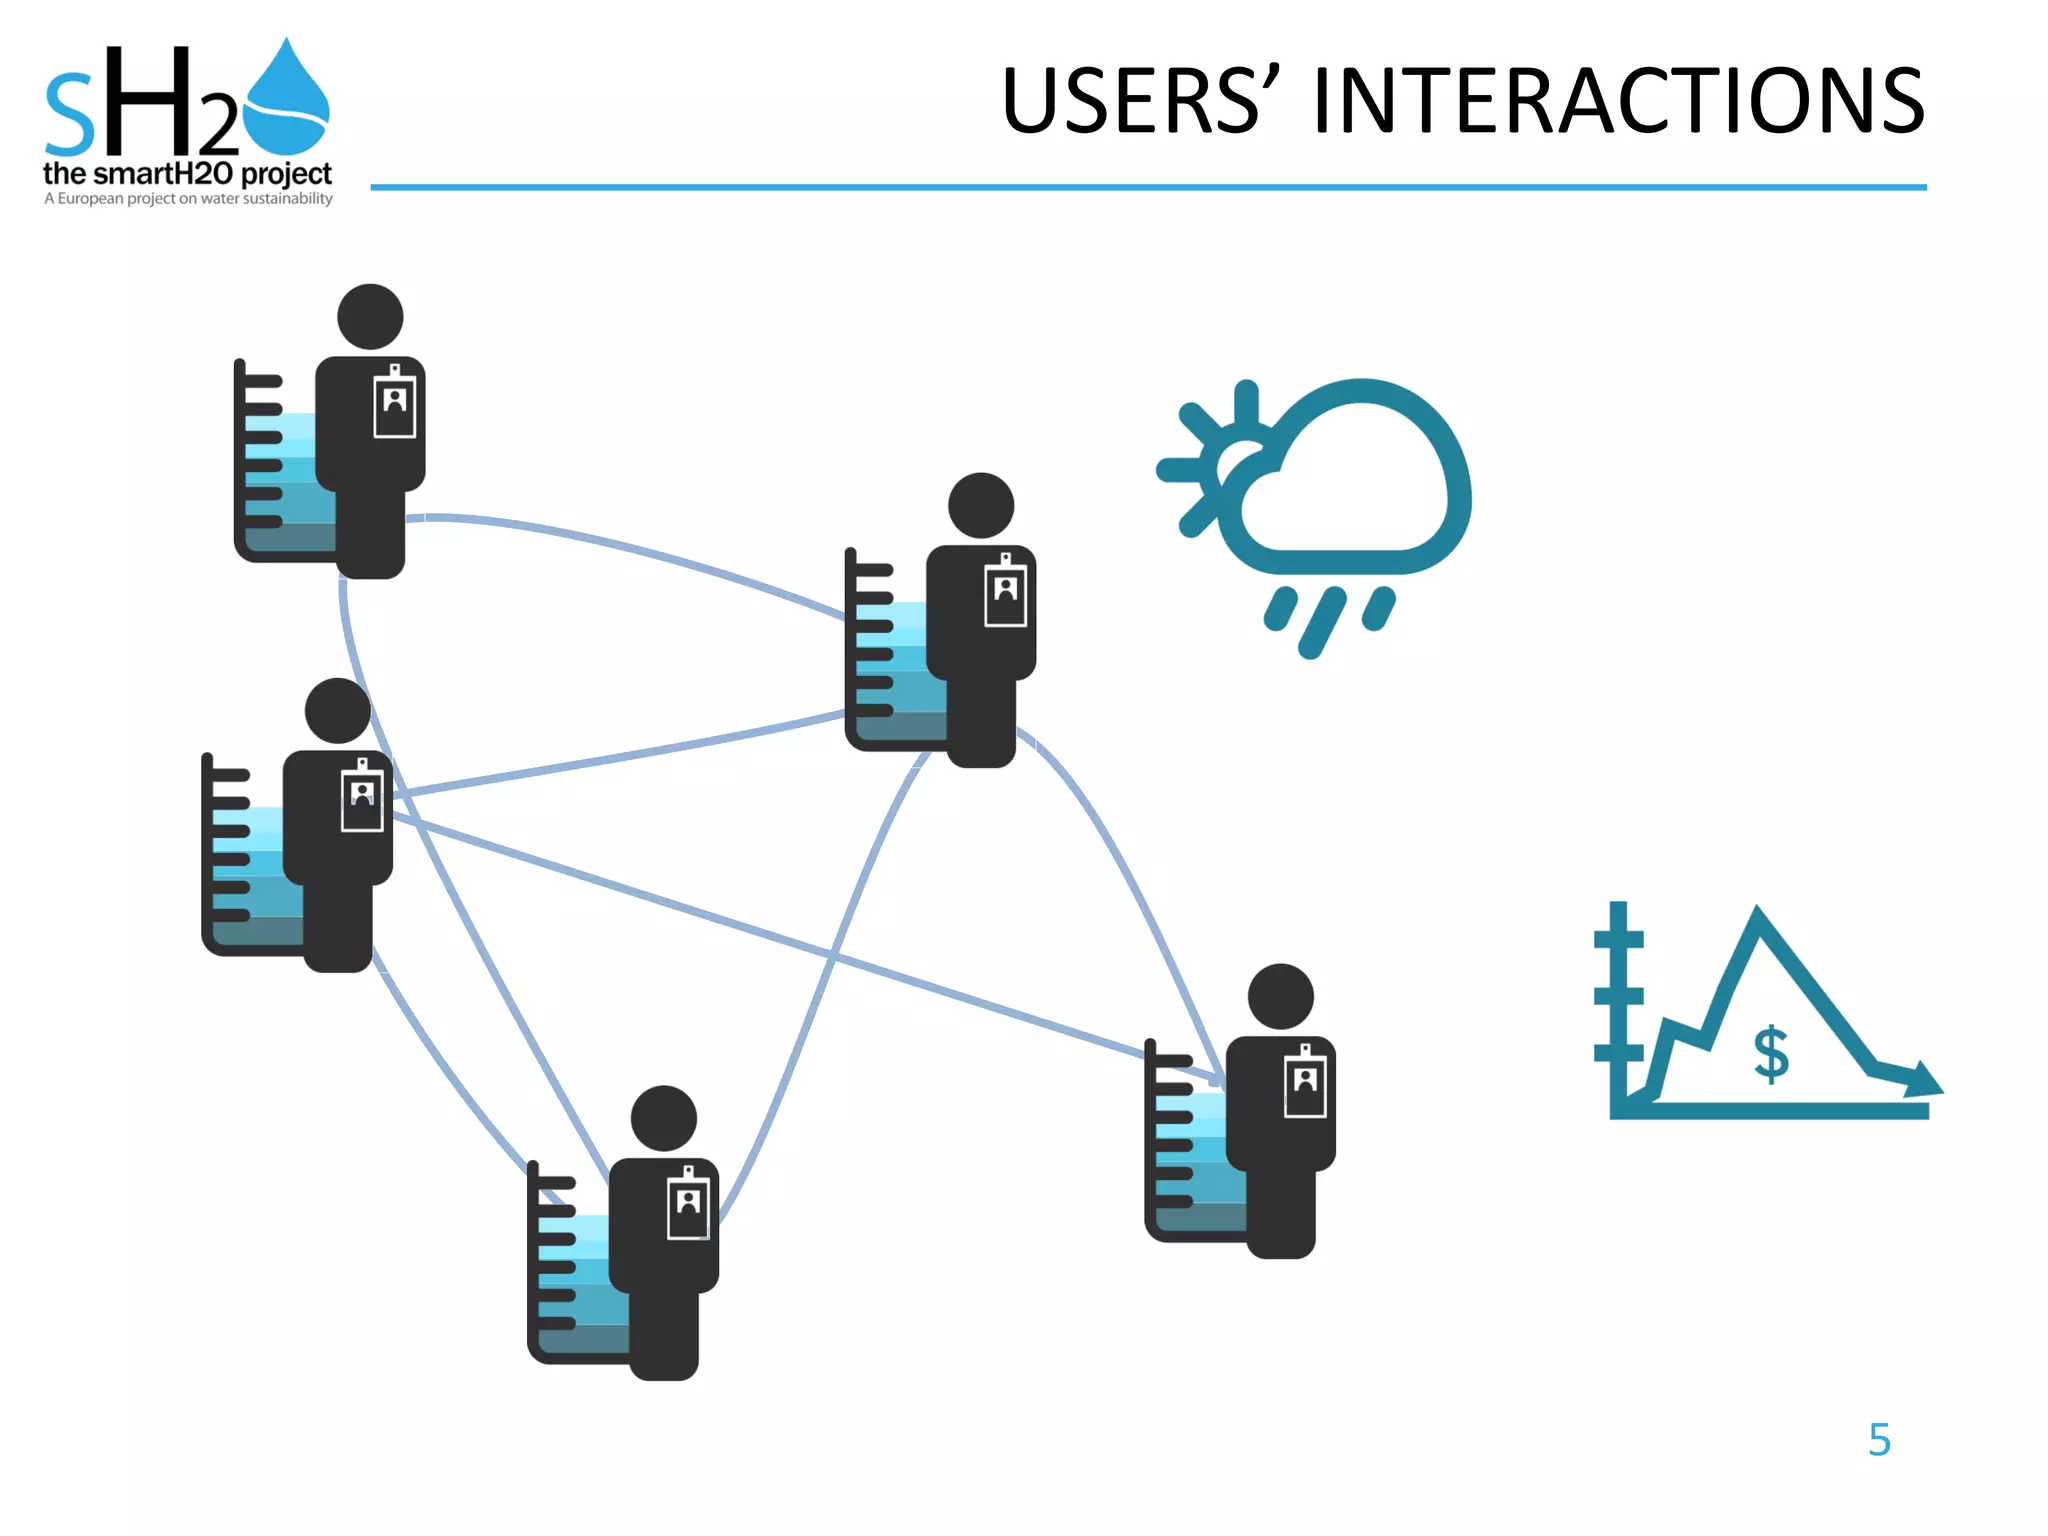
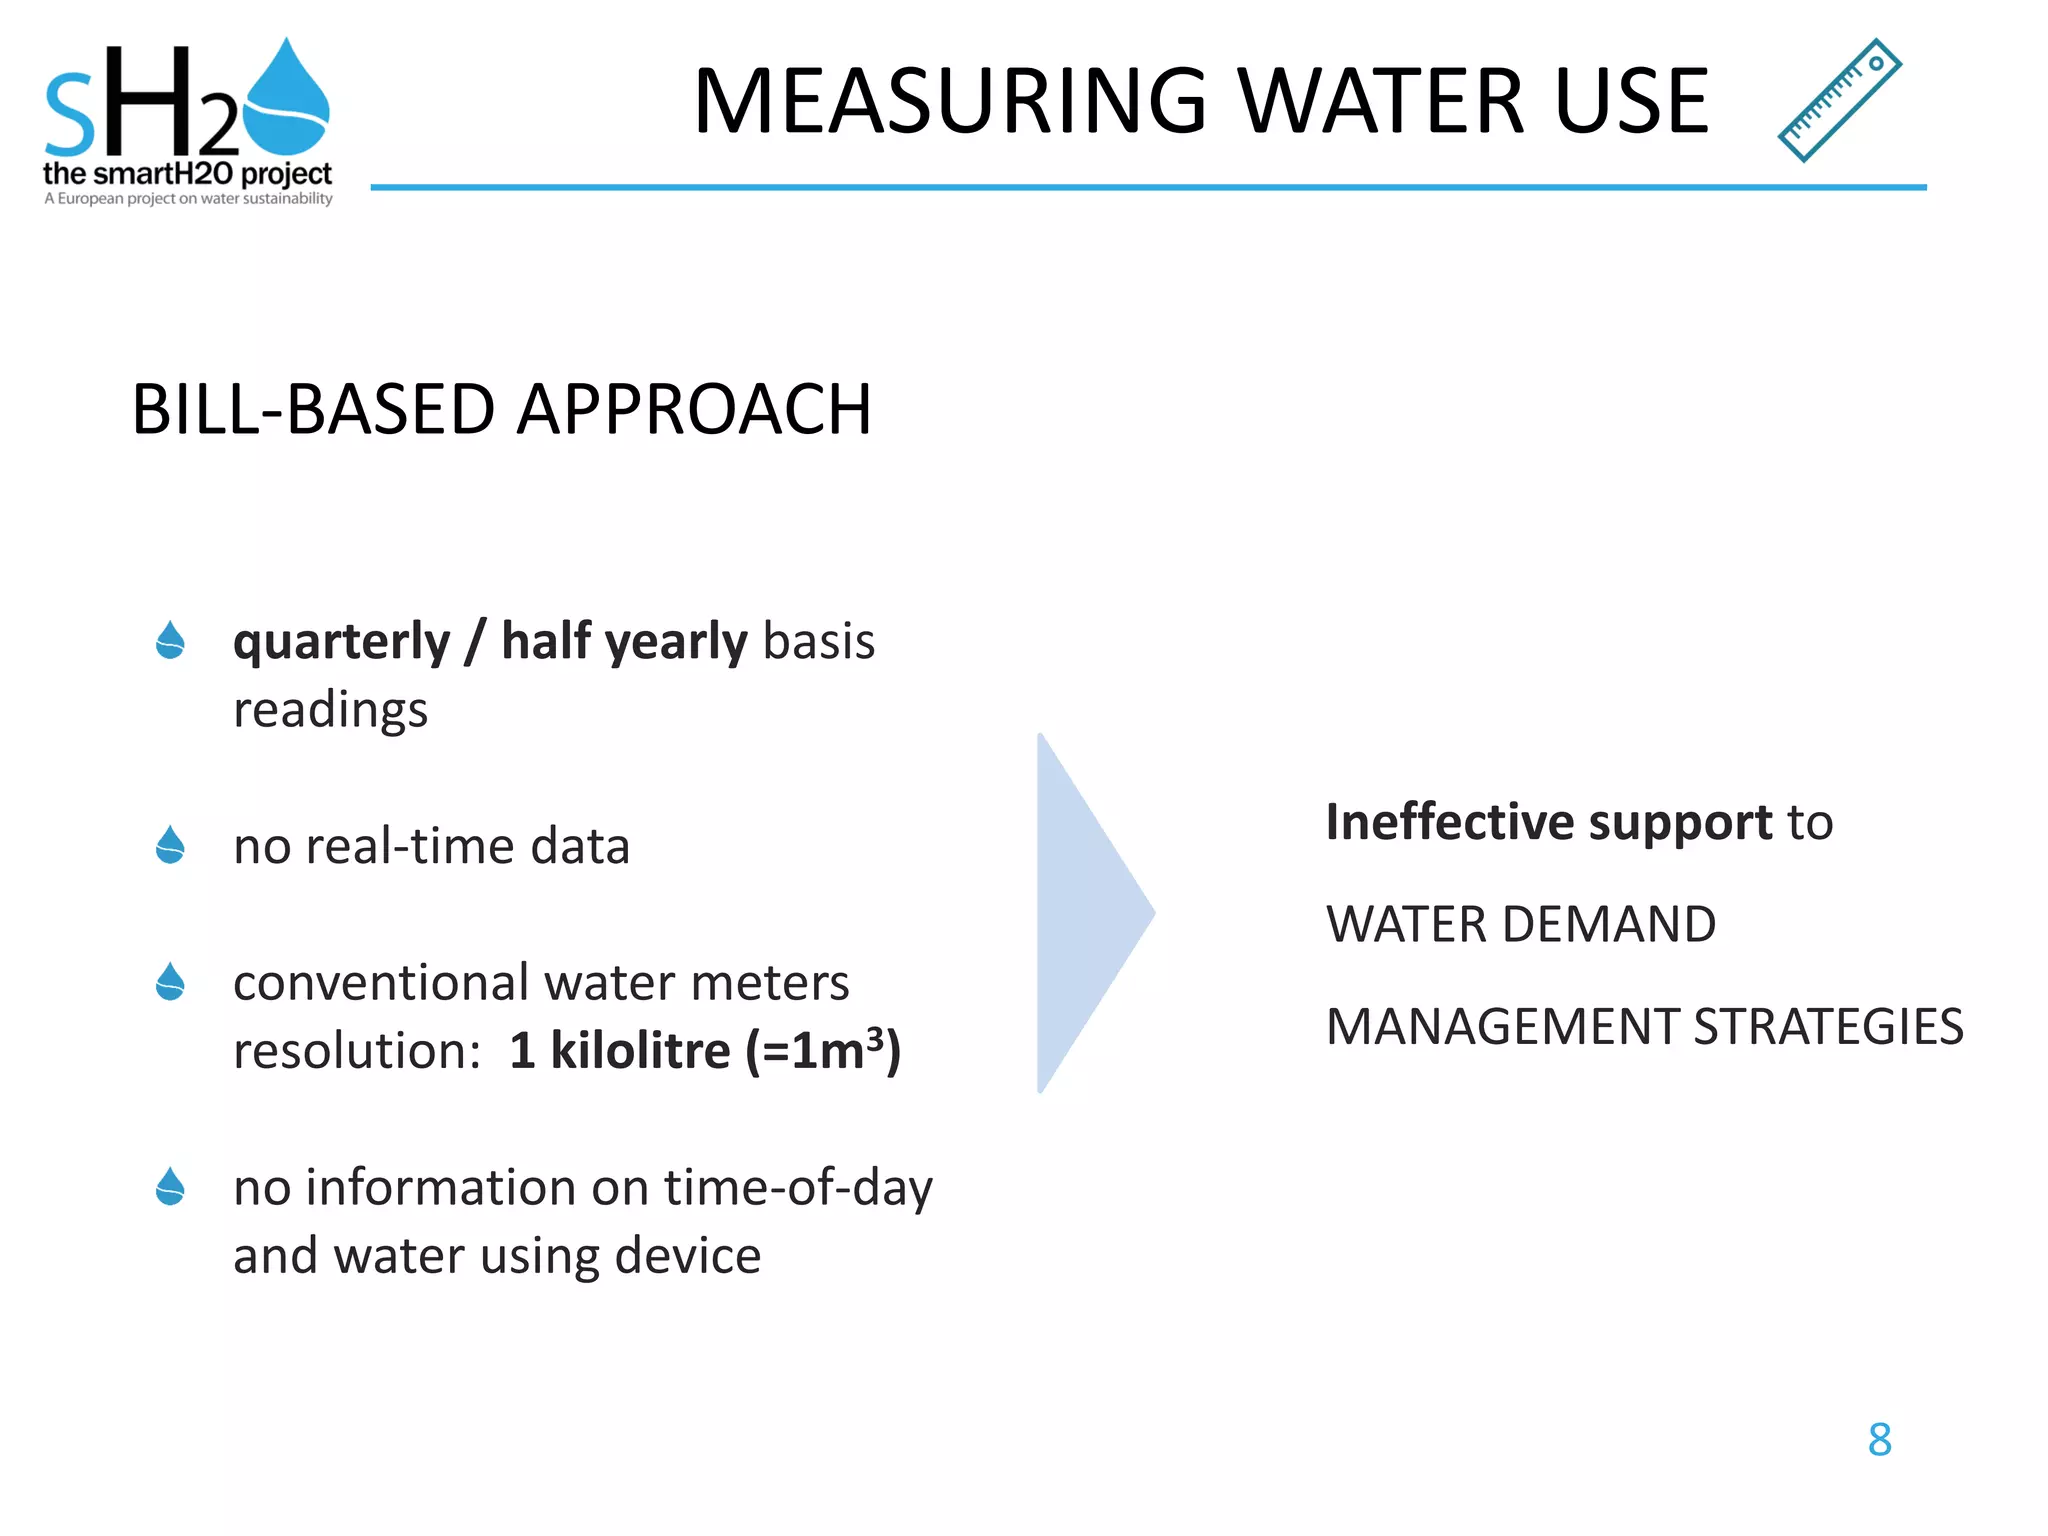
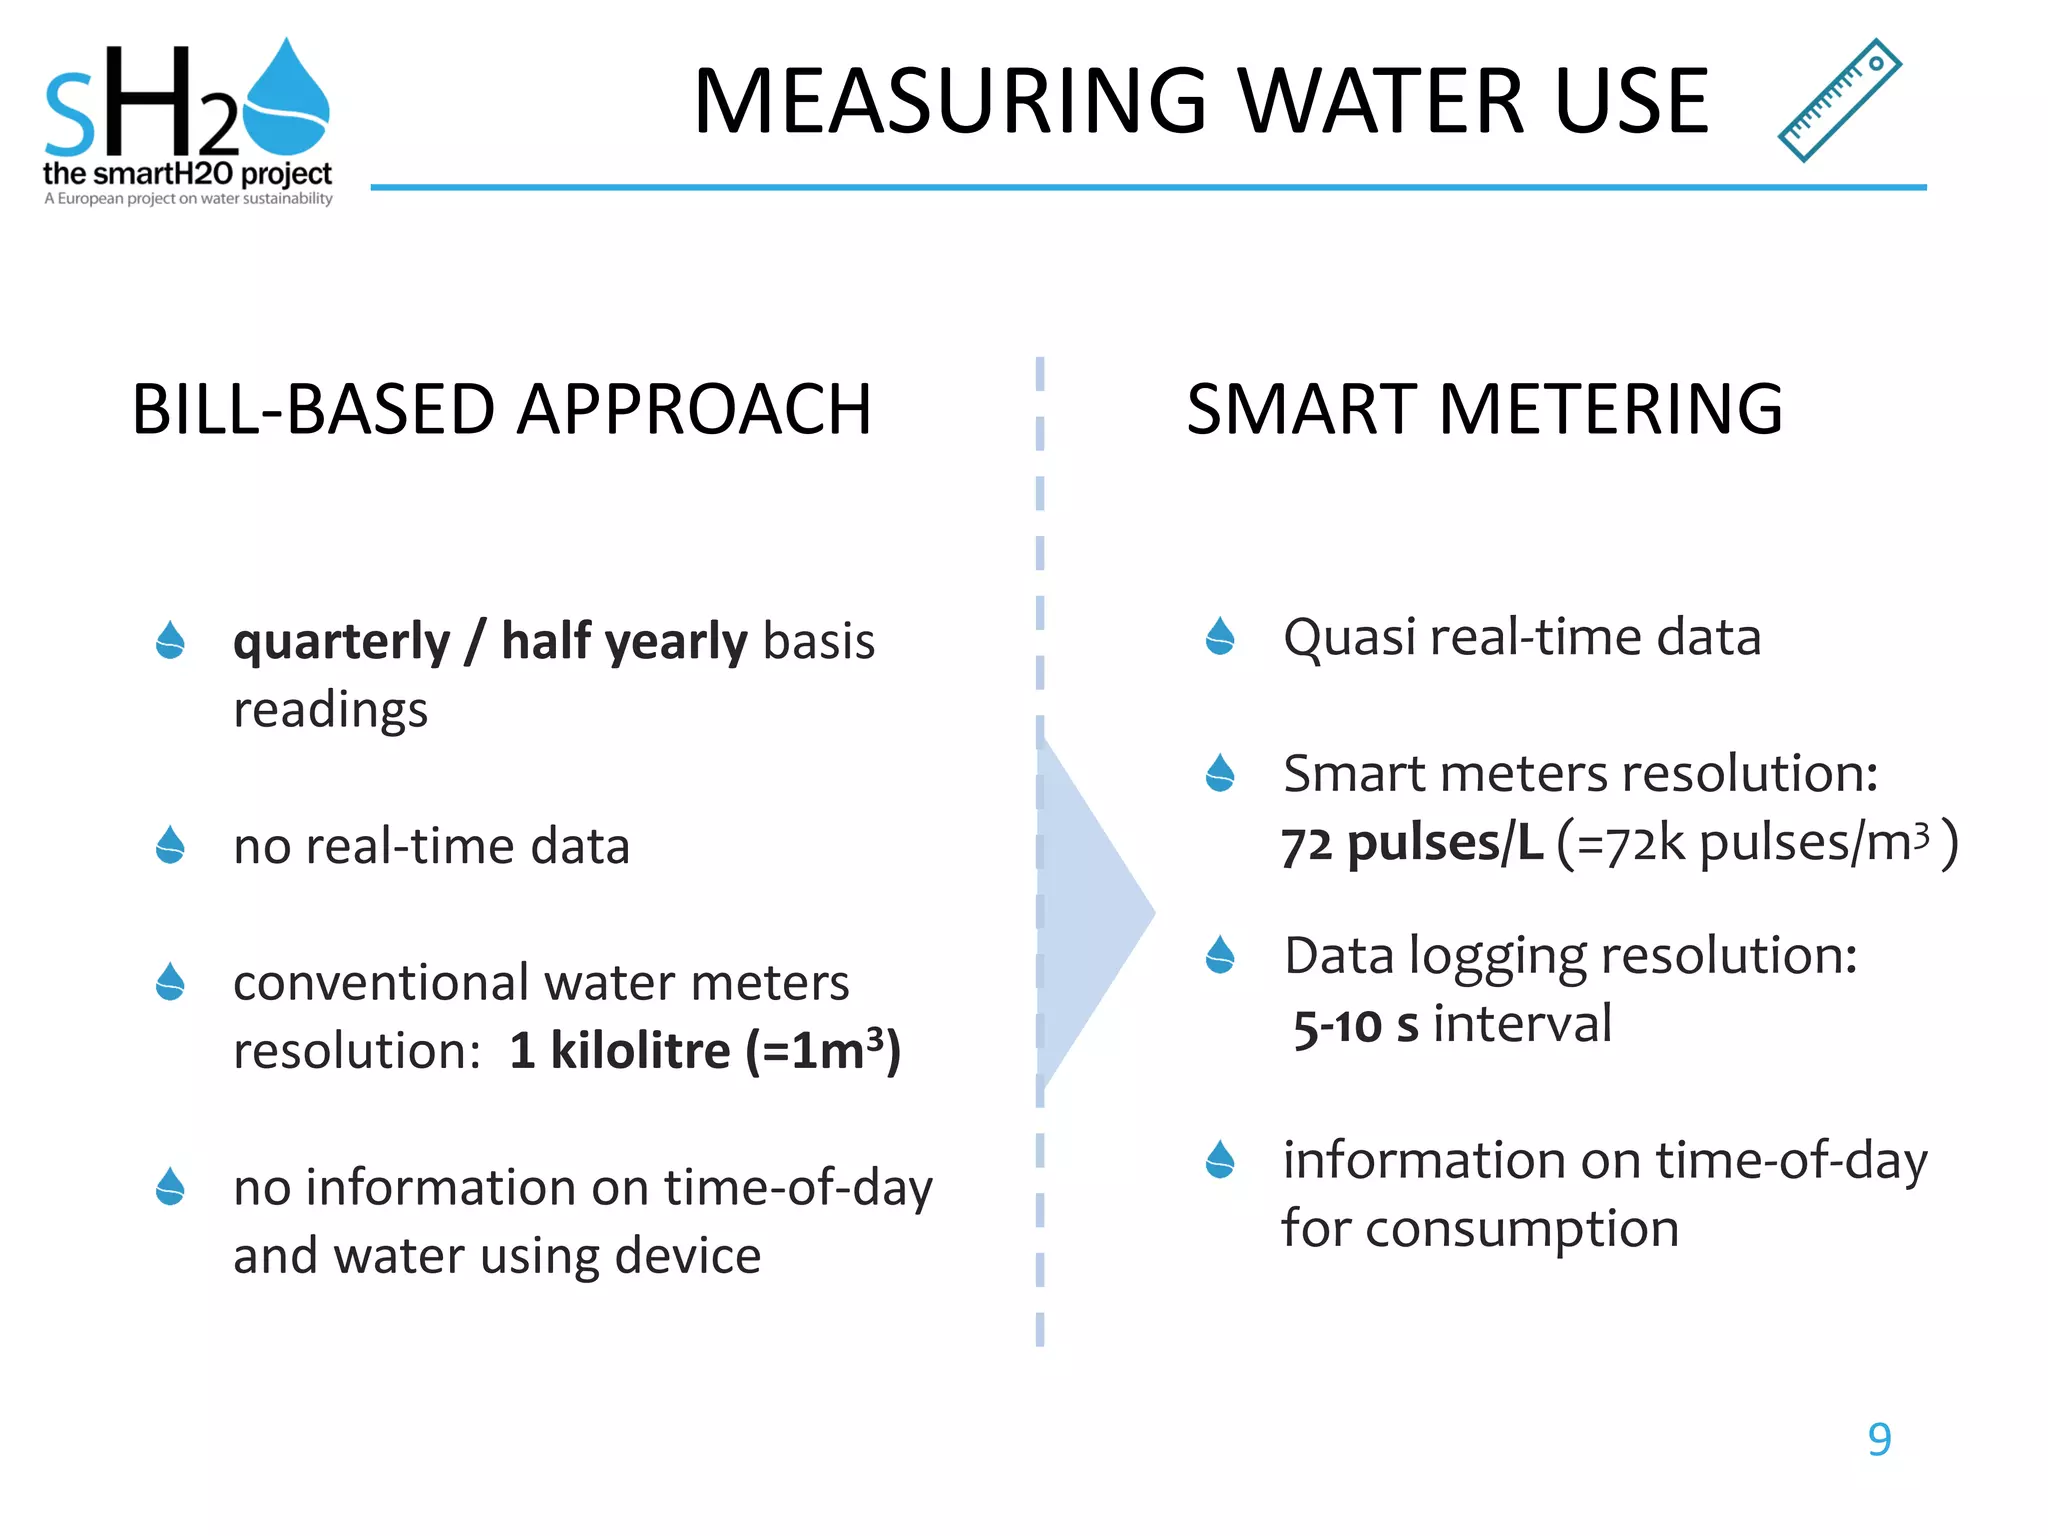
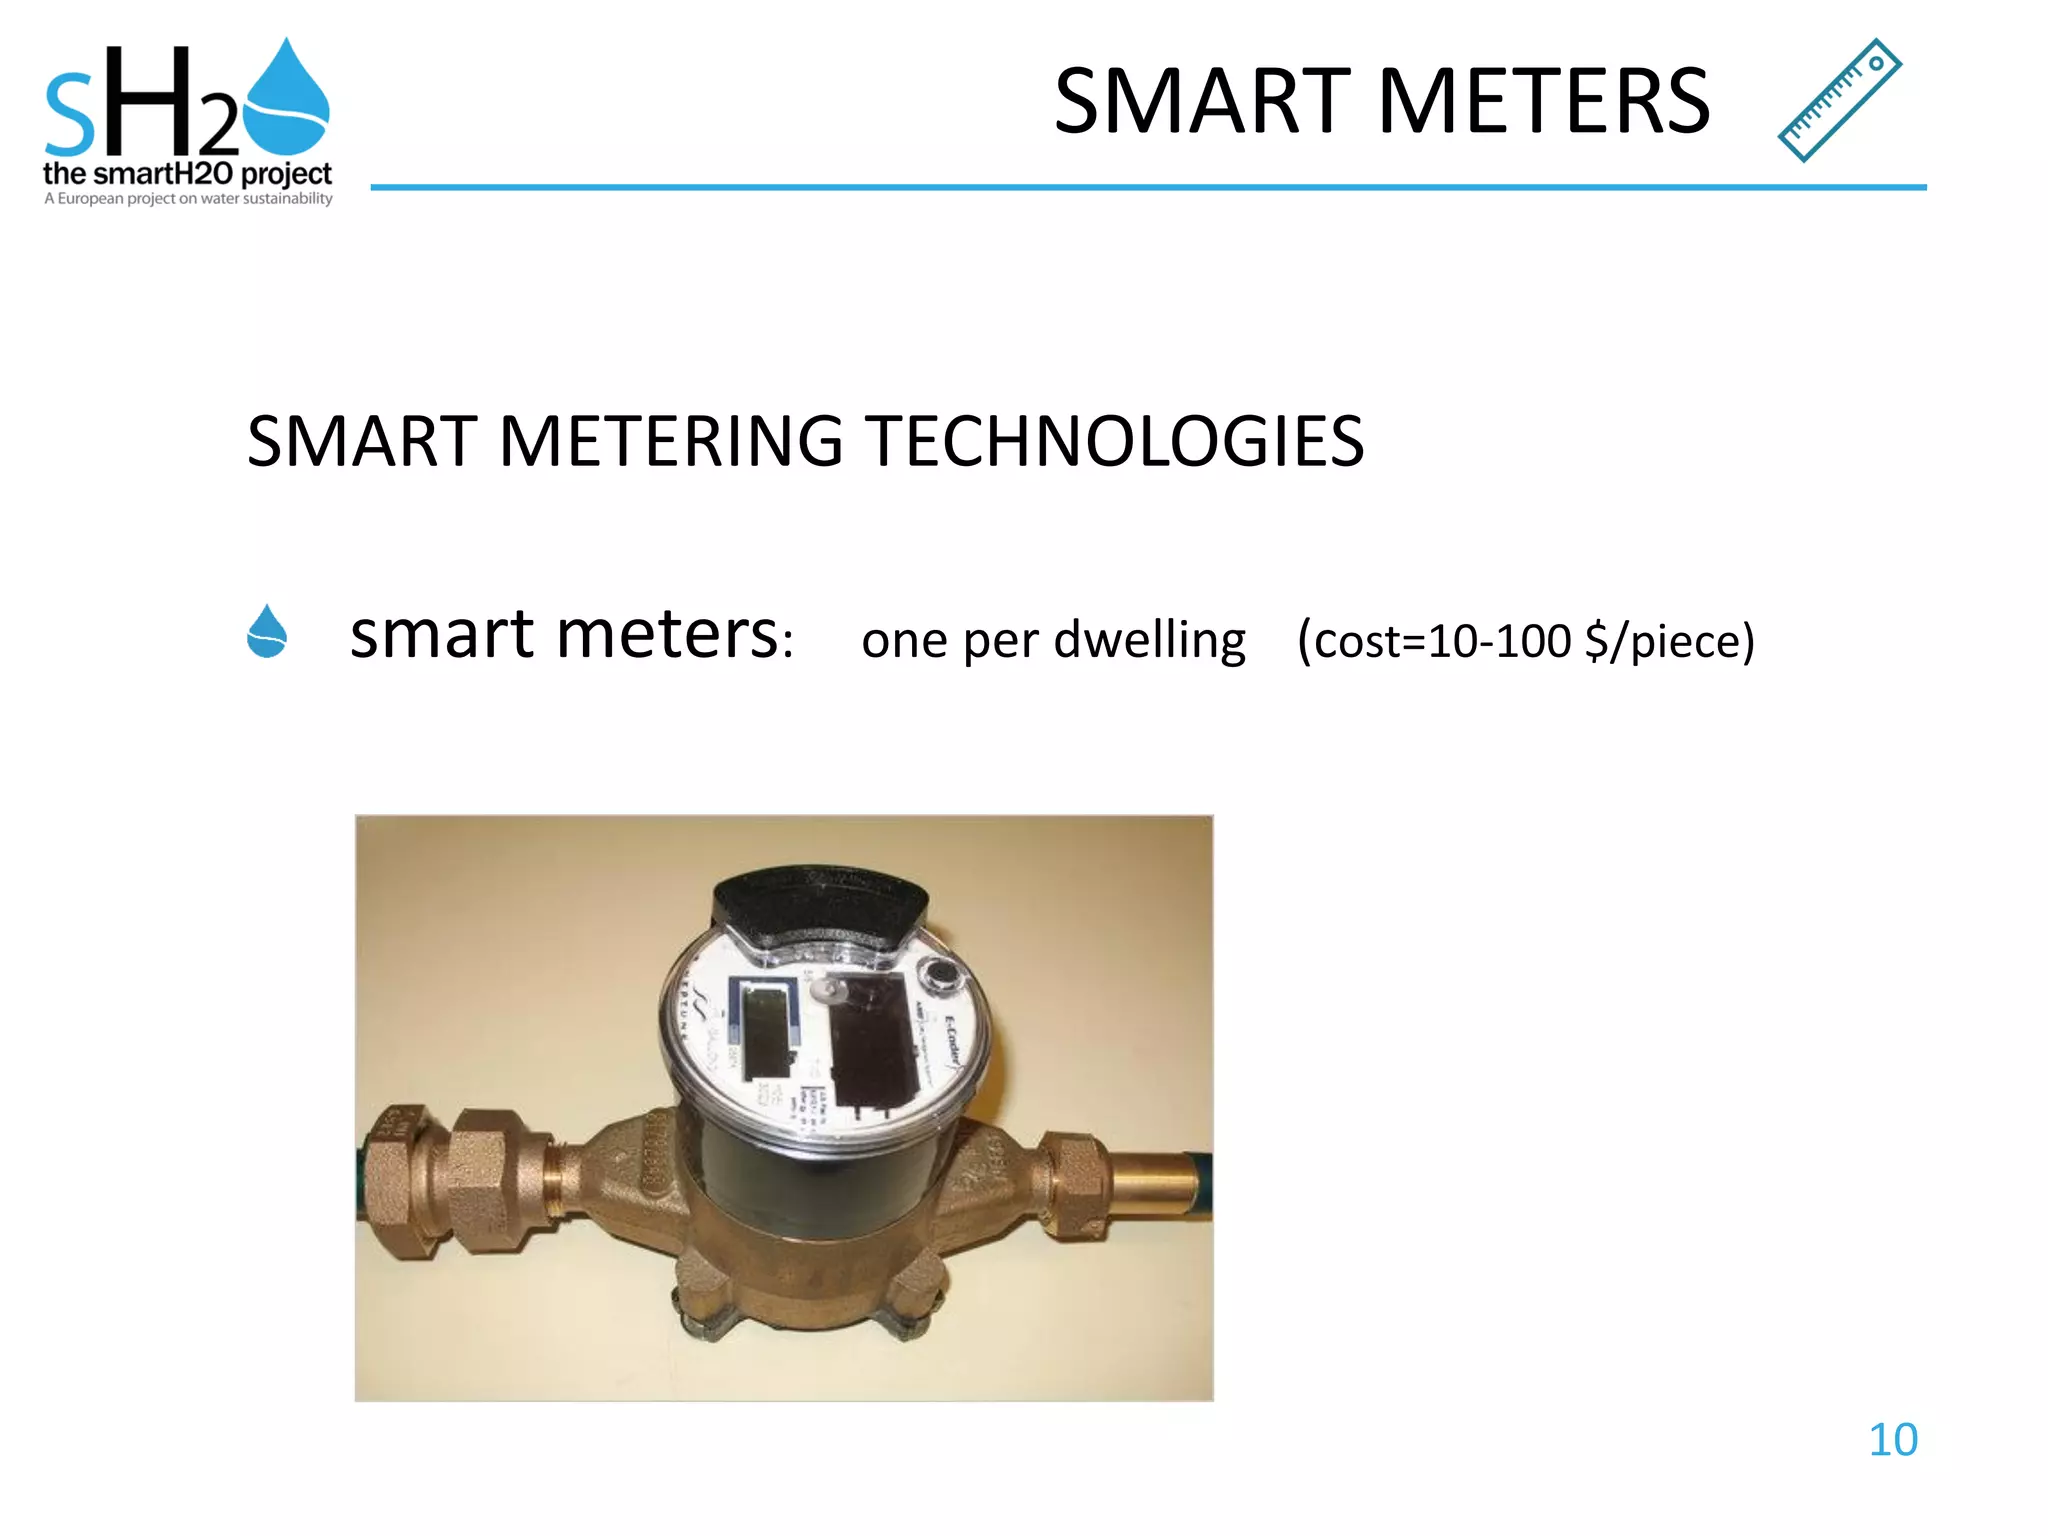
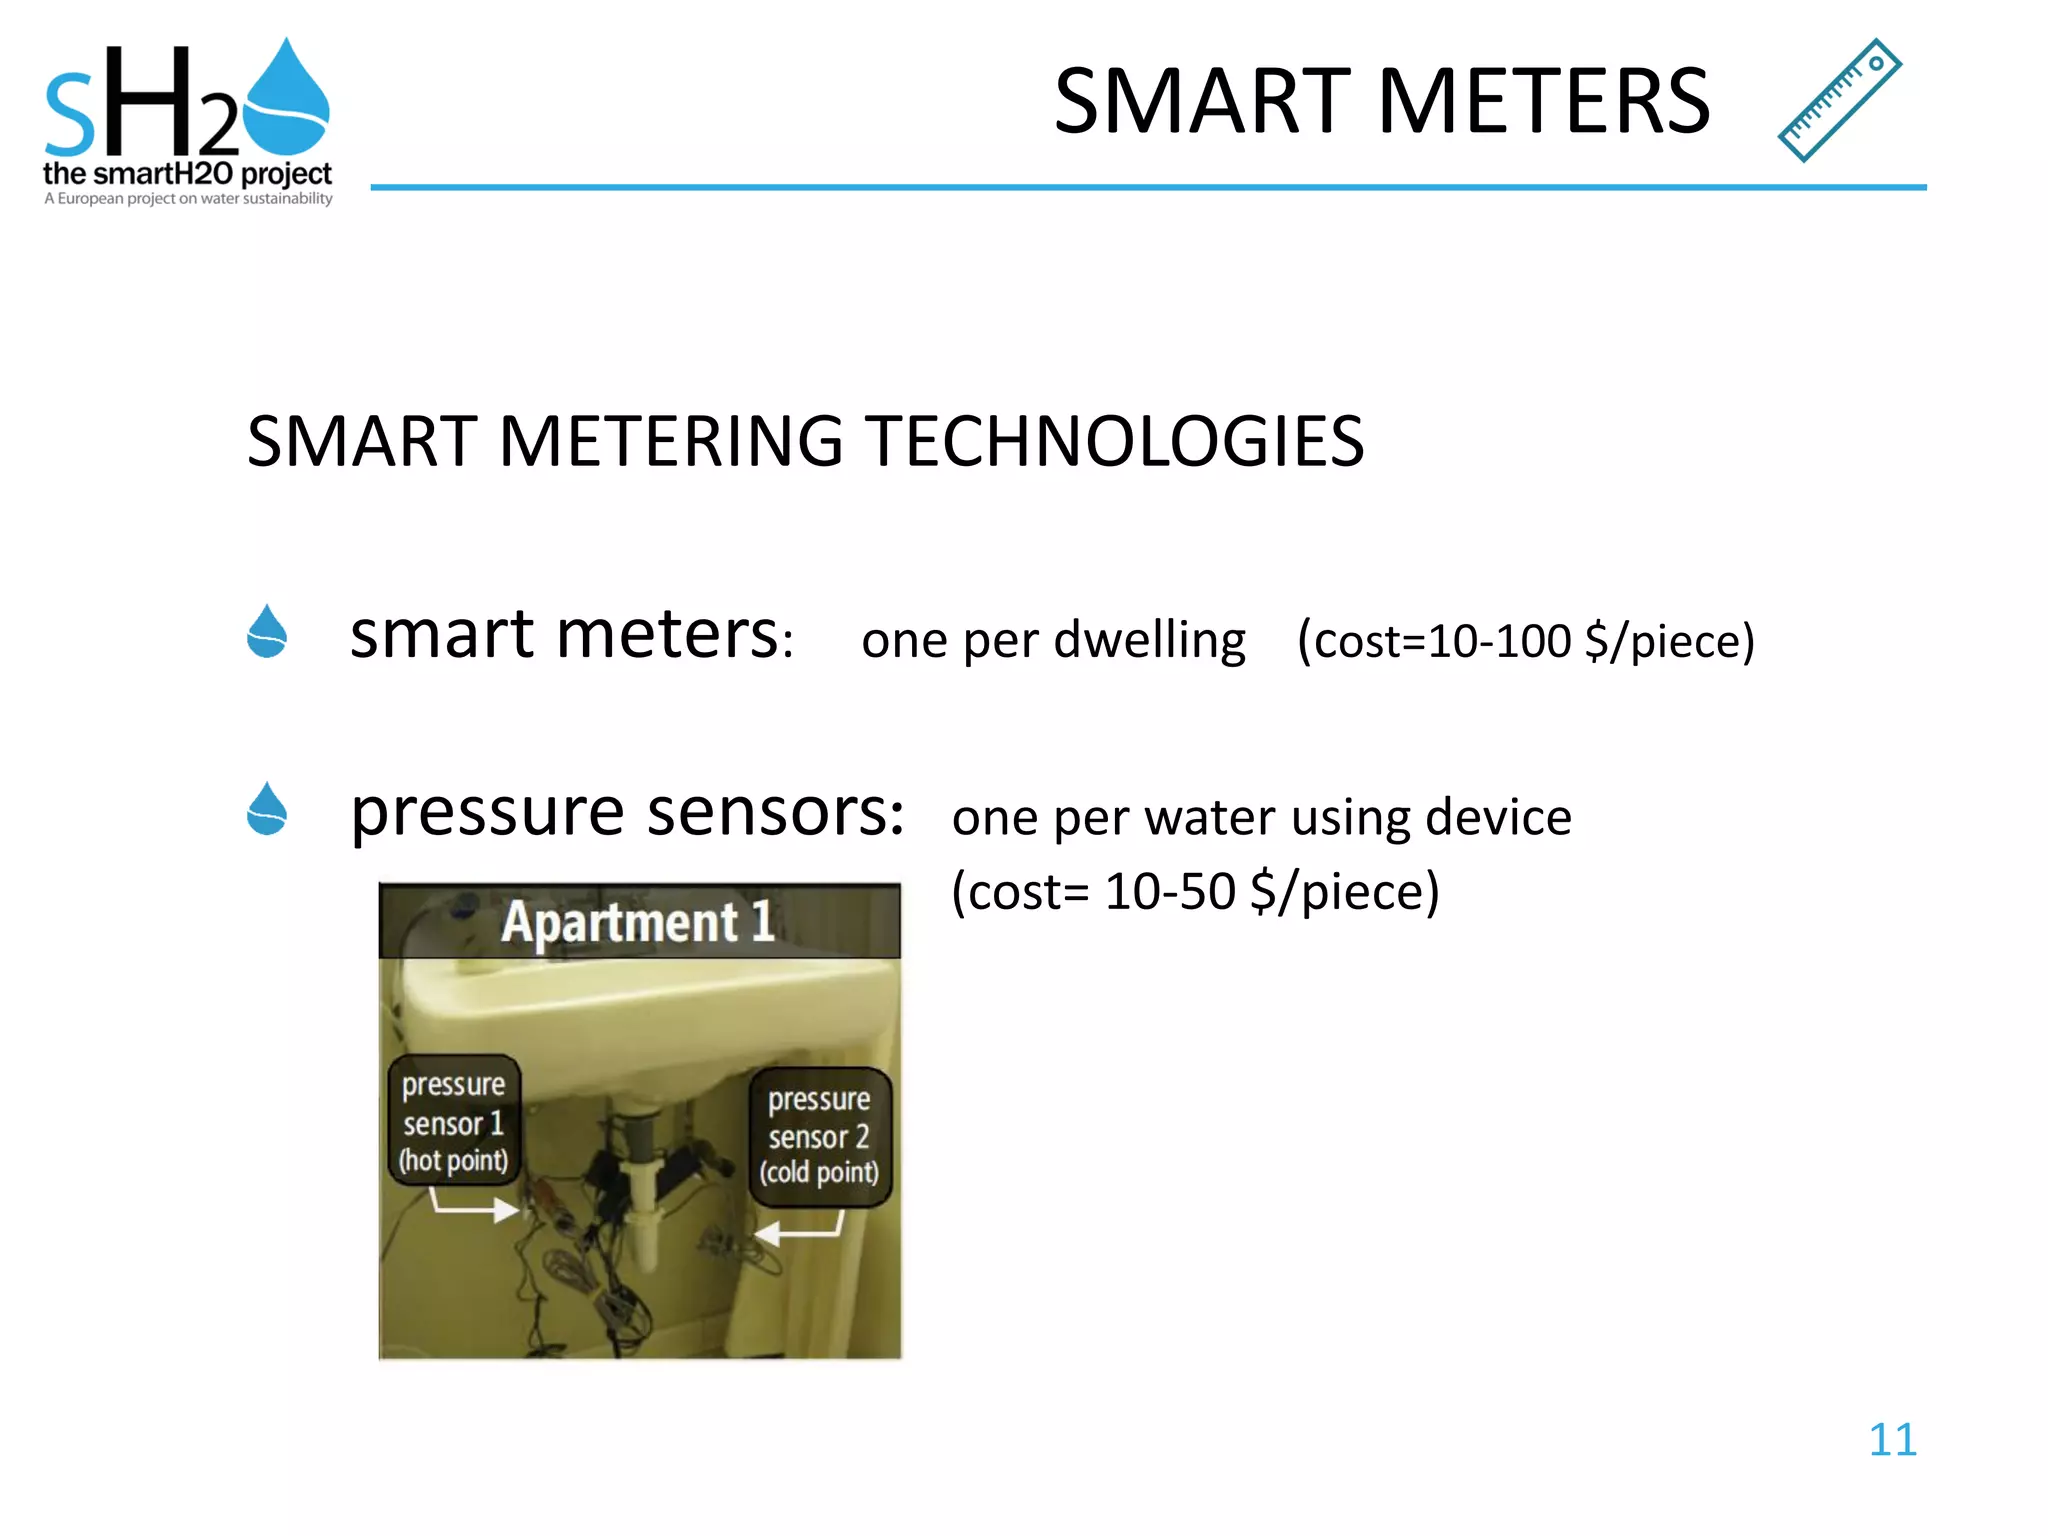
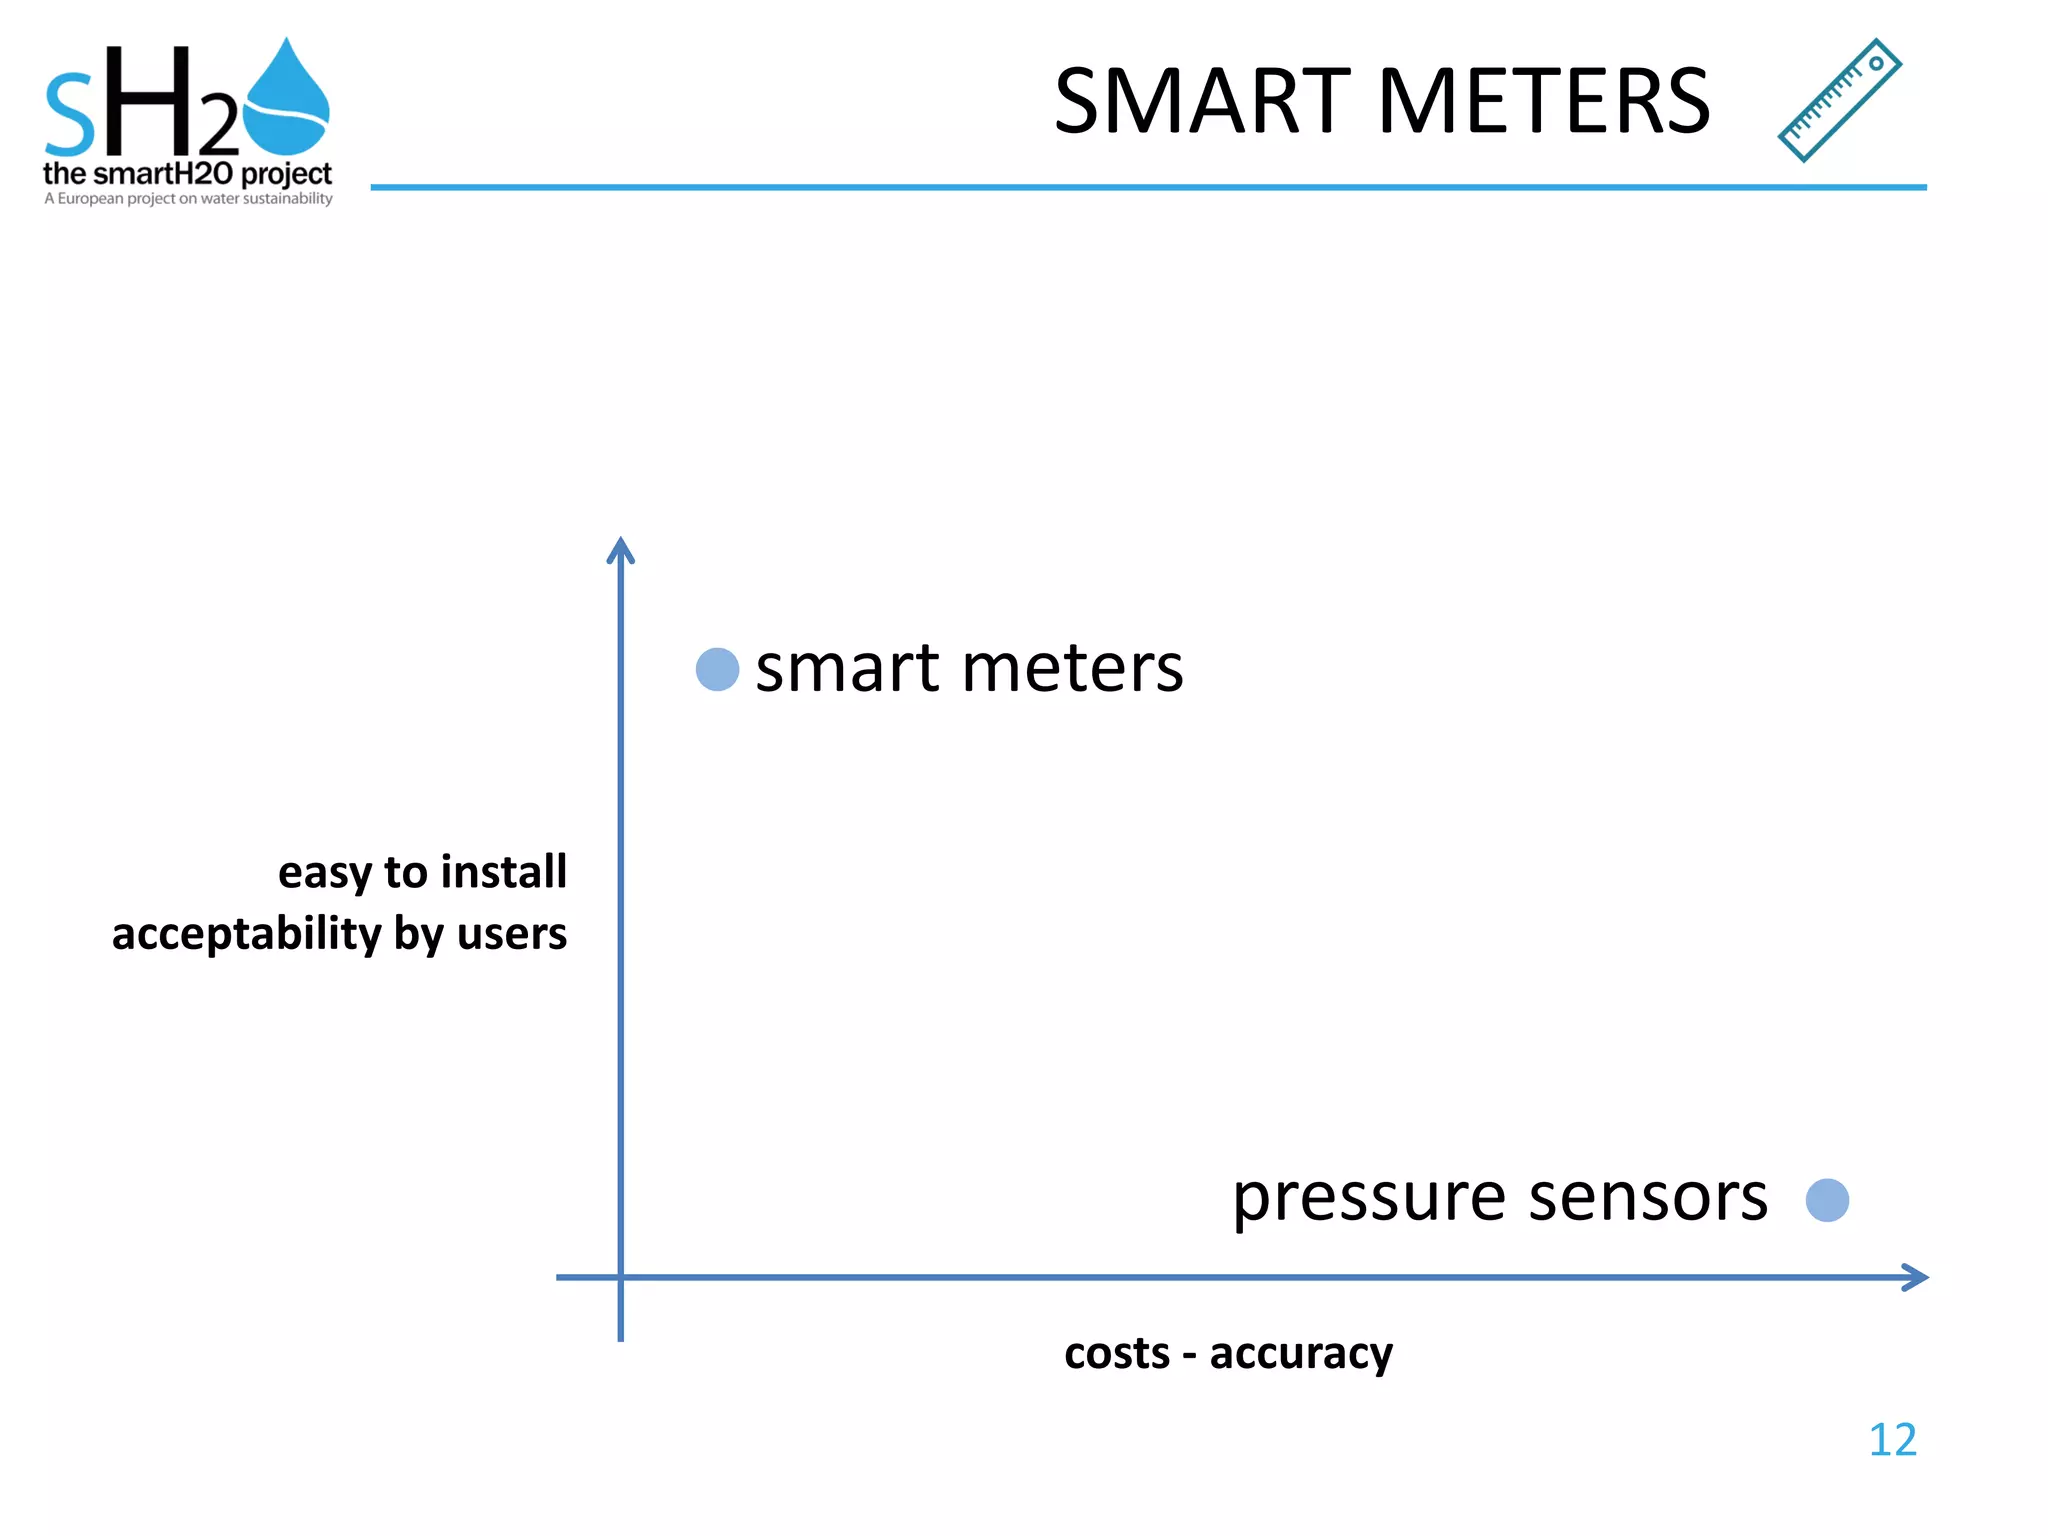
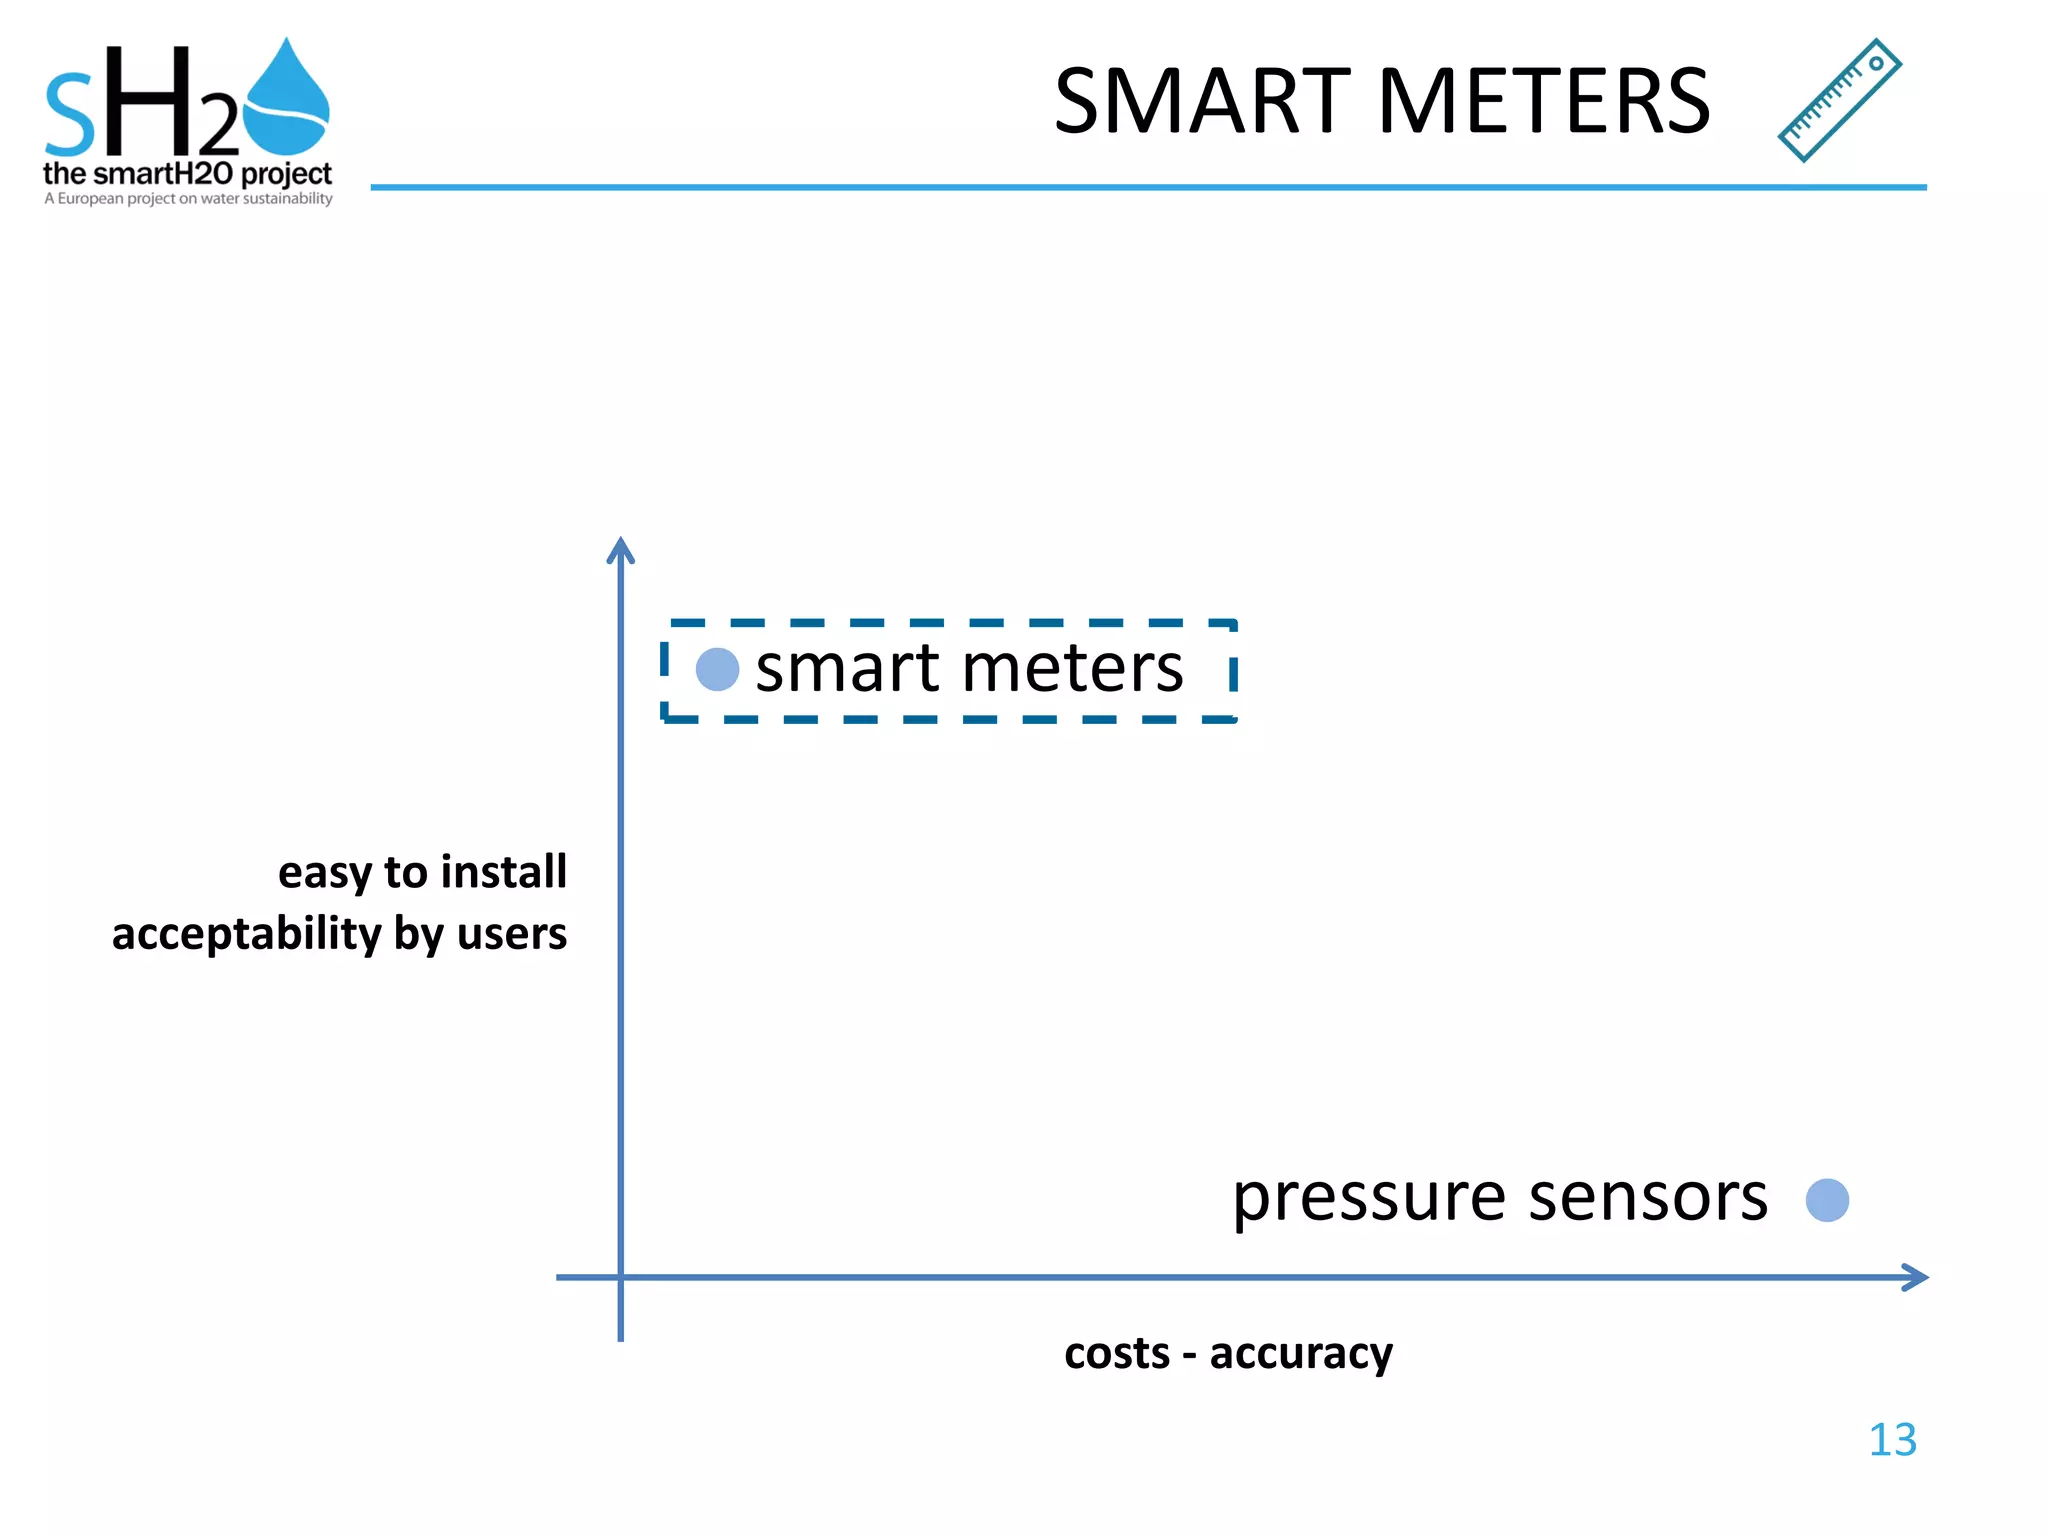
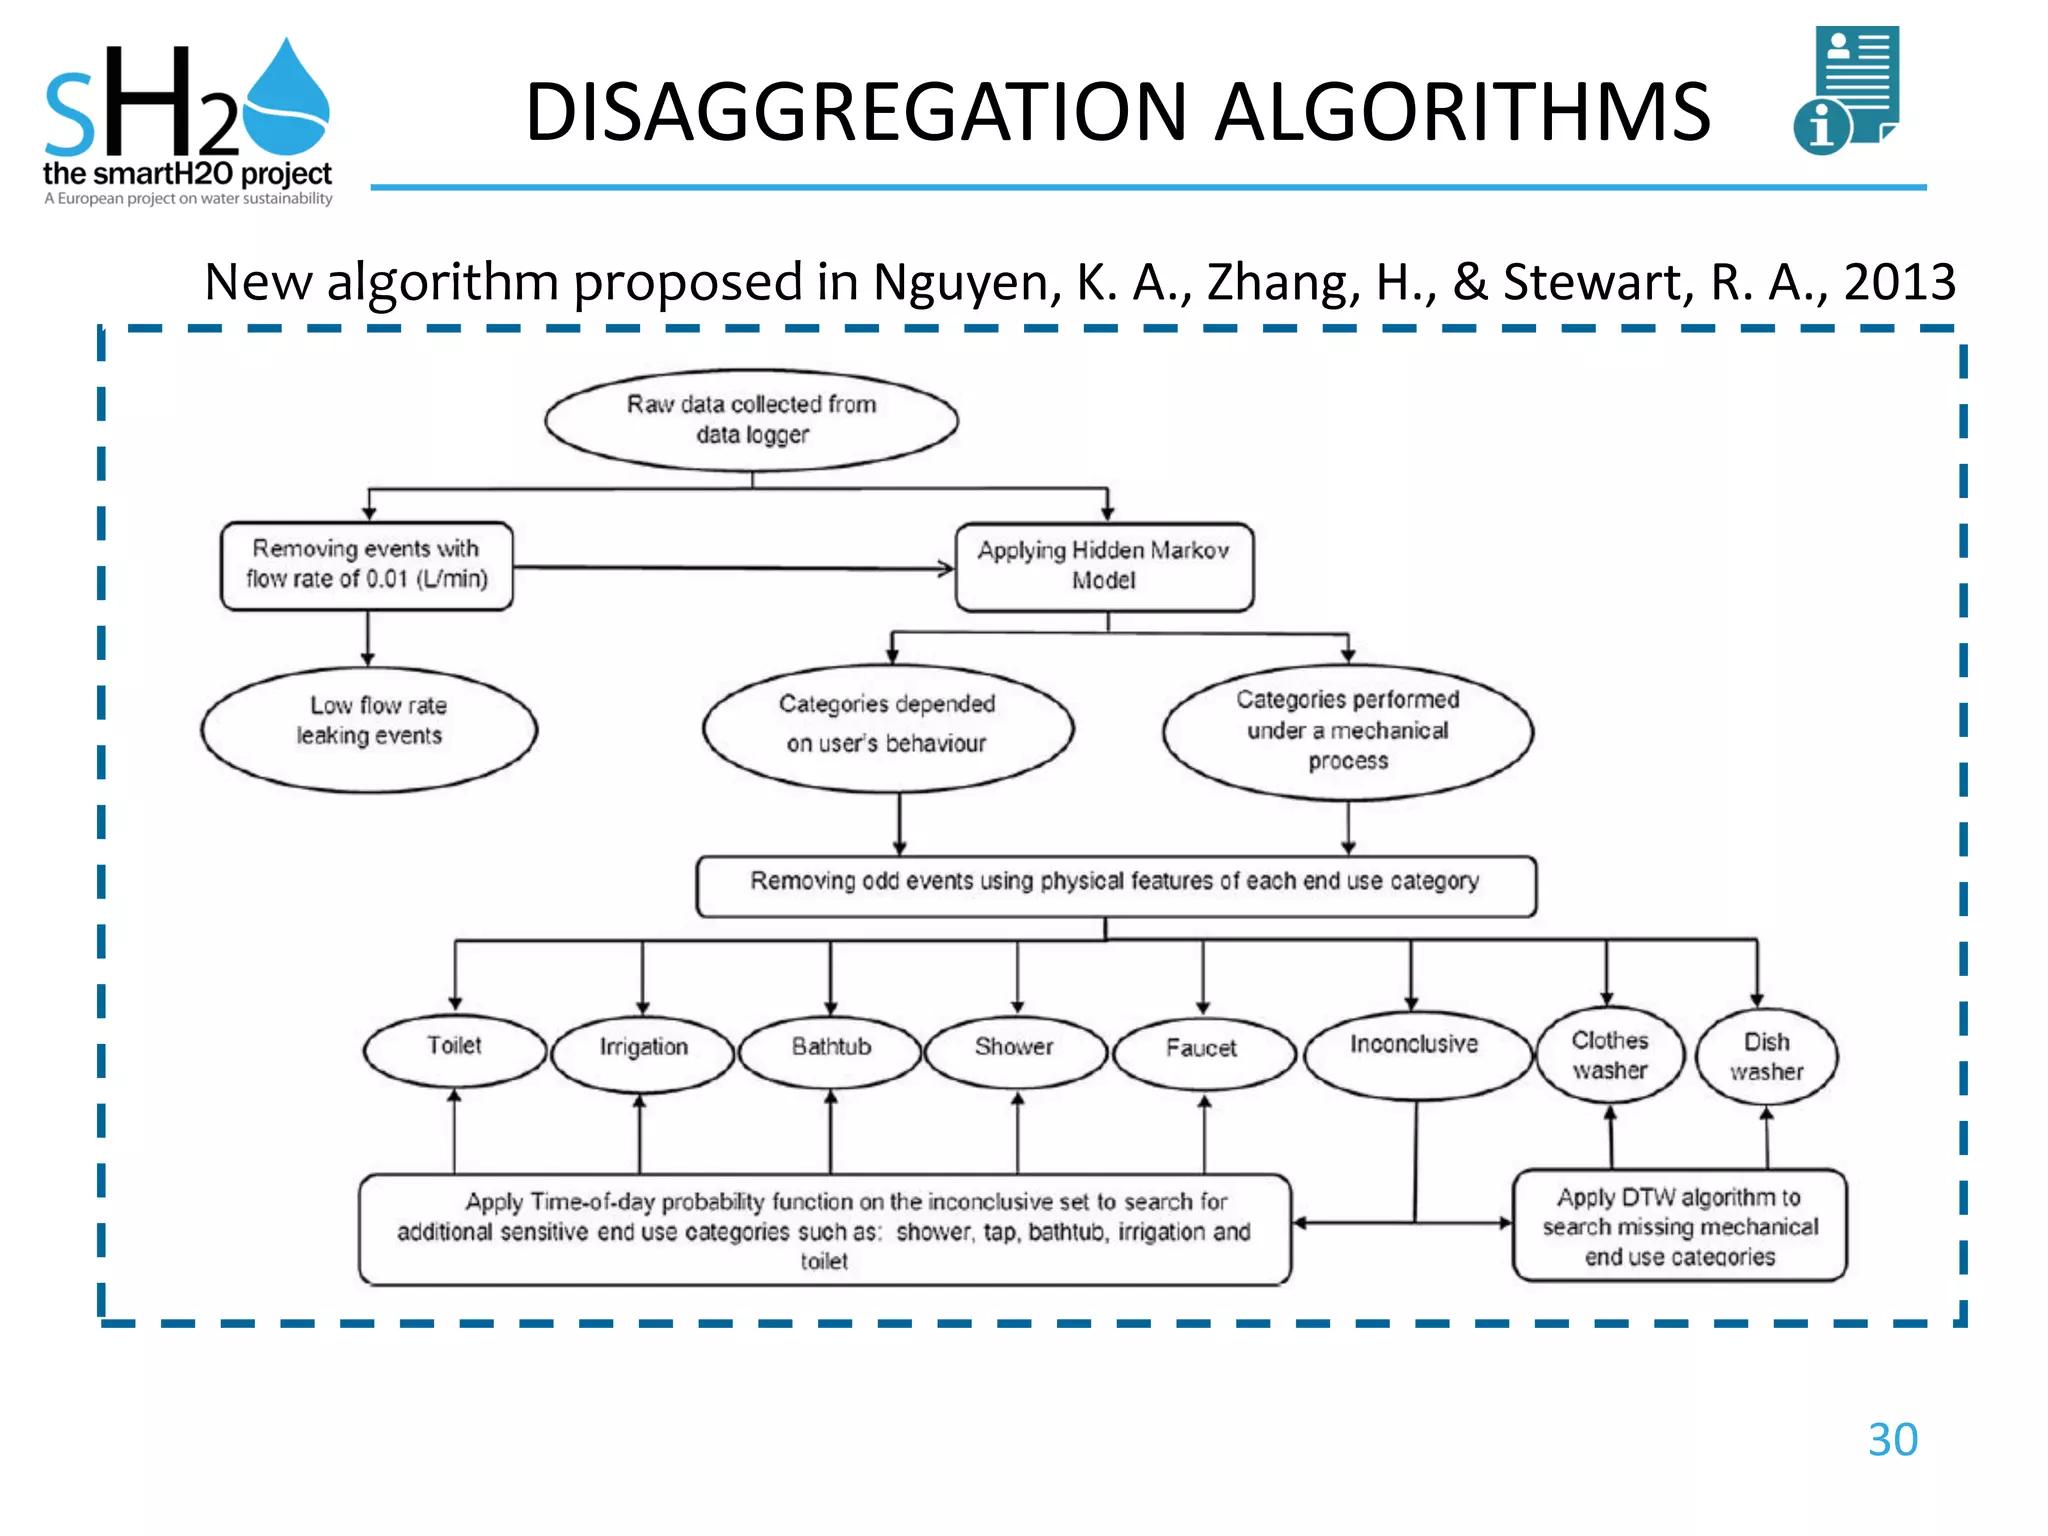
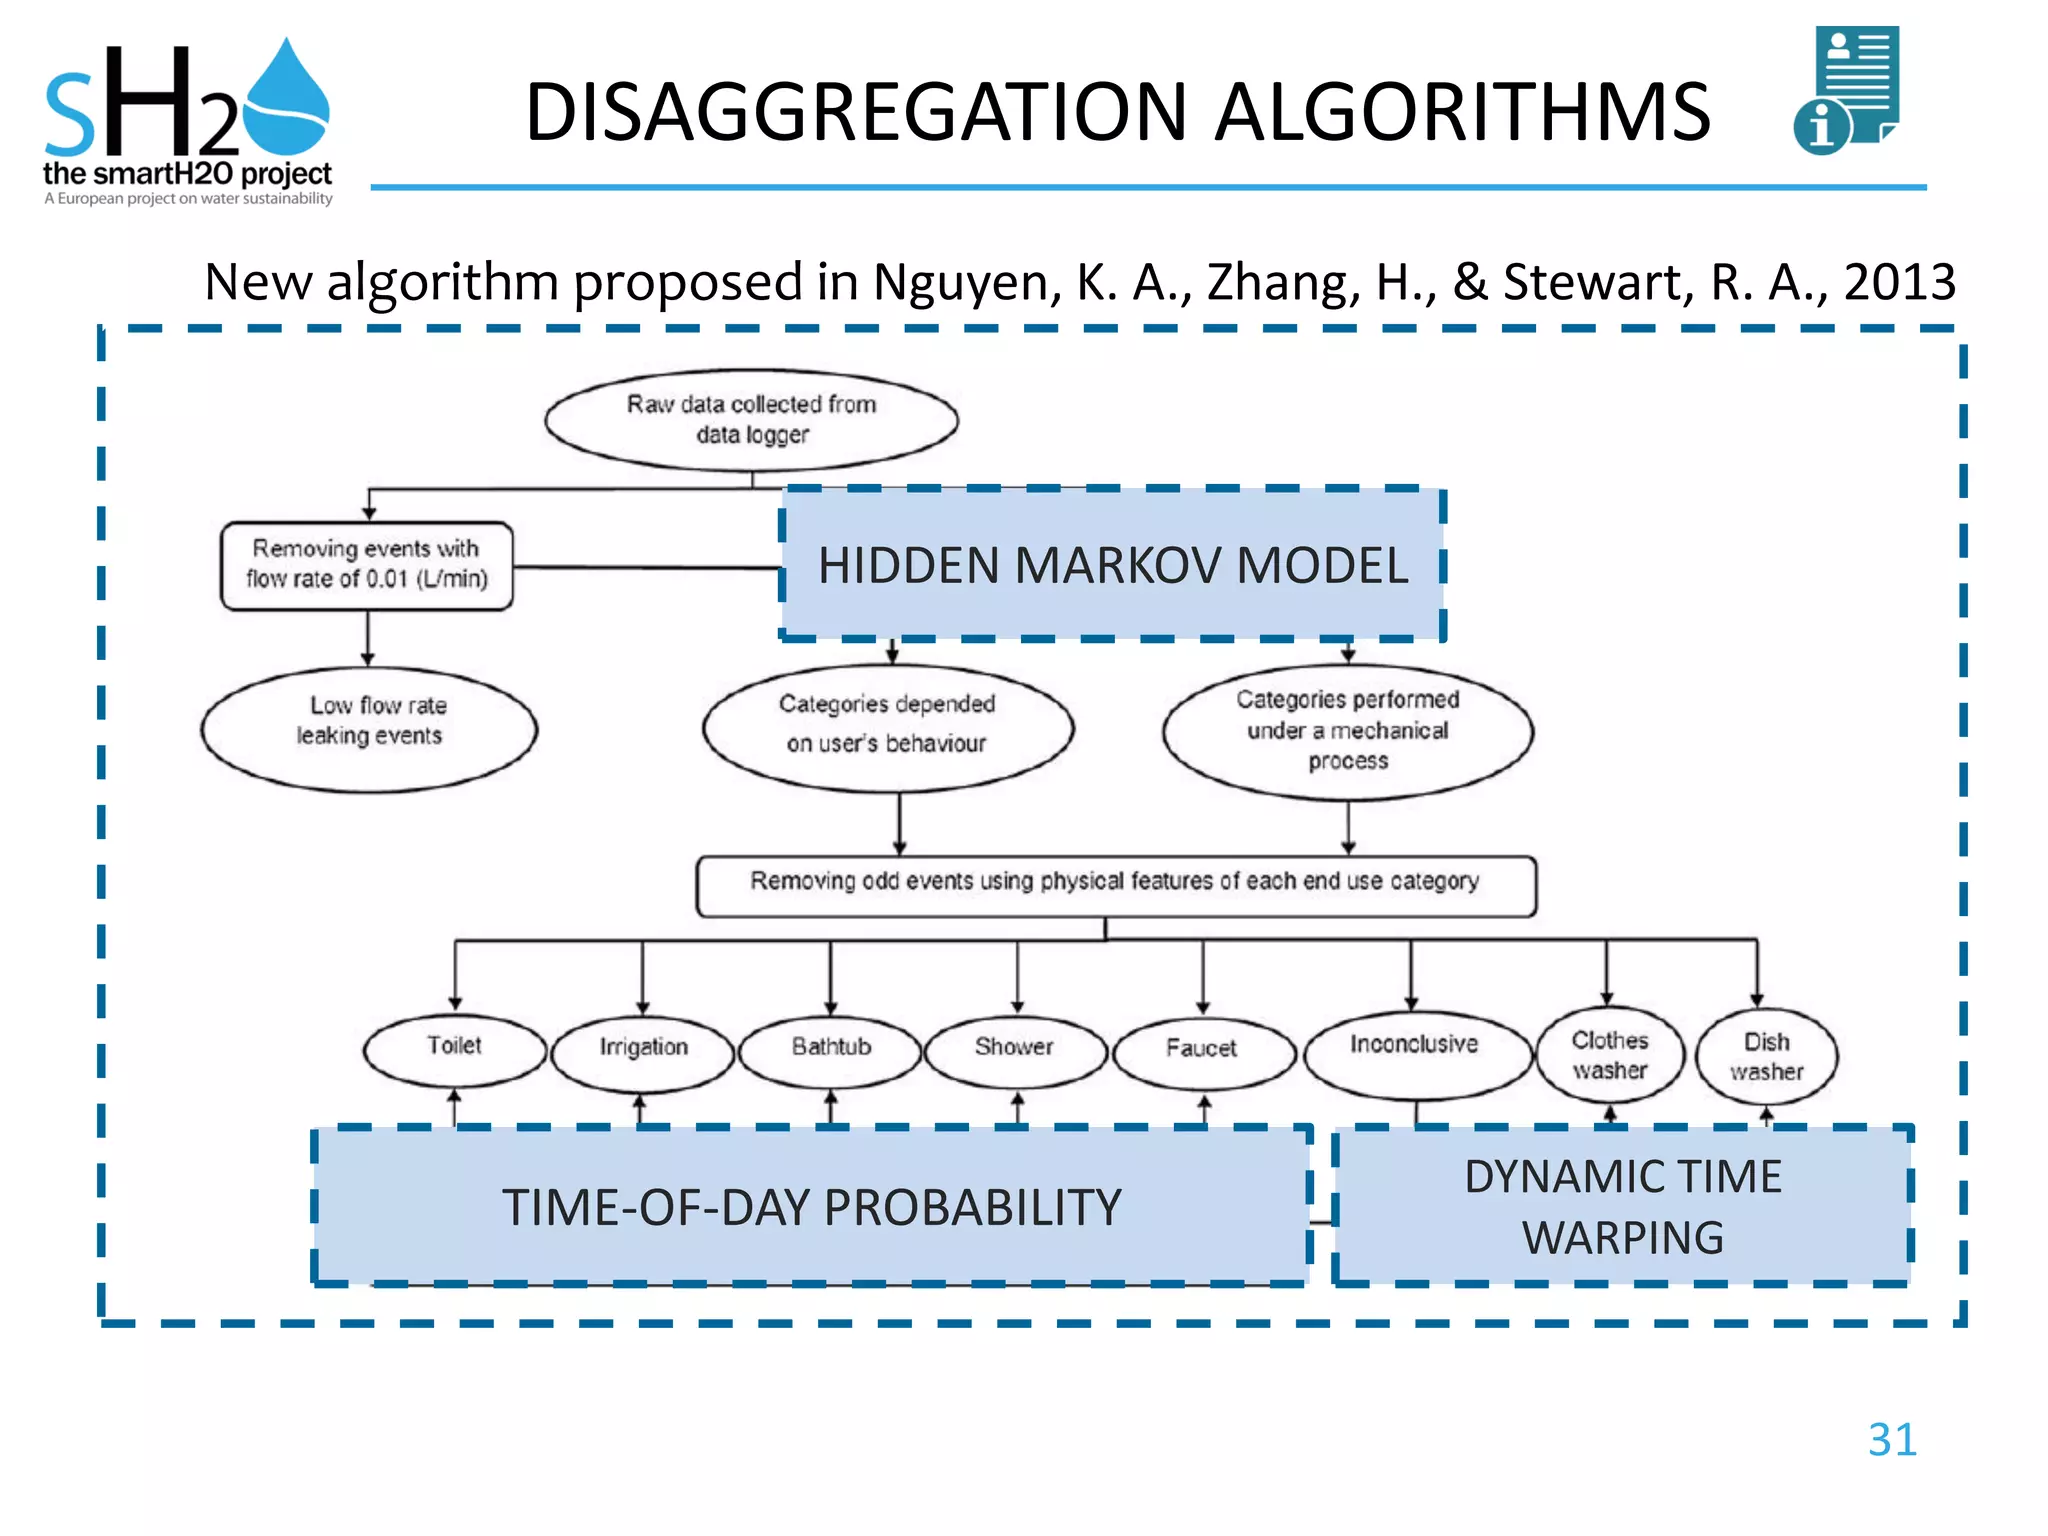
Smart sensors and user modeling
in residential water demand management
State of the art review
Andrea Cominola, Andrea Castelletti, Matteo Giuliani
19/04/2014_MILANO
2
DOMESTIC WATER END USER
User/household attributes
Age
Income level
Education level
Household composition
Water devices efficiency
Presence of garden/swimming pool
Environmental committment
3
DOMESTIC WATER END USER
User/household attributes
Age
Income level
Education level
Household composition
Water devices efficiency
Presence of garden/swimming pool
Environmental committment
External drivers
Climate
Water price
Regulations
Incentives
4
DOMESTIC WATER END USER
End uses
Toilet
Shower
Dishwasher
Washing machine
Garden
Swimming pool
5
USERS’ INTERACTIONS
6
WORK PHASES
STATE OF THE ART ASSESSMENT
DATA GATHERING
USER PROFILES
MODELING
RESPONSE TO WDM
STRATEGIES
MULTI-AGENT
MODELS
7
DATA GATHERING
8
MEASURING WATER USE
quarterly / half yearly basis
readings
no real-time data
conventional water meters
resolution: 1 kilolitre (=1m3)
no information on time-of-day
and water using device
Ineffective support to
WATER DEMAND
MANAGEMENT STRATEGIES
BILL-BASED APPROACH
9
MEASURING WATER USE
BILL-BASED APPROACH
quarterly / half yearly basis
readings
no real-time data
conventional water meters
resolution: 1 kilolitre (=1m3)
no information on time-of-day
and water using device
SMART METERING
Quasi real-time data
Smart meters resolution:
72 pulses/L (=72k pulses/m3 )
Data logging resolution:
5-10 s interval
information on time-of-day
for consumption
10
SMART METERS
SMART METERING TECHNOLOGIES
smart meters: one per dwelling (cost=10-100 $/piece)
11
SMART METERS
SMART METERING TECHNOLOGIES
smart meters: one per dwelling (cost=10-100 $/piece)
pressure sensors: one per water using device
(cost= 10-50 $/piece)
12
SMART METERS
smart meters
pressure sensors
costs - accuracy
easy to install
acceptability by users
13
SMART METERS
smart meters
pressure sensors
costs - accuracy
easy to install
acceptability by users
14
SMART METERS
STATE-OF-THE ART CASE STUDIES
2013 Nguyen, K. A., Zhang, H., &
Stewart, R. A.
Development Of An Intelligent Model To Categorise
Residential Water End Use Events. Journal of Hydro-
environment Research.
Journal of Hydro-environment
Research.
2012 Fielding, K. S., Spinks, A.,
Russell, S., McCrea, R.,
Stewart, R., & Gardner, J.
An experimental test of voluntary strategies to promote
urban water demand management.
Journal of environmental
management.
2011 Gato-Trinidad, S.,
Jayasuriya, N., & Roberts, P.
Understanding urban residential end uses of water. Water Science &
Technology, 64(1), 36-42.
2011 Willis, R. M., Stewart, R. A.,
Giurco, D. P., Talebpour, M.
R., & Mousavinejad, A.
End use water consumption in households: impact of
socio-demographic factors and efficient devices.
Journal of Cleaner Production.
2010 Beal, C.D., Stewart, R.A.,
Huang, T.
South East Queensland Residential End Use Study:
Baseline Results – Winter 2010.
Urban Water Security Research
Alliance Technical Report No. 31
2009 Willis, R., Stewart, R.A.,
Panuwatwanich, K., Capati,
B. and Giurco, D.
Gold Coast Domestic Water End Use Study AWA Water, 36(6): 84-90.
2009 Willis, R., Stewart, R.A.,
Talebpour, M.R.,
Mousavinejad, A., Jones, S.
and Giurco, D.
Revealing the impact of socio-demographic factors and
efficient devices on end use water consumption: case of
Gold Coast Australia.
Proceedings of the 5th IWA
Specialist Conference 'Efficient
2009', eds.
International Water Association
(IWA) and Australian Water
Association, Sydney, Australia.
15
SMART METERS
STATE-OF-THE ART CASE STUDIES
2008 Mead, N., & Aravinthan, V. Investigation of household water consumption using
smart metering system.
Desalination and Water
Treatment,11(1-3), 115-123.
2007 Heinrich, M. Water End Use and Efficiency Project (WEEP) - Final
Report.
BRANZ Study Report
159, Branz, Judgeford, New
Zealand.
2005 Kowalski, M., Marshallsay,
D.,
Using measured micro-component data to
model the impact of water conservation strategies on
the diurnal consumption profile.
Water Science and Technology:
Water Supply 5 (3-4), 145-150.
2005 Roberts, P. Yarra Valley Water 2004 residential end use
measurement study.
Final report, June
2004.
2004 Mayer, P. W., DeOreo, W. B.,
Towler, E., Martien, L., &
Lewis, D.
Tampa water department residential water conservation
study: the impacts of high efficiency plumbing fixture
retrofits in single-family homes.
A Report Prepared for Tampa
Water Department and the United
States Environmental Protection
Agency.
2003 Loh, M. and Coghlan, P. Domestic water use study in Perth, Western Australia
1998 to 2000.
Water Corporation of Western
Australia.
1999 Mayer, P.W. and DeOreo,
W.B.
Residential End Uses of Water Aquacraft, Inc. Water
Engineeringand Management,
Boulder, CO.
16
SMART METERS
# STATE-OF-THE ART CASE STUDIES_sensors
Sensor resolution (pulses/L)
Loggerresolution(s)
34.2 72*
1510
* = not specified
6
5
1
1
1
1
17
SMART METERS
# STATE-OF-THE ART CASE STUDIES_sensors
Sensor resolution (pulses/L)
Loggerresolution(s)
34.2 72*
1510
* = not specified
6
5
1
1
1
1
1pulse every 0.014 L
18
SMART METERS
USA-1 UK-1 AUS-11
NZ - 1
# STATE-OF-THE ART CASE STUDIES_location
19
SMART METERS
STATE-OF-THE ART CASE STUDIES_time length
Minimum: 4 weeks
Maximum 2 years
* Kowalski and Marshally (2005) is an ongoing project in UK since 2003
20
DATA TRANSFER
Manual download (in situ or ex situ) to PC: most used
Wireless home internet network
3G mobile network
21
SMART METERS IN sH2O
sH2O CASE STUDY_UK
2500 meters since 2011
15 min reading interval
5 districts: 2 in London, 1 in Reading, 1 in Swindon
5000 properties
sH2O CASE STUDY_Swiss
they will be installed during the first year of sH2O
22
USERS PROFILE MODELING
23
END USES DATA
DIRECT MEASUREMENT of flows for end uses
DISAGGREGATION ALGORITHMS
24
DISAGGREGATION ALGORITHMS
HydroSense
Froehlich et al. , 2009, 2011
_ probabilistic-based classification approach
_ matching the “most likely sequence of valve events”
_ PRESSURE SENSORS: high number of sensors needed for
calibration
_ accuracy > 90%
25
DISAGGREGATION ALGORITHMS
HydroSense
Froehlich et al. , 2009, 2011
_ probabilistic-based classification approach
_ matching the “most likely sequence of valve events”
_ PRESSURE SENSORS: high number of sensors needed for
calibration
_ accuracy > 90%
NOT EASILY
FEASIBLE and
ACCEPTED by
users
26
DISAGGREGATION ALGORITHMS
Trace Wizard
TraceWizard, 2003.
TraceWizardWater Use AnalysisTool. Users Manual.
Aquacaft, Inc.
_user choses wich devices are used in the
house
_ flow boundaries condition must be inserted
(e.g. maximum and minimum flow)
_ need for expert analyst for high accuracy
_ only two simultaneous events can occur
27
DISAGGREGATION ALGORITHMS
Trace Wizard
TraceWizard, 2003.
TraceWizardWater Use AnalysisTool. Users Manual.
Aquacaft, Inc.
_user choses wich devices are used in the
house
_ flow boundaries condition must be inserted
(e.g. maximum and minimum flow)
_ need for expert analyst for high accuracy
_ only two simultaneous events can occur
TIME AND
RESOURCES
INTENSIVE
28
DISAGGREGATION ALGORITHMS
Identiflow
_similar to Trace Wizard
_ higher accuracy
_ it considers many physical features
of water using devices
(volume, flow rate, duration, etc…)
29
DISAGGREGATION ALGORITHMS
Identiflow
_similar to Trace Wizard
_ higher accuracy
_ it considers many physical features
of water using devices
(volume, flow rate, duration, etc…)
HIGH
DEPENDENCY
ON DEVICES
FEATURE
DIFFICULT TO
RECOGNISE
NEW DEVICES
30
DISAGGREGATION ALGORITHMS
New algorithm proposed in Nguyen, K. A., Zhang, H., & Stewart, R. A., 2013
31
DISAGGREGATION ALGORITHMS
New algorithm proposed in Nguyen, K. A., Zhang, H., & Stewart, R. A., 2013
HIDDEN MARKOV MODEL
DYNAMIC TIME
WARPING
TIME-OF-DAY PROBABILITY
32
DISAGGREGATION ALGORITHMS
New algorithm proposed in Nguyen, K. A., Zhang, H., & Stewart, R. A., 2013
HIGHER ACCURACY if compared to existing tools (Trace Wizard),
apart from some uses (irrigation, toilet)
33
USER MODELING
“drivers for indoor use include household composition, presence of
water saving devices and a range of socio-economic factors”
“The success of household water demand management strategies
is dependent on how well we understand how people think about
water and water use»
(Jorgensen et al., 2009)
34
USER MODELING
The aim is to
“improve the understanding of the end uses of water and to assist
where to focus water conservation efforts”
«DESCRIPTIVE STUDIES»
e.g. Gato-Trinidad, 2011
_daily usage is: 66% indoor use, 29% outdoor use, 5% leakage
_indoor use: 31% shower, 26% laundry, 19% toilet flushing, 24% others
_higher daily water consumption in summertime (also indoor)
_50% saving could be possible by using front loaders machines in spite of
top loaders
35
USER MODELING
The aim is to understand the aim of variables
of the same domain on water consumption
«SINGLE VARIABLE DOMAIN STUDIES»
e.g. Fox, 2009
Univariate and multivariate analysis for “Classifying households for water demand
forecasting using physical property characteristics”
FINDINGS:
_ significant difference depending on household size (number of bedrooms),
architectural type and garden presence
_ not importan difference due to garden aspect or age
36
USER MODELING
The aim is to understand the aim of variables
of different domains on water consumption
«MULTIPLE VARIABLE DOMAIN STUDIES»
e.g. Willis, 2011
_ explore relationship between stock efficiency and water end use
_ assess the influence of socio-demographic factors on water consumption
FINDINGS:
_ apart from irrigation, the lower socio-economic groups tend to use
slightly more water
_ general decrease in consumption per capita as family size increases
(apart from clothes washer and toilet)
_ combined household efficiency savings can be up to 30%
_ payback times: 2 years for showerheads, 7 years for washing machines,
21 years for RWT
37
USER MODELING
The aim is to forecast residential water demand
«DEMAND FORECASTING MODELS»
e.g. Bennet, 2013
_ ANN are used to model and forecast residential water demand
FINDINGS:
_ household income, number of adults, number of children, number of teenagers,
and appliance stock efficiency regarding toilet, shower and clothes washer
end uses were the predominant determinants
38
RESPONSE TO
WDM STRATEGIES
39
WDM STRATEGIES
PRICE CONTROL
WATER USE RESTRICTION
INCENTIVES for water saving devices
INFORMATION CAMPAIGNS
40
WDM STRATEGIES
Fielding, 2013
41
ROOM FOR IMPROVEMENT
Data transfer
faster and more immediate
Data disaggregation algorithm
less human intervention demanding
higher accuracy
resolution level?
Input selection for users profiling
Residential water users' modeling SOTA

Residential water users' modeling SOTA

  • 1.
    Smart sensors anduser modeling in residential water demand management State of the art review Andrea Cominola, Andrea Castelletti, Matteo Giuliani 19/04/2014_MILANO
  • 2.
    2 DOMESTIC WATER ENDUSER User/household attributes Age Income level Education level Household composition Water devices efficiency Presence of garden/swimming pool Environmental committment
  • 3.
    3 DOMESTIC WATER ENDUSER User/household attributes Age Income level Education level Household composition Water devices efficiency Presence of garden/swimming pool Environmental committment External drivers Climate Water price Regulations Incentives
  • 4.
    4 DOMESTIC WATER ENDUSER End uses Toilet Shower Dishwasher Washing machine Garden Swimming pool
  • 5.
  • 6.
    6 WORK PHASES STATE OFTHE ART ASSESSMENT DATA GATHERING USER PROFILES MODELING RESPONSE TO WDM STRATEGIES MULTI-AGENT MODELS
  • 7.
  • 8.
    8 MEASURING WATER USE quarterly/ half yearly basis readings no real-time data conventional water meters resolution: 1 kilolitre (=1m3) no information on time-of-day and water using device Ineffective support to WATER DEMAND MANAGEMENT STRATEGIES BILL-BASED APPROACH
  • 9.
    9 MEASURING WATER USE BILL-BASEDAPPROACH quarterly / half yearly basis readings no real-time data conventional water meters resolution: 1 kilolitre (=1m3) no information on time-of-day and water using device SMART METERING Quasi real-time data Smart meters resolution: 72 pulses/L (=72k pulses/m3 ) Data logging resolution: 5-10 s interval information on time-of-day for consumption
  • 10.
    10 SMART METERS SMART METERINGTECHNOLOGIES smart meters: one per dwelling (cost=10-100 $/piece)
  • 11.
    11 SMART METERS SMART METERINGTECHNOLOGIES smart meters: one per dwelling (cost=10-100 $/piece) pressure sensors: one per water using device (cost= 10-50 $/piece)
  • 12.
    12 SMART METERS smart meters pressuresensors costs - accuracy easy to install acceptability by users
  • 13.
    13 SMART METERS smart meters pressuresensors costs - accuracy easy to install acceptability by users
  • 14.
    14 SMART METERS STATE-OF-THE ARTCASE STUDIES 2013 Nguyen, K. A., Zhang, H., & Stewart, R. A. Development Of An Intelligent Model To Categorise Residential Water End Use Events. Journal of Hydro- environment Research. Journal of Hydro-environment Research. 2012 Fielding, K. S., Spinks, A., Russell, S., McCrea, R., Stewart, R., & Gardner, J. An experimental test of voluntary strategies to promote urban water demand management. Journal of environmental management. 2011 Gato-Trinidad, S., Jayasuriya, N., & Roberts, P. Understanding urban residential end uses of water. Water Science & Technology, 64(1), 36-42. 2011 Willis, R. M., Stewart, R. A., Giurco, D. P., Talebpour, M. R., & Mousavinejad, A. End use water consumption in households: impact of socio-demographic factors and efficient devices. Journal of Cleaner Production. 2010 Beal, C.D., Stewart, R.A., Huang, T. South East Queensland Residential End Use Study: Baseline Results – Winter 2010. Urban Water Security Research Alliance Technical Report No. 31 2009 Willis, R., Stewart, R.A., Panuwatwanich, K., Capati, B. and Giurco, D. Gold Coast Domestic Water End Use Study AWA Water, 36(6): 84-90. 2009 Willis, R., Stewart, R.A., Talebpour, M.R., Mousavinejad, A., Jones, S. and Giurco, D. Revealing the impact of socio-demographic factors and efficient devices on end use water consumption: case of Gold Coast Australia. Proceedings of the 5th IWA Specialist Conference 'Efficient 2009', eds. International Water Association (IWA) and Australian Water Association, Sydney, Australia.
  • 15.
    15 SMART METERS STATE-OF-THE ARTCASE STUDIES 2008 Mead, N., & Aravinthan, V. Investigation of household water consumption using smart metering system. Desalination and Water Treatment,11(1-3), 115-123. 2007 Heinrich, M. Water End Use and Efficiency Project (WEEP) - Final Report. BRANZ Study Report 159, Branz, Judgeford, New Zealand. 2005 Kowalski, M., Marshallsay, D., Using measured micro-component data to model the impact of water conservation strategies on the diurnal consumption profile. Water Science and Technology: Water Supply 5 (3-4), 145-150. 2005 Roberts, P. Yarra Valley Water 2004 residential end use measurement study. Final report, June 2004. 2004 Mayer, P. W., DeOreo, W. B., Towler, E., Martien, L., & Lewis, D. Tampa water department residential water conservation study: the impacts of high efficiency plumbing fixture retrofits in single-family homes. A Report Prepared for Tampa Water Department and the United States Environmental Protection Agency. 2003 Loh, M. and Coghlan, P. Domestic water use study in Perth, Western Australia 1998 to 2000. Water Corporation of Western Australia. 1999 Mayer, P.W. and DeOreo, W.B. Residential End Uses of Water Aquacraft, Inc. Water Engineeringand Management, Boulder, CO.
  • 16.
    16 SMART METERS # STATE-OF-THEART CASE STUDIES_sensors Sensor resolution (pulses/L) Loggerresolution(s) 34.2 72* 1510 * = not specified 6 5 1 1 1 1
  • 17.
    17 SMART METERS # STATE-OF-THEART CASE STUDIES_sensors Sensor resolution (pulses/L) Loggerresolution(s) 34.2 72* 1510 * = not specified 6 5 1 1 1 1 1pulse every 0.014 L
  • 18.
    18 SMART METERS USA-1 UK-1AUS-11 NZ - 1 # STATE-OF-THE ART CASE STUDIES_location
  • 19.
    19 SMART METERS STATE-OF-THE ARTCASE STUDIES_time length Minimum: 4 weeks Maximum 2 years * Kowalski and Marshally (2005) is an ongoing project in UK since 2003
  • 20.
    20 DATA TRANSFER Manual download(in situ or ex situ) to PC: most used Wireless home internet network 3G mobile network
  • 21.
    21 SMART METERS INsH2O sH2O CASE STUDY_UK 2500 meters since 2011 15 min reading interval 5 districts: 2 in London, 1 in Reading, 1 in Swindon 5000 properties sH2O CASE STUDY_Swiss they will be installed during the first year of sH2O
  • 22.
  • 23.
    23 END USES DATA DIRECTMEASUREMENT of flows for end uses DISAGGREGATION ALGORITHMS
  • 24.
    24 DISAGGREGATION ALGORITHMS HydroSense Froehlich etal. , 2009, 2011 _ probabilistic-based classification approach _ matching the “most likely sequence of valve events” _ PRESSURE SENSORS: high number of sensors needed for calibration _ accuracy > 90%
  • 25.
    25 DISAGGREGATION ALGORITHMS HydroSense Froehlich etal. , 2009, 2011 _ probabilistic-based classification approach _ matching the “most likely sequence of valve events” _ PRESSURE SENSORS: high number of sensors needed for calibration _ accuracy > 90% NOT EASILY FEASIBLE and ACCEPTED by users
  • 26.
    26 DISAGGREGATION ALGORITHMS Trace Wizard TraceWizard,2003. TraceWizardWater Use AnalysisTool. Users Manual. Aquacaft, Inc. _user choses wich devices are used in the house _ flow boundaries condition must be inserted (e.g. maximum and minimum flow) _ need for expert analyst for high accuracy _ only two simultaneous events can occur
  • 27.
    27 DISAGGREGATION ALGORITHMS Trace Wizard TraceWizard,2003. TraceWizardWater Use AnalysisTool. Users Manual. Aquacaft, Inc. _user choses wich devices are used in the house _ flow boundaries condition must be inserted (e.g. maximum and minimum flow) _ need for expert analyst for high accuracy _ only two simultaneous events can occur TIME AND RESOURCES INTENSIVE
  • 28.
    28 DISAGGREGATION ALGORITHMS Identiflow _similar toTrace Wizard _ higher accuracy _ it considers many physical features of water using devices (volume, flow rate, duration, etc…)
  • 29.
    29 DISAGGREGATION ALGORITHMS Identiflow _similar toTrace Wizard _ higher accuracy _ it considers many physical features of water using devices (volume, flow rate, duration, etc…) HIGH DEPENDENCY ON DEVICES FEATURE DIFFICULT TO RECOGNISE NEW DEVICES
  • 30.
    30 DISAGGREGATION ALGORITHMS New algorithmproposed in Nguyen, K. A., Zhang, H., & Stewart, R. A., 2013
  • 31.
    31 DISAGGREGATION ALGORITHMS New algorithmproposed in Nguyen, K. A., Zhang, H., & Stewart, R. A., 2013 HIDDEN MARKOV MODEL DYNAMIC TIME WARPING TIME-OF-DAY PROBABILITY
  • 32.
    32 DISAGGREGATION ALGORITHMS New algorithmproposed in Nguyen, K. A., Zhang, H., & Stewart, R. A., 2013 HIGHER ACCURACY if compared to existing tools (Trace Wizard), apart from some uses (irrigation, toilet)
  • 33.
    33 USER MODELING “drivers forindoor use include household composition, presence of water saving devices and a range of socio-economic factors” “The success of household water demand management strategies is dependent on how well we understand how people think about water and water use» (Jorgensen et al., 2009)
  • 34.
    34 USER MODELING The aimis to “improve the understanding of the end uses of water and to assist where to focus water conservation efforts” «DESCRIPTIVE STUDIES» e.g. Gato-Trinidad, 2011 _daily usage is: 66% indoor use, 29% outdoor use, 5% leakage _indoor use: 31% shower, 26% laundry, 19% toilet flushing, 24% others _higher daily water consumption in summertime (also indoor) _50% saving could be possible by using front loaders machines in spite of top loaders
  • 35.
    35 USER MODELING The aimis to understand the aim of variables of the same domain on water consumption «SINGLE VARIABLE DOMAIN STUDIES» e.g. Fox, 2009 Univariate and multivariate analysis for “Classifying households for water demand forecasting using physical property characteristics” FINDINGS: _ significant difference depending on household size (number of bedrooms), architectural type and garden presence _ not importan difference due to garden aspect or age
  • 36.
    36 USER MODELING The aimis to understand the aim of variables of different domains on water consumption «MULTIPLE VARIABLE DOMAIN STUDIES» e.g. Willis, 2011 _ explore relationship between stock efficiency and water end use _ assess the influence of socio-demographic factors on water consumption FINDINGS: _ apart from irrigation, the lower socio-economic groups tend to use slightly more water _ general decrease in consumption per capita as family size increases (apart from clothes washer and toilet) _ combined household efficiency savings can be up to 30% _ payback times: 2 years for showerheads, 7 years for washing machines, 21 years for RWT
  • 37.
    37 USER MODELING The aimis to forecast residential water demand «DEMAND FORECASTING MODELS» e.g. Bennet, 2013 _ ANN are used to model and forecast residential water demand FINDINGS: _ household income, number of adults, number of children, number of teenagers, and appliance stock efficiency regarding toilet, shower and clothes washer end uses were the predominant determinants
  • 38.
  • 39.
    39 WDM STRATEGIES PRICE CONTROL WATERUSE RESTRICTION INCENTIVES for water saving devices INFORMATION CAMPAIGNS
  • 40.
  • 41.
    41 ROOM FOR IMPROVEMENT Datatransfer faster and more immediate Data disaggregation algorithm less human intervention demanding higher accuracy resolution level? Input selection for users profiling