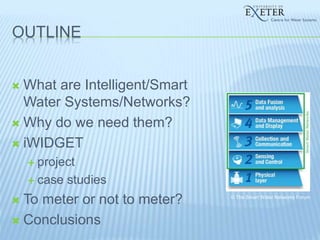
INTELLIGENT (SMART) WATER
SYSTEMS
Professor Dragan Savic FREng, FCIWEM, FICE
OUTLINE
 What are Intelligent/Smart
Water Systems/Networks?
 Why do we need them?
 iWIDGET
 project
 case studies
 To meter or not to meter?
 Conclusions
© The Smart Water Networks Forum
WHAT ARE SMART WATER
NETWORKS?
 Smart Water Network solutions improve the
efficiency, longevity, and reliability of
the underlying physical water network by
better measuring, collecting, analyzing,
and acting upon a wide range of network
events. This can take shape in different phases of
the utility process, such as real-time
monitoring and automation,
operational readiness, or network
planning.
Source: The Smart Water Networks Forum
WHAT ARE SMART WATER
NETWORKS?
 A smart water network is an integrated set of
products, solutions and systems that enable utilities
to remotely and continuously monitor
and diagnose problems, prioritize and
manage maintenance issues and use
data to optimize all aspects of the water
distribution network.
Source: Sensus
SMART WATER NETWORKS
© Sensus
Smart
Metering
/
Sensors
are at
the heart
of Smart
Water
Networks
SMART WATER METERING
Via AMR
Source: www.nhojj.com
To AMI
Source: crenshawcomm.com
From manual reading
Source: www.purewatergazette.net
 Time
consuming
 Costly
 Infrequent
 Prone to
human error
 Wireless
transmission
 Handheld
receives
 Drive-by
 Fixed networks  Two-way
communication
s
 Customers
 Utility
 Infrastructure
WHY DO WE NEED THEM?
 Regulatory compliance
 Optimize infrastructure renewal (TOTEX)
 Increase distribution efficiency
 GHG emissions
 Energy optimization
 Operational efficiency
 Improve decision making
 Guide strategy and investment
 Improve customer satisfaction and
WHY DO WE NEED THEM?
 Enormous investment needed
 raised almost £100bn since the privatisation
 will need another £100bn by 2030 (KPMG)
 TOTEX focus – improved efficiency required
 “no build” solutions
 from “outputs” to “outcomes”
 Customers at the heart of everything
 every Pound of investment has to be justified in
terms of how it benefits customers
© Talent Development Water
S
The research leading to these results has received funding from the European Union Seventh
Framework Programme (FP7/2007-2013), under grant agreement no. 318272.
This publication reflects only the author’s views and the European Union is not liable for any use
that may he made of the information contained therein.
• Collaborative, three year project (2012-
2015) on water & ICT
• Cluster of ten projects www.ict4water.eu
• The aim of iWIDGET is to advance
knowledge and understanding about
smart metering technologies
MAIN ISSUES
 Water demand/consumption monitoring
 Near real time
 Utility networks and
households
 Efficiency
 Water loss management (utility and
customer side)
 Supply- Demand management
 Water and Energy management
 Water demand forecasting
credit: Huffington Post
credit: amtel.com
MAIN ISSUES
 Customer behaviour?
 Home Display Units/Apps/Web Portals
 Social Media
 Gamification
 Decision Support Systems
 Big Data / Analytics
 Utility
 Customers
 Integration
 Asset Management
credit: British Ga
credit: synsysync.com
SOME CHALLENGES
 Sensors
 Cost, Size, Location, Energy
Consumption, Data Transmission…
 Standards
 Hardware and Software, IoT…
 Interoperability
 Data sharing
 Data Security & Privacy
 Personal information about
individuals Source: www.opensourcez.org
Source: city-countyobserver.com
SOME CHALLENGES
 Technology for Processing Large Amount of
Data
 Data validation, reconstruction
and aggregation algorithms
 Unified and standardised
metadata description
 Open Research Data and GEOSS Data
Sharing principles
 Integration of Water and Energy
Consumption Data
Source: ericbrown.com
Source: worldwaterweek.org
SOME CHALLENGES
 Business Case
 Benefits vs. Costs
 Cost vs. Value of water
 Business Model
 Who benefits?
 Who pays?
 ‘Human’ dimension
 ‘Say no to smart meters!’
 How to win over customers?
Source: stopsmartmeters.org.uk
IWIDGET SYSTEM
Water
sources
Water
treatment
works
Water
storage
Water
distribution
M M
M
M
M
M
M
M
M
M
M
M
M
M
M
M
Consumers
M
Supply
(Utility Domain)
Demand
(Customer Domain)
M Large water meters
M Customer water meters
Effluent
disposal
Wastewater
treatment
Wastewater
collection
Utility
control room
iWIDGET DSS
iWIDGET DSS
IWIDGET SYSTEM
HIGH LEVEL USE CASES
 Obtain water consumption
data
 Obtain energy data
associated with water
consumption
 Understand water
consumption
 Understand energy
associated with water
consumption
 Get assistance to increase
water use efficiency
 Control water use
 Obtain water consumption and
related energy consumption
data
 Understand water
consumption
 Understand energy associated
with water consumption
 Get support to increasing
operational efficiency
 Get support to increasing the
quality of service
 Get support to improve
consumer efficient water use
 Get support for system
planning and design
Utility Domain Consumer Domain
IWDIGET SYSTEM
 Household platform
HOUSEHOLD PLATFORM
 Home page with overview tabs
Great!
5 Smiley Faces
Indicates Household
Use is
Considered Efficient
Take Action!
1 Smiley Face
Indicates Household
Use is
Excessive
HOUSEHOLD PLATFORM
 Water Consumption – at different time scales
Daily
(for a month)
Hourly
(for a day)
HOUSEHOLD PLATFORM
 Monitoring of energy consumption
HOUSEHOLD PLATFORM
 Per-appliance energy consumption
HOUSEHOLD PLATFORM
 Comparison of annual consumption
Household
Consumption
in 2009
Household
Consumption
in 2008
HOUSEHOLD PLATFORM
 Comparison with other users
Your
Consumption
Average
Consumption in
the Area
HOUSEHOLD PLATFORM
 Comparison with other users (seasonal)
Your
Consumption
Average
Consumption in
the Area
HOUSEHOLD PLATFORM
 Comparison with most efficient user
Your
Consumption
Efficient User
Consumption
HOUSEHOLD PLATFORM
Breakdown
into
Water Uses
Consumption
Profile
HOUSEHOLD PLATFORM
 Warnings about leaks, bursts, etc.
HOUSEHOLD PLATFORM
 Household water bill forecast
HOUSEHOLD PLATFORM
 General indoor tips for water efficiency
displayed in virtual home
WATER UTILITY PLATFORM
Inflow and
Consumption
Time Series
Graph
Total Inflow and
Consumption
per DMA
WATER UTILITY PLATFORM
Consumption
Categories
Time Series
Graph
Consumption
Categories
per DMA
WATER UTILITY PLATFORM
Detailed
Water Balance
per DMA
Water Balance
per DMA
WATER UTILITY PLATFORM
Background
Leakage
Total
Background
Leakage
per DMA
WATER UTILITY PLATFORM
 Energy for pumping
WATER UTILITY PLATFORM
 Warning about faults, e.g., leaks, bursts...
WATER UTILITY PLATFORM
 Accurate Billing and Pricing Flexibility
CASE STUDY: BARCELOS
(PORTUGAL)
CASE STUDY: SOUTHERN WATER
(UK)
31/03/2015
CASE STUDY: ATHENS (GREECE)
 Water Meters are shown in blue, energy
and water meters are shown in red
ATHENS CASE STUDY
43
IWIDGET – SMART HOME
Water Meter Environmental
Parameter Sensor
Energy Meter
Data logger/transmitter
TO METER OR NOT TO METER?
 Water Companies use 3% of total energy
used in the UK (Water UK)
 In 2011-12 they emitted the equivalent of
about 4 million tonnes of carbon dioxide
(Ofwat)
 Leakage (Ml/day)
0
500
1,000
1,500
2,000
2,500
3,000
3,500
4,000
4,500
5,000 4,505
3,306
3,605 3,608 3,575
3,420 3,288 3,291 3,275
Source: Ofwat
 Majority of customers not metred
0.00
10.00
20.00
30.00
40.00
50.00
60.00
70.00
80.00
90.00
100.00
Not metered
Metered
TO METER OR NOT TO METER?
0
5
10
15
20
25
30
35
 Difference in consumption (metered/unmetered)
TO METER OR NOT TO METER?
 About 12% reduction in water
consumed – 1,000 megalitres
 400 Olympic-size swimming pools
 7,300 homes supplied for a year
 About 12% reduction in electricity
consumption for the UK Water
Industry – 250,000 GWh
 Electricity for 54,000 UK homes
for a year
 Saving water could ‘provide’ gas and
electricity for 660,000 homes per year
TO METER OR NOT TO METER?
SWN - CONCLUSIONS (1)
 Smart Water Networks
 network assets
 devices including water meters, pressure
sensors, water quality sensors, etc.
 sensor/meter data and information
 Integration
 business processes
 systems
 Support Operation
 Guide Strategy and Investment
SWN - CONCLUSIONS (2)
 Drivers
 Ageing infrastructure
 50% of London's pipes are over a
century old and 30% date beyond 150
years
 Cost implications
 Over 100 billion will need to be invested
in UK water infrastructure (by 2030)
 Health impacts
 Safe, reliable, affordable, and easily
accessible water supply is essential for
good health
~1Bn people
SWN - CONCLUSIONS (3)
 Aims
 Increase water efficiency
 Improve water management
 Manage water demand
 Reduce leakage
 Reduce energy requirements for water utilities
and households
 Increase end-user awareness
 Affect end-user behavioural change with (near)
real time surveillance and feedback
Thank you
d.savic@ex.ac.uk
iwidget.eu

Intelligent / Smart Water Systems

  • 1.
    INTELLIGENT (SMART) WATER SYSTEMS ProfessorDragan Savic FREng, FCIWEM, FICE
  • 2.
    OUTLINE  What areIntelligent/Smart Water Systems/Networks?  Why do we need them?  iWIDGET  project  case studies  To meter or not to meter?  Conclusions © The Smart Water Networks Forum
  • 3.
    WHAT ARE SMARTWATER NETWORKS?  Smart Water Network solutions improve the efficiency, longevity, and reliability of the underlying physical water network by better measuring, collecting, analyzing, and acting upon a wide range of network events. This can take shape in different phases of the utility process, such as real-time monitoring and automation, operational readiness, or network planning. Source: The Smart Water Networks Forum
  • 4.
    WHAT ARE SMARTWATER NETWORKS?  A smart water network is an integrated set of products, solutions and systems that enable utilities to remotely and continuously monitor and diagnose problems, prioritize and manage maintenance issues and use data to optimize all aspects of the water distribution network. Source: Sensus
  • 5.
    SMART WATER NETWORKS ©Sensus Smart Metering / Sensors are at the heart of Smart Water Networks
  • 6.
    SMART WATER METERING ViaAMR Source: www.nhojj.com To AMI Source: crenshawcomm.com From manual reading Source: www.purewatergazette.net  Time consuming  Costly  Infrequent  Prone to human error  Wireless transmission  Handheld receives  Drive-by  Fixed networks  Two-way communication s  Customers  Utility  Infrastructure
  • 7.
    WHY DO WENEED THEM?  Regulatory compliance  Optimize infrastructure renewal (TOTEX)  Increase distribution efficiency  GHG emissions  Energy optimization  Operational efficiency  Improve decision making  Guide strategy and investment  Improve customer satisfaction and
  • 8.
    WHY DO WENEED THEM?  Enormous investment needed  raised almost £100bn since the privatisation  will need another £100bn by 2030 (KPMG)  TOTEX focus – improved efficiency required  “no build” solutions  from “outputs” to “outcomes”  Customers at the heart of everything  every Pound of investment has to be justified in terms of how it benefits customers © Talent Development Water
  • 9.
    S The research leadingto these results has received funding from the European Union Seventh Framework Programme (FP7/2007-2013), under grant agreement no. 318272. This publication reflects only the author’s views and the European Union is not liable for any use that may he made of the information contained therein. • Collaborative, three year project (2012- 2015) on water & ICT • Cluster of ten projects www.ict4water.eu • The aim of iWIDGET is to advance knowledge and understanding about smart metering technologies
  • 10.
    MAIN ISSUES  Waterdemand/consumption monitoring  Near real time  Utility networks and households  Efficiency  Water loss management (utility and customer side)  Supply- Demand management  Water and Energy management  Water demand forecasting credit: Huffington Post credit: amtel.com
  • 11.
    MAIN ISSUES  Customerbehaviour?  Home Display Units/Apps/Web Portals  Social Media  Gamification  Decision Support Systems  Big Data / Analytics  Utility  Customers  Integration  Asset Management credit: British Ga credit: synsysync.com
  • 12.
    SOME CHALLENGES  Sensors Cost, Size, Location, Energy Consumption, Data Transmission…  Standards  Hardware and Software, IoT…  Interoperability  Data sharing  Data Security & Privacy  Personal information about individuals Source: www.opensourcez.org Source: city-countyobserver.com
  • 13.
    SOME CHALLENGES  Technologyfor Processing Large Amount of Data  Data validation, reconstruction and aggregation algorithms  Unified and standardised metadata description  Open Research Data and GEOSS Data Sharing principles  Integration of Water and Energy Consumption Data Source: ericbrown.com Source: worldwaterweek.org
  • 14.
    SOME CHALLENGES  BusinessCase  Benefits vs. Costs  Cost vs. Value of water  Business Model  Who benefits?  Who pays?  ‘Human’ dimension  ‘Say no to smart meters!’  How to win over customers? Source: stopsmartmeters.org.uk
  • 15.
    IWIDGET SYSTEM Water sources Water treatment works Water storage Water distribution M M M M M M M M M M M M M M M M Consumers M Supply (UtilityDomain) Demand (Customer Domain) M Large water meters M Customer water meters Effluent disposal Wastewater treatment Wastewater collection Utility control room iWIDGET DSS iWIDGET DSS
  • 16.
  • 17.
    HIGH LEVEL USECASES  Obtain water consumption data  Obtain energy data associated with water consumption  Understand water consumption  Understand energy associated with water consumption  Get assistance to increase water use efficiency  Control water use  Obtain water consumption and related energy consumption data  Understand water consumption  Understand energy associated with water consumption  Get support to increasing operational efficiency  Get support to increasing the quality of service  Get support to improve consumer efficient water use  Get support for system planning and design Utility Domain Consumer Domain
  • 18.
  • 19.
    HOUSEHOLD PLATFORM  Homepage with overview tabs Great! 5 Smiley Faces Indicates Household Use is Considered Efficient Take Action! 1 Smiley Face Indicates Household Use is Excessive
  • 20.
    HOUSEHOLD PLATFORM  WaterConsumption – at different time scales Daily (for a month) Hourly (for a day)
  • 21.
    HOUSEHOLD PLATFORM  Monitoringof energy consumption
  • 22.
  • 23.
    HOUSEHOLD PLATFORM  Comparisonof annual consumption Household Consumption in 2009 Household Consumption in 2008
  • 24.
    HOUSEHOLD PLATFORM  Comparisonwith other users Your Consumption Average Consumption in the Area
  • 25.
    HOUSEHOLD PLATFORM  Comparisonwith other users (seasonal) Your Consumption Average Consumption in the Area
  • 26.
    HOUSEHOLD PLATFORM  Comparisonwith most efficient user Your Consumption Efficient User Consumption
  • 27.
  • 28.
    HOUSEHOLD PLATFORM  Warningsabout leaks, bursts, etc.
  • 29.
  • 30.
    HOUSEHOLD PLATFORM  Generalindoor tips for water efficiency displayed in virtual home
  • 31.
    WATER UTILITY PLATFORM Inflowand Consumption Time Series Graph Total Inflow and Consumption per DMA
  • 32.
    WATER UTILITY PLATFORM Consumption Categories TimeSeries Graph Consumption Categories per DMA
  • 33.
    WATER UTILITY PLATFORM Detailed WaterBalance per DMA Water Balance per DMA
  • 34.
  • 35.
    WATER UTILITY PLATFORM Energy for pumping
  • 36.
    WATER UTILITY PLATFORM Warning about faults, e.g., leaks, bursts...
  • 37.
    WATER UTILITY PLATFORM Accurate Billing and Pricing Flexibility
  • 38.
  • 39.
  • 40.
  • 41.
     Water Metersare shown in blue, energy and water meters are shown in red ATHENS CASE STUDY
  • 42.
    43 IWIDGET – SMARTHOME Water Meter Environmental Parameter Sensor Energy Meter Data logger/transmitter
  • 43.
    TO METER ORNOT TO METER?  Water Companies use 3% of total energy used in the UK (Water UK)  In 2011-12 they emitted the equivalent of about 4 million tonnes of carbon dioxide (Ofwat)  Leakage (Ml/day) 0 500 1,000 1,500 2,000 2,500 3,000 3,500 4,000 4,500 5,000 4,505 3,306 3,605 3,608 3,575 3,420 3,288 3,291 3,275 Source: Ofwat
  • 44.
     Majority ofcustomers not metred 0.00 10.00 20.00 30.00 40.00 50.00 60.00 70.00 80.00 90.00 100.00 Not metered Metered TO METER OR NOT TO METER?
  • 45.
    0 5 10 15 20 25 30 35  Difference inconsumption (metered/unmetered) TO METER OR NOT TO METER?
  • 46.
    TO METER ORNOT TO METER?  About 12% reduction in water consumed – 1,000 megalitres  400 Olympic-size swimming pools  7,300 homes supplied for a year  About 12% reduction in electricity consumption for the UK Water Industry – 250,000 GWh  Electricity for 54,000 UK homes for a year
  • 47.
     Saving watercould ‘provide’ gas and electricity for 660,000 homes per year TO METER OR NOT TO METER?
  • 48.
    SWN - CONCLUSIONS(1)  Smart Water Networks  network assets  devices including water meters, pressure sensors, water quality sensors, etc.  sensor/meter data and information  Integration  business processes  systems  Support Operation  Guide Strategy and Investment
  • 49.
    SWN - CONCLUSIONS(2)  Drivers  Ageing infrastructure  50% of London's pipes are over a century old and 30% date beyond 150 years  Cost implications  Over 100 billion will need to be invested in UK water infrastructure (by 2030)  Health impacts  Safe, reliable, affordable, and easily accessible water supply is essential for good health ~1Bn people
  • 50.
    SWN - CONCLUSIONS(3)  Aims  Increase water efficiency  Improve water management  Manage water demand  Reduce leakage  Reduce energy requirements for water utilities and households  Increase end-user awareness  Affect end-user behavioural change with (near) real time surveillance and feedback
  • 51.

Editor's Notes

  • #6 Integrated in all business processes Information and knowledge used to support operation and guide strategy and investment
  • #40 3DMAs, 400 customers
  • #41 2000 households
  • #42 20 volunteers
  • #45 Energy costs are increasing year on year. Up to a quarter lost after the water meter (on supply pipes) Total UK Co2 emissions (2010) 7.8 tons per person. Edinburgh, Scotland – 595,555  Liverpool, Lancashire and Cheshire – 552,267  Bristol, Wessex – 535,907  Sheffield, Yorkshire – 530,375  Bradford, Yorkshire – 526,369  Cardiff, Wales – 521,711  Manchester, Lancashire and Cheshire – 520,739
  • #48 Corby, Northamptonshire – 54,927  Canterbury, Kent – 54,880  Barry, Vale of Glamorgan – 54,673  Christchurch, Dorset – 54,210
  • #49 ~20,000 KWh per annum for an average household ~22 million households =25% x 20,000 = 5,000KWh for water heating =12% x 5000 = 600 KWh per household saved through less water use Birmingham, West Midlands – 1,224,136