SlideShare a Scribd company logo
1 of 24
Download to read offline
Sierra F.J. – Fissore A.D. 1
HIGHWAY GEOMETRIC DESIGN MANUAL ARGENTINA1
General Topics: Highway Design Manual - Technical/Research topic2
3
4
5
Francisco Justo Sierra6
Av. Centenario 1825 9A (1643) Beccar, San Isidro, Buenos Aires – Argentina7
Tel.: +54 11 47471829; Email: franjusierra@yahoo.com8
9
Alejandra Débora Fissore10
Florida 141 - 1A (4400) Salta Capital, Salta – Argentina11
Tel.: +54 9 387 4571892; Email: alejandra.fissore@gmail.com12
13
14
Word count:15
In abstract: 25016
In text: 635817
Figures: 3 x 250 words (each) = 75018
Total Word: 710819
20
21
22
Submission Date: 2015-04-2823
24
25
Sierra F.J. – Fissore A.D. 2
Abstract1
What and When:2
 In 2009, The Argentina National Highway Administration (DNV) hired to Civil Engineering3
Mountain School of National University of San Juan (EICAM) to develop the 2010 Update of Geometric4
Design Standards for DNV 1967/80.5
 Term 12 months6
Update’s background:7
 New knowledge on how highway’s visible elements affect traffic safety and operation8
 Driver´s behaviors, technological breakthroughs, flexibility in highway design9
Title:10
 STANDARDS AND RECOMMENDATIONS ON GEOMETRIC DESIGN AND ROAD11
SAFETY12
Why:13
Milestones in Geometric Design between 1967 and 2009 not covered in the current DNV:14
 Clear zone15
 Friction Coefficient (AASHTO 1971 Addendum)16
 Design Consistency17
 Modern Roundabouts18
 Test Levels and reasons for energy attenuation devices19
Who:20
 General Director, Technician, Writers and Consultants: 11 Engineers and 1 Architect.21
 Monitoring, Review and Consultants 11 Engineers and 1 Surveyor22
 Assistance from respected local and foreign engineers: John Morral (Canada); Speier,23
Echaveguren (Chile); Rocci and Xumini, (Spain).24
How:25
 Bibliographical Revision: Argentina, USA, Canada, Spain, South Africa, Australia26
 Non-Binding Survey on Road Standards Users: Consultants, Project Managers, Road27
Geometric Design University Teachers, Builder and Inspectors, Road Corporations28
 Presentation of findings In The XV Argentinean Road And Traffic Congress, September 200929
 Non-Binding Request upon the document´s draft30
 Submission of Final Report Approved by DNV Studies and Projects Division:31
- 10 Chapters, Atlas, General Bibliography, Specific Bibliography per chapter)32
- Found on ingenieriadeseguridadvial.blogspot.com33
 Exposure Course for DNV’s Professionals, 23 to 26th, August 2011, with invitation to present34
well-grounded and written proposals to change or disregard Update's topics (none have been received).35
The Standard has not been enforced.36
37
Sierra F.J. – Fissore A.D. 3
1 INTRODUCTION1
The Argentine Republic is a federal republic located in southeastern South America. It is bordered by2
Bolivia and Paraguay to the north; the Drake Passage to the south; Brazil, Uruguay and the South Atlantic3
Ocean to the east; and Chile to the west.4
Some characteristic data of Argentina:5
Geographic Data6
7
Area (km2) 2,780,400 (0.3 of Canada)8
Population 2014 42,670,000 (1.2 of Canada)9
Density (inh/km2) 15.3 (4.3 of Canada)10
11
Road Network Extension/Composition12
13
Primary - National Jdx. Secondary - Provincial Jdx. Total14
km % km % km %15
Paved Road 35,500 90 43,350 23 78,850 3516
Improved Road 3,000 8 36,850 20 39,850 1717
Dirt Road 1,100 3 108,700 58 109,800 4818
Total 39,600 100 188,900 100 228,500 10019
20
21
Total Paved National Network 35,500 10022
Total Divided Highway in National Network 3,500 1023
24
Total National and Provincial Network 228,500 3625
Tertiary Network - Communal Jdx. 400,000 6426
Total Argentine Highway System 628,500 10027
28
Vehicle Fleet (N°)29
30
Cars Light Com Trucks Buses Total31
10,060,000 2,460,000 690,000 90,000 13,300,00032
76% 18% 5% 1% 100%33
34
Yearly Fatalities (N°/year)35
36
Maximum Minimum Average37
10,000 5,000 7,50038
39
Daily average Fatalities (N°/day)40
41
Maximum Minimum Average42
27 14 2143
44
45
Sierra F.J. – Fissore A.D. 4
1.1 Summary1
The update DNV 2010, (AVN10) of de DNV – 1967/80 standards (NDGDNV’67/80) is based on how new2
knowledge affects safety and traffic operation taking into account visible elements of the road.3
The update bears in mind driver behaviour, technological advances and design flexibility (sensitivity to the4
natural and artificial environment)5
1.2 Objectives6
 Synthesize, organize and standardize the general judgment for surveys, location and design of7
arterial rural roadways, and occasional urban roads, under The Argentina National Highway Administration8
(Dirección Nacional de Vialidad Argentina, DNV) jurisdiction.9
 Encourage the design and construction of safe and effective roads for the welfare of the10
community and society in general11
 Ensure that all road projects will be built according to a set of standards that include12
consideration of local circumstances13
 Gather actual in force DNV technical documents related to the geometric design and road safety14
 Define the processes and standards that provide adequate levels of roads efficiency (mobility,15
safety, economy, comfort) according to national plans and investment strategies16
 To place emphasis on resulting document’s self-sufficiency17
1.3 Scope18
These standards address a broad spectrum of road types in the national network, from multilane highways19
carrying tens of thousands of vehicles per hour, to single two-lane two-way roads, with ADT<500.20
It is recommended:21
 To give more flexibility to the design, emphasizing on the horizontal and vertical alignment22
coordination and consistency23
 To improve safety and conditions of passing manoeuvre particularly on curves, which24
unfortunately have been diminished by the 24449 Act provision, although it would have been best to allow25
overtaking in curves to the left with appropriate visibility.26
As all road projects are different and cannot cover all specific conditions, the standards, recommendations27
and guidelines are general in nature; and are based on assumed future conditions of vehicles and drivers28
and transportation demands, which vary with time, and so it is normal to review and update them29
periodically.30
The AVN10 does not mean that the roads previously designed are unsafe.31
The purpose of the update is to provide more satisfactory designs of new roads and major reconstructions32
of existing roads.33
To assess the quality of existing roads, rules and updated new recommendations should not be used as a34
simple checklist, regardless of the limitations and predominant circumstances at the time of conception and35
application.36
These standards and recommendations do not replace the knowledge, experience or good engineering37
judgment.38
It includes techniques, graphs and tables to help solve problems of visible features design along the way.39
Rather than based on our own research, this update emerges from reading and reviewing road leading design40
agencies’ publications and an eclectic selection of the most important findings in the specialty over the past41
50 years.42
Sierra F.J. – Fissore A.D. 5
Experiences and findings of Ken Stonex in the General Motors Proving Ground were taken into account,1
along with the Green and Yellow Books, the Roadside Design Guide, the Highway Safety Manual (draft)2
AASHTO, as well as technical rules and reports from Canada, Europe, Australia, South Africa, New3
Zealand ...4
1.4 Premises5
Platform design. Adjust the coefficients of the mathematical models used, placing emphasis on the6
coordination and consistent design.7
Roadside design. Incorporate the concepts of clear-zone, and justification of containment devices.8
At-grade intersections and interchanges. Include Modern Roundabouts and Single-Point Diamond9
interchange type.10
Urban highway crossings. Avoid them, or exceptionally design them with suitable traffic-calming devices11
Economic profitability. Consider the economic benefits that result from a reduction of crashes, resulting12
in lower costs of fatalities, injuries and property damage.13
Conceptual approach. Ezra Hauer, 199914
 Roads designed according to the standards are neither safe nor unsafe or properly safe; only15
have an unknown safety level. There are only more or less safe roads16
 Banish myth: Only drivers cause crashes, not roads17
1.5 Background18
1.5.1 Criteria and geometric design tools evolution19
Since automobile invention.20
 Stopping Sight Distance [Chapter 3, C3]21
 Road shoulders width and condition [C3]22
40/50’s.23
 Design speed [C2]: maximum safe speed is a good guesswork, although is not always supported24
by reality, in which efficiency geometric design is measured by the Substantive Safety concept [C1]25
(reducing the number of deaths, number and severity of injuries, and material damage costs), and not by26
the Nominal Safety [C1], which considers that a road is safe if it complies with the standards.27
 Safety = f (dynamic balance curves)28
 Barnett tables (horizontal curves with spiral transitions) and Viguria (vertical curves)29
60’s.30
 Clear-Zone Ken Stonex USA [C3] = f (human factor)31
 Consistency Design [C3] Safety = f (ΔCm; expectations and driver comfort)32
 Hans Lorenz’s criteria (German Autobahn). Curvature profile graph [C3]33
NDGDNV’67.34
 Three Chapters; still in force35
 Horizontal and vertical alignments coordination [C3]36
 Guardrail application [C7] as safety panacea, replacing the old reinforced concrete parapets37
70’s.38
 Addendum Stopping Sight Distance AASHTO Model [C3] human factor → wet road (night39
operation). Absolute minimum and desirable values.40
Sierra F.J. – Fissore A.D. 6
80’s.1
 Leisch Criteria [C3]; Safety = f (ΔVD successive curves ≤ 10 mph); VD or V: Design Speed2
NDGDNV’80.3
 Five Chapters added to NDGDNV'67, still in force; intersections, interchanges, containment4
devices, lighting, culverts geometry ...5
 Wide circulation of highway programs, managing large databases alignments, speeds, traffic6
crashes7
 Newton → Poisson, Bayes (dynamic equilibrium statistics); obtained by mathematical8
regression models that relate the actual speed [C2] (index of driver behaviour) to average curvature (Cm)9
[C3] the horizontal alignment (best fit: linear function)10
90’s.11
 Operating speed (VO) in free flow = best index of driver behaviour (desired speed)12
 The horizontal curvature is geometric parameter which predominantly determines VO.13
 Operating speed VO85 [C2]: VO under ideal conditions: free flow, only cars, wet road.14
 Consistent Design [C3] VO85 ≈ VD15
 If VO85 ≠ VD → Inconsistent design (by ranges) → crash concentration; black points16
VD ↓ Test17
Cm ↓ Alignment18
VO85→ ∆VO85 ↕ Behaviour19
∆Crashes → ∆Cost ↕ Loop20
 Safety Criteria [C3] (Lamm and others):21
Safety = f1 (VD - VO85); f2 (VO85i - VO85i+1); f3 (fR - fRA)22
fR: side friction assumed; fRA: side friction demanded23
 Geometric design ranges: Good, Fair, Poor24
 Modern roundabouts [C5]: global revaluation of safety benefits, capacity, cost, aesthetics.25
 Traffic Calming [C8]26
 Design flexibility [C1]. Context Sensitive Design, according to cultural, historical, social and27
environmental values28
 Partial or full paved shoulders [C3]; for equal cost is much better than widening them.29
 Access Management [C2]; greater safety, traffic flow, capacity of the arterial roads.30
90-11’s.31
 Evaluation of road safety: qualitative → quantitative32
 Development IHSDM, HSM [C3] programs33
 Glennon, Leisch, Zeeger, Hauer, Krammes ... established the basic principles unanimously34
accepted and adopted about the new concept (philosophy, paradigm) of Geometric Design: Design taking35
into account the behaviour of the normal driver, not expecting people to behave as the designer wants ... as36
our visionary engineer Pascual Palazzo already foretold in 1937: “There is but one way to avoid crashes on37
the roads, and that is to make them unlikely. But not unlikely for an ideal species of prudent, thoughtful,38
intelligent drivers and pedestrians with rapid reactions, but for ordinary men as they are or become in the39
different circumstances of daily life.”40
 The design philosophy, systems and techniques developed throughout this document are based41
on the Design Speed concept [C2] and the geometric related parameters.42
 If reliable local data of operating speed 85th percentile of free flow traffic is available, design43
consistency programs (IHSDM, EICAM) can be used. They relate the operating speed profiles with44
Sierra F.J. – Fissore A.D. 7
probable crash occurrence. New coefficients which are being developed in international road activity relate1
safety with cost effectiveness, need to be applied.2
1.5.2 Chronology of Sources: 1954-19803
4
Figure 1. Chronology of Sources: 1954-19805
6
1.5.3 Chronology of Sources: 1980-20107
AASHO-BLUEBOOK1(RURAL)
AASHO-REDBOOK1(URBAN)
AASHO-BLUEBOOK2(RURAL)
AASHO-YELLOWBOOK1+FHW
AASHO-ADENDUMSIGHTDISTANCE
AASHO-REDBOOK2(URBAN)
AASHTO-YELLOWBOOK2+FHW
AASHTOBARRIERGUIDE
54 57 65 67 68 71 73 74 77 80
STANDARDDNV67
STANDARDDNV80
Sierra F.J. – Fissore A.D. 8
1
Figure 2. Chronology of Sources: 1980-20102
2 CONTENTS3
The update is organized in 4 Volumes and 1 Atlas:4
 VOLUME 15
- CHAPTER 1 INTRODUCTION6
- CHAPTER 2 DESIGN CONTROLS7
- CHAPTER 3 GEOMETRIC DESIGN8
 VOLUME 29
- CHAPTER 4 FREEWAYS10
- CHAPTER 5 INTERSECTIONS11
- CHAPTER 6 INTERCHANGES12
 VOLUME 313
- CHAPTER 7 ROAD AND ROADSIDE SAFETY14
- CHAPTER 8 SPECIAL DESIGNS15
 VOLUME 416
- CHAPTER 9 ROUTE LOCATION17
- CHAPTER 10 GENERAL INSTRUCTION18
AASHTO-GRRENBOOK1
AASHTO-ROADSIDEDESIGNGUIDE1
AASHTO-GRRENBOOK2
AASHTO-GRRENBOOK3
AASHTO-ROADSIDEDESIGNGUIDE2
FHWAROUNDABOUTGUIDE
AASHTO-GRRENBOOK4
AASHTO-ROADSIDEDESIGNGUIDE3
PIARCROADSAFETYMANUAL
AASHTO-GRRENBOOK4
80 84 89 90 94 96 97 98 99 0 1 2 3 4 5 6 7 10
STANDARDDNV80
HONDURAS
AUSTRALIA
COLOMBIA
CANADA
PERU-CENTRALAMERICA
CHILE
UNITEDKINGDOM
SOUTHAFRICA
BOLIVIA-DOCUMENTDNV
ACTUALIZATIONDNV10
Sierra F.J. – Fissore A.D. 9
 ATLAS1
2.1 Chapter 1: INTRODUCTION2
2.1.1 New approaches in the design philosophy3
“Roads designed to standards are not safe, not unsafe, nor are they appropriately safe; roads designed to4
standards have an unpremeditated level of safety”. Dr. Ing. Ezra Hauer, 19995
Traditional design.6
 Based on vehicle design capabilities and Newton’s laws of motion7
 A design according to the design speed is safe8
New approaches.9
 Design according to the standards are not necessarily safe10
 Priority to road safety and issues related to driver behaviour, and environmental impact11
2.1.2 Route Location importance12
The achievement of a road design project is accomplished by successive approximations; it goes from13
generalities to the specific, from broad features to details.14
Chronologically, the exploration, survey and road location is the first phase to determine where the new15
road will go. After that, it is necessary to design the horizontal and vertical alignments, to carry on the final16
study, to design the drainage, and finally the Final Design. The choice of the route-location is direct17
responsibility of the project manager, or an experienced professional with strong technical and practical18
training, and updated in technological innovations.19
The project depends on and has to adjust to design criteria that were taken into account when the route-20
location was adopted.21
In terms of safety, economy and environmental effects, it is more costly to correct flaws in a finished project22
than to do complementary studies to reduce risks beforehand.23
2.1.3 Design Techniques24
Design-domain concept. There is a range of possibilities, between the upper and lower absolute limits,25
which could be adopted for a particular design parameter. The figure adopted in the design-domain could26
result in an acceptable, but variable, level of behaviour under average conditions, in terms of safety,27
operation, and economic and environmental consequences.28
2.1.4 Fundamental principles29
Compulsory standards. They are the essential to achieve the overall objectives of the design. They are30
indicated as “must”.31
 Design speed: is a design parameter, not a visible feature. Its value may vary without violating32
the norm; i.e., when the environmental or topographical conditions change and the principles of ‘zoning’33
speeds are applied34
 Stopping sight distance35
 Minimum and maximum radii36
 Transition spiral curve throughout all superelevated curve37
 Minimum and maximum superelevation38
 Vertical clearance of bridge39
 Superelevation development on transition curve40
 Minimum vertical curve K value41
Sierra F.J. – Fissore A.D. 10
 Maximum longitudinal grade1
 Shoulder cross-slope on high side superelevated curve2
 Lane width; widening lanes on horizontal curves3
 Width, and full or partial paved shoulders4
 Pavement Edge without Drop-Offs5
 Width bridge and culverts6
 Cross-slope road7
 Test-level of safety devices8
 Median width9
 Gas Service properly located10
 Paving outer shoulder on superelevated curves11
 Cross-slope outer shoulder of superelevated curve, equal to adjacent lane12
Permissive standards or recommendations. All other provisions of an advisory nature, whether indicated13
by the use of “should” or “may” or “recommend” are permissive with no requirement for the intended14
application.15
 Clear zone16
 Fixed objects: remove, relocate, modify, protect, delineate17
 Traversable slopes18
 Design longitudinal barrier alignment19
 Shoulder and edgeline rumble strips20
 Decision sight distance at complex at-level intersection and interchanges approaches21
 Maximum length (≈ 20 m) cross-slope road < 2% on flat area22
 Right-Of-Way (ROW) width (including interchanges)23
 Coordination horizontal and vertical alignments24
 To include modern roundabouts between design options25
 Auxiliary lane for slow trucks passing26
 Centerline rumble strips27
 Driveway and access density management28
 Discourage urban crossing road29
 Passing sight distance frequency30
2.1.5 Design exceptions31
They are defined as those cases where levels lower than the minimum are used. They may be approved in32
the planning or design phases. The approval of all exceptions must be documented and presented using the33
administrative steps instructed in [C10]. They must have the approval of the Manager of Studies and34
Projects DVS [C10].35
2.1.6 Nominal Safety and Substantive Safety36
Nominal safety. Evaluation of compliance with the rules, justifications, guidelines and design procedures37
approved.38
Substantive safety. Evaluation of the frequency and severity of actual or anticipated crashes for a road or39
road segment or intersection.40
2.1.7 Glossary41
To establish common ground and to facilitate the uniform understanding of the main processes of geometric42
design and road safety, Glossary [S1.9] summarizes the terminology adopted, with some terms used in the43
construction. The definitions and terms given by the 24.449 Act. are particularly important.44
Sierra F.J. – Fissore A.D. 11
It is crucial to avoid any misunderstanding between planners, designers and builders in the specific1
activities.2
2.2 Chapter 2: DESIGN CONTROLS3
The design of the visible features of a road is influenced by:4
 Topography5
 Speed6
 Traffic volume and composition7
 Vehicle design8
 Environmental factors9
 Functional classification10
 Access Management11
A good design will take into account simultaneously all the basic controls, according to its importance.12
2.2.1 Human Factors13
Components of the road transport system. The user, vehicle and road. Each one contributes to the quality14
of traffic, which results from complex combinations and interactions of these components.15
Humans are fallible, they make mistakes, many of which are induced by defects in the visible features of16
the roadway.17
Road design standards should be based on behaviour, needs, human capabilities and limitations.18
Crashes prevention. Generally, a car crash is the end result of a multiple-step process. According to the19
actions taken in any of these steps, a crash can or cannot be avoided.20
Driver expectations. When a design is incompatible with the drivers or other road users’ capabilities, the21
chances of making mistakes and producing crashes grow.22
If road perception is clear and consistent, the task of adaptation is easier and the response of drivers will be23
more appropriate, predictable and uniform24
Driver expectations are related to the design consistency:25
 The road must confirm what drivers expect, based on previous experience.26
 Drivers must deal with clear clues about what is expected from them27
Conclusion. The development of any technical system should acknowledge the possibility of error, and28
the road transport system is not the exception to this reality.29
Past. Drivers ‘accused’ of making a mistake, taking inappropriate behaviour or having limited driving30
skills.31
Present. It is recognized that effective solutions to the problem require much more than simply32
identification of the ‘guilty’ part.33
Future. A bigger number of elements is expected to be consider to minimize human errors and their effects,34
which should lead to an improvement of the safety level of the road networks.35
2.2.2 Speed36
There is an interactive relationship between road and speed. The actual speed which will be used on the37
road depends largely on the characteristics of the selected design; however estimating these speed ‘a priori’38
is a difficult task for the design team, given the lack of measurements of actual speeds in Argentina.39
Speed design - Recommendations.40
Sierra F.J. – Fissore A.D. 12
 Topography determines speed ranges1
 On uniform topography, speed is constant. And its value depends on topography and road2
category3
 A change of speed is justified when there is a change in topography of an appreciable length4
and the terrain predisposes the driver to accept the speed variation5
 There shouldn’t be abrupt speed variations (10 to 10 km/h)6
 If there is no significant cost increase, it is recommended to project a higher speed road7
category.8
2.2.3 Access Management9
Land use. Uncontrolled development. Arterial roads are vital links between communities and serve as10
essential corridors for trade, travel, tourism and recreation. These roads generally promote land division, as11
well as residential and commercial growth along the entire strip.12
This growth creates safety problems which result in more deaths, injuries, property damage and traffic13
congestion; there is consequently need for costly improvements like additional lanes, detours, turn lanes,14
intersections and traffic lights.15
Unfortunately, few communities pass by-laws and ordinances to control the type and quality of the roadside16
development. Taxpayers must bear the costs associated with this development.17
Good land use planning, sensible regulation and reasonable site planning guides help reduce congestion18
and conflicts.19
2.3 Chapter 3: GEOMETRIC DESIGN20
2.3.1 Meaning of ‘geometric’ adjective21
Geometric Design. Design of visible features of the road.22
Geometry. A useful tool for the designer.23
The ‘geometric’ design does not consist in solving geometry problems, or strictly adopting figures in tables24
and graphs without first discerning their convenience according to specific conditions of the place or the25
type of road that will be designed.26
2.3.2 Stopping Sight Distance27
The expression of the braking distance is an empirical formula of a complex phenomenon. The differences28
between the simple theoretical model and the measurements are adjusted by the longitudinal friction or29
deceleration coefficient.30
Until 1971, AASHTO criteria were to consider longitudinal friction wet pavement, and the speed between31
80 and 93% of the design speed. Marching at design speed when the pavements were wet, was considered32
unrealistic.33
The AASHTO 1971 Addendum, based on the result of numerous field observations regarding the behaviour34
of drivers on wet roads, took the criteria of designing with 100% of the design speed on wet pavement.35
AVN10. According AASHTO Green Book'94 adopts:36
 Brake reaction time = 2.5 s37
 fl = wet longitudinal friction38
 100% speed39
VN'67/80. Still in force, adopts40
 Brake reaction time: variable according to speed41
Sierra F.J. – Fissore A.D. 13
 fl: longitudinal friction between dry and wet. Variable according to speed1
 100% speed2
2.3.3 Horizontal Alignment3
Horizontal alignment curvature. American Terminology: Cm. European terminology: CCR Curvature4
Change Rate, [gon/km]5
 







m
rad
L
e2ce1
L
Δ
Cm

6
Maximum side friction coefficient (ftmáx). The AVN10 adopts ftmáx according to AASHTO Green7
Book'94.8
Absolute minimum radius (RmínAbs). For VD and Maximum Superelevation Rates (emáx) given, it9
corresponds to the border condition of safety in relation to the lateral slipping; it considers maximum side10
friction.11
ftmáx)127(emáx
2V
RmínAbs

12
Desirable minimum radius (RmínDes). For VD and emáx given, it is the radius calculated considering13
average running speed (VMM) and a side friction coefficient equal to zero.14
0)127(emáx
2VMM
RmínDes

15
Distribution superelevation and side friction, R function. The AVN10 adopts VN'67/80 Nº 3 method;16
similar to AASHTO Green Book Nº 4 method.17
The superelevation entirely counteracts the centrifugal force of a vehicle traveling in free flow at VMM,18
from RmínDes where superelevation is maximum. For smaller radii until RmínAbs, the maximum19
superelevation rate is maintained.20
Sierra F.J. – Fissore A.D. 14
1
Figure 3. Distribution superelevation and side friction2
Maximum safe speed (VMS). Maximum speed that can be maintained along a single horizontal curve (R)3
when the pavement is wet, tires are in good condition, the superelevation (e) is as designed and side friction4
is maximum (ftmáx).5
R(e+ftmáx)VMS= 1276
Radius consecutive curves. The horizontal alignment is one of the most influential factors in the speed of7
drivers. Operating speed variations along a road affect the frequency of crashes; the higher and the more8
unexpected the variety value, the greater the probability of collision.9
Ratio design. It is a significant improvement over the traditional design methods, which only checked the10
accomplishment of the minimum radius.11
Transition spiral curve. Unlike VN'67/80 the length of the transition spirals is limited, and long transitions12
are not recommended.13
2.3.4 Vertical Alignment14
Vertical curvature.15
 %
%
m
KL(m) i





16
Sierra F.J. – Fissore A.D. 15
K represents the length of horizontal projection of the vertical curve per percent change in algebraic1
difference of tangent grades.2
AVN10. Use the AASHTO model with heights as DNV practice.3
 h1 = 1.1 m height of eye4
 h1 = 0.6 m headlight height5
 Height of object:6
- Daily operation: h2 = 0.3 m (absolute)/0.15 m (normal)/0 m (desirable)7
- Night operation: h2 = 0.6 m (rear lights height)8
 Height of vehicle = 1.3 m9
 Light beam angle on the longitudinal axis α = 1º10
 Height of eye of trucker; h1 = 2.2 m11
 Vertical clearance H = 4.5 m12
VN'67/80. Use the AASHTO model with the following heights:13
 h1 = 1.1 m height of eye14
 h2 = 0.20 m height of object15
 h1’ = 0.65 m height of headlight16
 h2’ = 1.35 m height of car17
 h1’’= 2.2 m height of eye of trucker18
 H = 4.5 m minimum vertical clearance19
 α = 1º angle of the light beam on the longitudinal axis20
2.3.5 Cross Section21
Geometrically, the typical cross section of a rural road is defined by the travelled way (lanes) and its sides:22
shoulders, slopes, ditches, and Right of Way (ROW) borders.23
The cross section elements affect the operational characteristics, safety and aesthetic.24
It should be designed according to patterns of speed, capacity and level of service, considering dimensions25
and operating characteristics of vehicles and driver behaviour.26
2.3.6 Roadsides (RS) – Clear Zone (CZ)27
RS. Both, external and internal areas to the side of the traveled way. One measured to the limit of the ROW28
border, and the other coinciding with the median.29
CZ. It is the unobstructed, traversable area provided beyond the edge of the traveled way for the recovery30
of errant vehicles. It includes shoulders, bike lanes, and auxiliary lanes, except those auxiliary lanes that31
function like through lanes.32
Whatever the reason, the driver that leaves the road, circulates through a potentially dangerous area. The33
probability of run-off-road crashes will be minimized if hazards at RS are reduced, and side slope is34
substantially flat, firm, unobstructed.35
The CZ tries to establish a balance between the benefits of having a safe, flat, firm road side that has no36
hazards, and the economic and social cost of providing for it.37
It does not establish a precise area of responsibility of the highway authority.38
It should be seen as a convenient width for the design, rather than an absolute demarcation between safe39
and unsafe conditions.40
Sierra F.J. – Fissore A.D. 16
The effectiveness of having a clear zone at the side of the road follows the law of diminishing returns: the1
first meter of clear zone has greater safety benefit over the second, and so on.2
Shoulders. The AVN10 adopts full or partial paved shoulders.3
Slopes. Safety conditions:4
 Steeper than 1:3 are dangerous (overturning)5
 Between 1:3 and 1:4 are traversable but non-recoverable; vehicles can move, but the driver will6
not be able to return to the road7
 1:4 or flatter are recoverable and traversable8
Bridges cross section. The AVN10 adopts bridge width equal to its access width.9
2.3.7 Design Consistency10
The concept of design consistency came up from the frequent disparities observed between design speed,11
V, allegedly uniform in the project, and the actual variable operating speed, VO.12
The differences between the VO and V reflect discrepancies between the reality of road design and what13
the driver expects from road design.14
The driver is surprised by unexpected road visible features called geometric inconsistencies; as a result, the15
driver feels his expectations are violated.16
These geometric inconsistencies demand higher driver attention; there is disparity between the driver's17
expectations and the actual mental load requirements.18
Drivers who recognize this disparity increase their level of attention and adjust their speed and/or road path.19
Those who fail to recognize this disparity or those who take too long to react, could choose incorrect speed20
or paths increasing the likelihood of crashes.21
Therefore, abrupt changes in the VO or in the road path are manifestations of high mental load demands22
associated with geometric inconsistencies.23
Sudden changes in VO are the leading cause of crashes on rural roads. Changes in the alignment can cause24
variations in the VO that increase the risk of crashes. One of the most critical design cases is the transition25
from tangent to cute curve (especially in isolated curves).26
Design consistency evaluation. Lamm’s approach to consistency analysis, suggests that there is a27
correlation between the average curvature and the occurrence of crashes. It states that drivers select a VO28
based on the perception of curvature, which does not necessarily correspond to the actual curve.29
It deals with the driver’s behaviour in two geometric elements:30
 Isolated single curves, and31
 Successive curves32
Methodology for assessing design consistency. Operating speed profile, VO. To identify and correct any33
inconsistencies in the geometric design of the road will significantly improve road safety.34
The VO usually indicates inconsistencies: when the road design does not coincide with the drivers’35
expectations, they reduce VO.36
The VO profile is the most practical and widely used way to improve the consistency of the geometric37
design. It is a graph where the VO is indicated on the vertical axis VO and the stations on horizontal axis.38
Considering a speed profile,39
 The difference between VO and V is a good estimator of the inconsistency of a single geometric40
element. Consistency Indicator I: ICI = │V-VO│41
Sierra F.J. – Fissore A.D. 17
 The reduction of VO between two successive geometric elements shows the inconsistencies1
experienced by drivers as they travel from one geometry element to the next. Consistency Indicator II: ICII2
= │VOI-VOI+1│3
Taking into account consistency indicator I and II, the model by Lamm quantifies design consistency and4
classifies road design into three categories:5
 Good. Consistent design with a low risk of crashes.6
 Fair. Tolerable level design with a significantly higher crash risk compared with the level of a7
good design. It does not necessarily imply a redesign, unless there is a serious safety problem documented.8
 Bad. Improper design which can lead to high crash rates. Requires a redesign.9
Models to estimate VO. Different models for cars and trucks were developed in different countries. They10
involve variables such as curvature, rate of change of curvature, longitudinal grade, length of tangents11
between curves, and rates of acceleration and deceleration.12
2.4 Chapter 4: FREEWAYS13
An arterial road must meet all the following conditions to be a freeway:14
 Two traveled ways, of at least two lanes each, which are physically separated.15
 Full control of access16
 Grade-separated crossroads17
 Interconnection with other roadways through interchanges18
 Exclusive to motor traffic19
 Superior design, suitable for high speed providing safety, comfort and economy.20
In Argentina we have the following superior road designs:21
FREEWAY = 24449 ACT DEFINITION22
AUTOVÍA = FREEWAY without FULL CONTROL of ACCESS23
SEMI-FREEWAY = FREEWAY without GRADE-SEPARATED CROSSROADS24
The so called ‘Autovías’, are neither defined in 24.449 Act nor by DNV.25
Besides, as the final intended design of an Autovía or Semi-freeway is that of a freeway, the urban crossings26
should be eliminated. In that case, the bypasses must have the appropriate features of a freeway.27
2.4.1 Wrong and good practices28
They were adapted from a Comprehensive Study of the Platform of Freeway and their Roadsides – Highway29
Technical Association of Spain30
2.5 Chapter 5: INTERSECTIONS31
Intersections can be at-grade or grade-separated. When crossroad are at-grade, separation is temporary.32
When there are grade-separate crossroads, there is spatial separation.33
2.5.1 Latest improvements borrowed from international practice34
 Charts to select different types of intersection (Alberta, Canada)35
 Intersection sight triangles according to AASHTO36
 Ramp width according to measurements of DNV37
 Computer software to generate turning paths of design vehicles38
 Sizing of channelization components39
 Modern Roundabouts40
Sierra F.J. – Fissore A.D. 18
2.5.2 Conflict points1
2.5.3 Modern Roundabouts2
Traffic circle. It enables high-speed merging and weaving of vehicles. Priority is given to entering3
vehicles, facilitating high-speed entries. Reference AASHO 1965 VN'67/80.4
Modern roundabouts. The circulatory roadway is a series of T-intersections. Priority is given to5
circulating traffic. The vehicles enter the intersection only when there is sufficient gaps in circulating traffic.6
Reference AASHTO 2000.7
Advantages:8
 It reduces vehicle speed9
 It increments the capacity and safety in comparison with other intersection at-grade10
 It solves all possible movement at an intersection, even reversals11
This chapter includes location criteria and parameters of geometric design.12
2.6 Chapter 6: INTERCHANGES13
2.6.1 Contents14
 Warrants15
 Desirable design features16
 Incorporation of interchanges Diamond single point, Directional, and Weight type17
 Review and correction of speed change lanes18
 Typical radii for each type of ramp (direct, semidirect, indirect)19
 Complementary issues (pedestrians, lighting)20
2.7 Chapter 7: ROAD AND ROADSIDE SAFETY21
2.7.1 Roadside, encroachments and crashes22
“While most of the crashes are attributed to driver errors, then why so many drivers make the same mistakes23
at the same locations of the road network? The crash black spots are not inventions”. Ruediger Lamm24
An encroachment occurs when a vehicle deviates from the limits of the lane.25
Most encroachments do not cause crashes, but most crashes occur due to encroachments.26
Frontal crashes (FC) usually occur when a vehicle crosses the centerline or median, and collides with27
another vehicle travelling the opposite direction.28
Run-off-road (ROR) crashes are associated to vehicles that deviate from the traveled way, invading the29
roadside (RS) and, in some cases, overturning or hitting natural or artificial fixed objects. These crashes30
usually involve single vehicles.31
FC and ROR are usually relate to:32
 Design constraints and visual limitations on the traveled way33
 Hazards in the roadsides34
They may be the result of the driver’s actions:35
 Involuntary: falling asleep, being distracted, driving too fast for the prevailing traffic conditions36
or road37
 Voluntary: performing an incorrect passing manoeuvre or running off the road to avoid a38
dangerous situation.39
Sierra F.J. – Fissore A.D. 19
Contributing Factors:1
 Speeding2
 Driver age3
 Alcohol or drug consumption4
 Health problems like fainting or having a stroke5
 Vehicle type6
 Weather conditions7
 Animals on the road8
To reduce the number of serious injuries and deaths, the goal should be to keep vehicles on the road, and9
prevent them from invading the roadsides. When this occurs, the design should strive to minimize the risk10
of running into dangerous conditions or dangerous objects on the roadside, trying to reduce the severity of11
eventual crashes. In order of priority, the following should be taken into account:12
1. Keeping vehicles on the roadway13
2. Reducing the risk of crashes14
3. Reducing the severity of the damage in the event of a crash15
2.7.2 Keeping vehicles on the roadway16
The basic philosophy of roadway design is to make an effort to keep the vehicles on the road. In order to17
accomplish this, the designer is helped by:18
 Geometric Design: through the sight distances, horizontal alignment, superelevation, vertical19
alignment, lane and shoulder widths, auxiliary lanes20
 Horizontal and vertical alignments coordination and design consistency21
 Friction and surface smoothness of pavement22
 Drainage. Eliminating water accumulation on the traveled way in order to avoid aquaplaning23
 Delineation24
 Rumble strips. Between 40 and 60% of ROR crashes are due to fatigue, sleepiness or25
distraction. Rumble strips are very effective devices to alert the drivers. On high speed and high traffic26
volume roads, their effectiveness is of 90%27
 Lighting. It contributes to road safety. However, it should be carefully designed, especially the28
type of light poles and their location.29
2.7.3 Involuntary run-off-road (ROR)30
The cars leave the traveled way for many reasons and move beyond it:31
 Driver error: excessive speed, sleep, recklessness, inexperience, careless driving, or driving32
under the influence of alcohol or drugs. A driver can also deliberately leave the road to avoid a collision33
with another vehicle, person, animal, or object on the roadway.34
 Road Condition: poor alignment, poor visibility, low friction pavement, potholes, rutting, poor35
drainage, road marking, road signing or delineation inadequate.36
 Failure of vehicle components: flaws in the steering and brakes, tire problem, instability of37
truckloads.38
Second design philosophy to reduce most of crashes: If accidental encroachments are inevitable, the sides39
of the road should be as clear and indulgent as reasonably possible, to give the opportunity to recover errant40
vehicles, stop safely, or back to the road, or reduce the severity of the damage resulting crash.41
2.7.4 Roadside hazards42
Fixed objects or conditions of the RS that its structure and location are, or may result, in a greater likelihood43
of material injury or death damage when a vehicle leaves the roadway.44
Sierra F.J. – Fissore A.D. 20
Hazardous roadside elements.1
 Trees and tree stumps. Specific hazards (a single tree), continuous hazards (rows of trees along2
the road)3
 Poles: lighting, utilities, gates, road signs, traffic lights, SOS poles4
 Bridge piers and abutments and tunnel walls placed at the median or external RS5
 Side Barriers which are old or improperly installed6
 Hazardous barrier end treatments poorly designed or wrongly located7
 Headwall culverts and parallel and transverse culverts8
 Large rock masses left at the RS9
Hazardous conditions.10
 Steep slopes11
 Ditches and backslopes12
 Rough backslopes13
 Permanent bodies of water: lakes, reservoirs, sea, rivers parallel to the road14
 Pavement Edge Drop-Offs15
2.7.5 Hazard treatments on forgiving roadsides16
The basic concept of a forgiving roadside is that of providing a clear recovery area where an errant vehicle17
can be redirected back to the roadway, stop safely or slow enough to mitigate the effects of the crash.18
Hazardous objects. There are six options for mitigation of objects within the forgiving roadside:19
 Remove them20
 Redesign the obstacle so it can be traversed safely21
 Relocate the obstacle to a point where it is less likely to be struck22
 Reduce impact severity by using an appropriate breakaway device23
 Redirect the errant vehicle with a longitudinal traffic barrier or use a crash cushion or both if24
the obstacle cannot be eliminated, relocated, or redesigned25
 Delineate the obstacle if the above alternatives are not appropriate26
Hazardous conditions. Concerning slopes and drainage conditions:27
 Flattening slopes more than 1:428
 Designing traversable profile ditches and rounded edges.29
Hazards. Recommendations for the following hazards:30
 Headwall culverts31
 Slopes32
 Trees33
 Poles34
 Pavement Edge Drop-Offs35
 Curb and barrier/guardrail36
2.7.6 Zegger Risk Rate37
The Zegger risk rate system considers the clear zone width, slope, the existence of hazardous objects and38
the roughness of the ground.39
The level of risk increases from 1 to 7. Seven being the most risky concerning frequency and severity.40
2.7.7 Barrier needs41
Sierra F.J. – Fissore A.D. 21
Barriers are not an indisputable choice for road safety. They are hazardous and can only be justified if a1
crash against it is less severe than crashing in the absence of a barrier.2
Every effort should be made in the design and construction stages to eliminate the need for barriers.3
Modern practice tends to design roads where barriers are unnecessary, resulting in greater safety and a4
lower cost.5
2.7.8 Containment and redirection systems6
The AASHTO Manual for Assessing Safety Hardware (MASH) contains the current recommendations for7
testing and evaluating the crashworthy performance of safety devices and has replaced NCHRP Report 350.8
In the update, it is shown a comparison between the Containment Level of the European Standard (EN-9
1317) and Test Level of the American Standard.10
To AVN10, crashworthiness of safety devices is currently accepted if the system has met all of the11
evaluation criteria listed in MASH or NCHRP Report 350 for each of the required crash tests.12
Longitudinal barriers. Classification according to deformation:13
 Rigid14
 Semi-rigid15
 Flexible16
Classification according to location:17
 Shoulder18
 Median19
This update establishes the design characteristics and use of each type of barrier.20
Transitions. Transition sections are necessary to provide continuity of protection when two roadside21
barriers of differing lateral stiffness are joined together. Transition sections with gradually increasing lateral22
stiffness are necessary when a roadside barrier joins another barrier system with dissimilar deflection23
characteristics, such as a W-beam guardrail connected to a bridge rail.24
This update establishes recommendations for transition design.25
Barrier end treatments. A vehicle impacting an untreated end of a barrier can result in serious damage.26
It may be stopped abruptly, barrier elements could penetrate the passenger compartment, or the vehicle may27
become unstable and eventually roll over.28
This update establishes recommendations for barrier end treatment.29
2.8 Chapter 8: SPECIAL DESIGNS30
2.8.1 Vehicle facilities31
 Vehicle inspection stations32
 Safe rest areas33
 Halts in historic sites and scenic overlooks34
 Modal transfer stations35
 Load control stations36
 Stations brake test37
 Escape ramps38
 Bus stops and docks39
 High Occupancy Vehicle lanes40
 Bus stop on freeways41
Sierra F.J. – Fissore A.D. 22
 Recreational roads1
 Access to commercial facilities – Gas stations2
2.8.2 Pedestrian facilities3
 Paths and trails: justifications, types, location and width4
 At-grade intersections: crosswalks5
 Grade-separated: under/high pass crosswalks, curb ramps, refuge islands6
 Mid-block crosswalks7
 Ramps8
 Stairs9
 Pedestrian safety10
2.8.3 Cycling facilities11
2.8.4 Railway at level crossings12
2.8.5 Utilities13
Especially the problem of poles14
2.8.6 Environment designs15
2.8.7 Fencing16
2.8.8 Plantations17
2.8.9 Landscaping18
2.8.10 Urban crossings19
Especially Mobility/Accessibility urban crossings, Traffic Calming20
2.9 Chapter 9: ROUTE-LOCATION21
The route-location seeks a combination of straight and curved alignments to suit the terrain and to meet the22
requirements.23
It is necessary to do preliminary work which basically comprises the comparative study of all corridors to24
select the one that has the best economical, technical, social, and aesthetic characteristics, trying to make it25
eco-friendly.26
2.9.1 Route-location selection factors27
Route-locations depends on design speed, and this depends on the function of the road, traffic and28
topography.29
When the area is mountainous, human, traffic and topography factors determine the Route-location. In a30
flat area, human, traffic and the land use factors are of key importance.31
2.9.2 Route-location stages32
They are tasks with similar characteristics. Route-location is not a linear process in which the stages take33
place one after another. It is rather a successive approximation process in which there is an overlap of the34
stages.35
2.9.3 Key technique for a good technical route-location36
In flat topography, the route-location technique is relatively simple. Tangents are considered first and then37
curves are drawn according to [C3].38
Sierra F.J. – Fissore A.D. 23
In mountainous topography the best technique is the opposite. On the contours of the terrain digital model,1
circular curves are placed first, taking into account the minimum gap required for spiral curves; and then2
tangents are drawn.3
2.10 Chapter 10: GENERAL INSTRUCTIONS4
This chapter deals with the stages definition and project documentation, topographic surveys, measurement5
tolerance, project plans, symbols, engineering reports submission, technical and administrative procedures6
for design exceptions.7
2.11 ATLAS8
Model plans of horizontal and vertical alignment, cross sections, graphs, charts, nomograms, studies and9
projects instructions.10
3 STATUS11
Up to now -November 2014- the Standard has not been enforced.12
4 ACKNOWLEDGMENT13
The authors are grateful for the help and the permanent encouragement of the Dr. John Morrall, P.Eng14
5 REFERENCES15
The full text of the update and all references can be downloaded from:16
http://ingenieriadeseguridadvial.blogspot.com/2012/11/normas-y-recomendaciones-de-diseno_6.html17
5.1 General Reference Literature18
Spanish or translated to Spanish documents included. Total 4019
5.2 Particular Reference Literature20
For chapter, Spanish or translated to Spanish documents included. Total: 22421
22
Sierra F.J. – Fissore A.D. 24
LIST OF FIGURES1
Figure 1. Chronology of Sources: 1954-1980............................................................................................... 72
Figure 2. Chronology of Sources: 1980-2010............................................................................................... 83
Figure 3. Distribution superelevation and side friction............................................................................... 144
5

More Related Content

Similar to 165. argentina country report

FEMA Guidelines for Dam Safety
FEMA Guidelines for Dam SafetyFEMA Guidelines for Dam Safety
FEMA Guidelines for Dam SafetyJA Larson
 
Flood Disaster Risk Mapping to Assess Impacts on Transportation Infrastructur...
Flood Disaster Risk Mapping to Assess Impacts on Transportation Infrastructur...Flood Disaster Risk Mapping to Assess Impacts on Transportation Infrastructur...
Flood Disaster Risk Mapping to Assess Impacts on Transportation Infrastructur...Waheed Uddin
 
Transportation Engineering I
Transportation Engineering ITransportation Engineering I
Transportation Engineering IShradhesh Marve
 
INTRODUCTION_TO_TRANSPORTATION_ENGINEERI.pdf
INTRODUCTION_TO_TRANSPORTATION_ENGINEERI.pdfINTRODUCTION_TO_TRANSPORTATION_ENGINEERI.pdf
INTRODUCTION_TO_TRANSPORTATION_ENGINEERI.pdfPradipBarua6
 
Design of Highway with Major Bridge on Stagnant Water
Design of Highway with Major Bridge on Stagnant WaterDesign of Highway with Major Bridge on Stagnant Water
Design of Highway with Major Bridge on Stagnant WaterIRJET Journal
 
CCXG Global Forum March 2018, Transparency of reporting in technology support...
CCXG Global Forum March 2018, Transparency of reporting in technology support...CCXG Global Forum March 2018, Transparency of reporting in technology support...
CCXG Global Forum March 2018, Transparency of reporting in technology support...OECD Environment
 
Spot speed studies and speed delay time survey
Spot speed studies and speed delay time surveySpot speed studies and speed delay time survey
Spot speed studies and speed delay time surveySai Santosh Yakkali
 
CCXG Global Forum March 2018, Transparency of reporting in technology support...
CCXG Global Forum March 2018, Transparency of reporting in technology support...CCXG Global Forum March 2018, Transparency of reporting in technology support...
CCXG Global Forum March 2018, Transparency of reporting in technology support...OECD Environment
 
Traffic volumestudy
Traffic volumestudyTraffic volumestudy
Traffic volumestudyAMOD GUPTA
 
Presentation on Roadway Condition Survey
Presentation on Roadway Condition Survey Presentation on Roadway Condition Survey
Presentation on Roadway Condition Survey Khaza Ahmed Palash
 
Science Centre Station and West At-Grade Surface Stops Open House - November ...
Science Centre Station and West At-Grade Surface Stops Open House - November ...Science Centre Station and West At-Grade Surface Stops Open House - November ...
Science Centre Station and West At-Grade Surface Stops Open House - November ...Crosstown TO
 
Corrine Drive Phase 2 Report
Corrine Drive Phase 2 ReportCorrine Drive Phase 2 Report
Corrine Drive Phase 2 ReportBrendan O'Connor
 

Similar to 165. argentina country report (20)

FEMA Guidelines for Dam Safety
FEMA Guidelines for Dam SafetyFEMA Guidelines for Dam Safety
FEMA Guidelines for Dam Safety
 
12 1439
12 143912 1439
12 1439
 
EDC3_Action_Plan_2016-01-01 rev 1
EDC3_Action_Plan_2016-01-01 rev 1EDC3_Action_Plan_2016-01-01 rev 1
EDC3_Action_Plan_2016-01-01 rev 1
 
Flood Disaster Risk Mapping to Assess Impacts on Transportation Infrastructur...
Flood Disaster Risk Mapping to Assess Impacts on Transportation Infrastructur...Flood Disaster Risk Mapping to Assess Impacts on Transportation Infrastructur...
Flood Disaster Risk Mapping to Assess Impacts on Transportation Infrastructur...
 
Transportation Engineering I
Transportation Engineering ITransportation Engineering I
Transportation Engineering I
 
INTRODUCTION_TO_TRANSPORTATION_ENGINEERI.pdf
INTRODUCTION_TO_TRANSPORTATION_ENGINEERI.pdfINTRODUCTION_TO_TRANSPORTATION_ENGINEERI.pdf
INTRODUCTION_TO_TRANSPORTATION_ENGINEERI.pdf
 
Design of Highway with Major Bridge on Stagnant Water
Design of Highway with Major Bridge on Stagnant WaterDesign of Highway with Major Bridge on Stagnant Water
Design of Highway with Major Bridge on Stagnant Water
 
CCXG Global Forum March 2018, Transparency of reporting in technology support...
CCXG Global Forum March 2018, Transparency of reporting in technology support...CCXG Global Forum March 2018, Transparency of reporting in technology support...
CCXG Global Forum March 2018, Transparency of reporting in technology support...
 
Spot speed studies and speed delay time survey
Spot speed studies and speed delay time surveySpot speed studies and speed delay time survey
Spot speed studies and speed delay time survey
 
CCXG Global Forum March 2018, Transparency of reporting in technology support...
CCXG Global Forum March 2018, Transparency of reporting in technology support...CCXG Global Forum March 2018, Transparency of reporting in technology support...
CCXG Global Forum March 2018, Transparency of reporting in technology support...
 
nchrp_syn_159.pdf
nchrp_syn_159.pdfnchrp_syn_159.pdf
nchrp_syn_159.pdf
 
Traffic volumestudy
Traffic volumestudyTraffic volumestudy
Traffic volumestudy
 
Overseas road note 31
Overseas road note 31Overseas road note 31
Overseas road note 31
 
Presentation on Roadway Condition Survey
Presentation on Roadway Condition Survey Presentation on Roadway Condition Survey
Presentation on Roadway Condition Survey
 
SMT Conference 27 March
SMT Conference 27 MarchSMT Conference 27 March
SMT Conference 27 March
 
Science Centre Station and West At-Grade Surface Stops Open House - November ...
Science Centre Station and West At-Grade Surface Stops Open House - November ...Science Centre Station and West At-Grade Surface Stops Open House - November ...
Science Centre Station and West At-Grade Surface Stops Open House - November ...
 
Corrine Drive Phase 2 Report
Corrine Drive Phase 2 ReportCorrine Drive Phase 2 Report
Corrine Drive Phase 2 Report
 
Roadroid davis
Roadroid davisRoadroid davis
Roadroid davis
 
Final Project
Final ProjectFinal Project
Final Project
 
Steve Healow
Steve HealowSteve Healow
Steve Healow
 

More from Sierra Francisco Justo

10. PrediccionComportamientoCR2C Resumen.pdf
10. PrediccionComportamientoCR2C Resumen.pdf10. PrediccionComportamientoCR2C Resumen.pdf
10. PrediccionComportamientoCR2C Resumen.pdfSierra Francisco Justo
 
10. PrediccionComportamientoCR2C Resumen.pdf
10. PrediccionComportamientoCR2C Resumen.pdf10. PrediccionComportamientoCR2C Resumen.pdf
10. PrediccionComportamientoCR2C Resumen.pdfSierra Francisco Justo
 
14 AdministracionSV SegunConocimiento EH&otros.pdf
14 AdministracionSV SegunConocimiento EH&otros.pdf14 AdministracionSV SegunConocimiento EH&otros.pdf
14 AdministracionSV SegunConocimiento EH&otros.pdfSierra Francisco Justo
 
10. PrediccionComportamientoCR2C Resumen.pdf
10. PrediccionComportamientoCR2C Resumen.pdf10. PrediccionComportamientoCR2C Resumen.pdf
10. PrediccionComportamientoCR2C Resumen.pdfSierra Francisco Justo
 
9 Ancho Carril y Seguridad Borrador.pdf
9 Ancho Carril y Seguridad Borrador.pdf9 Ancho Carril y Seguridad Borrador.pdf
9 Ancho Carril y Seguridad Borrador.pdfSierra Francisco Justo
 
12. SeguridadNormasDisenoGeometrico 21p.pdf
12. SeguridadNormasDisenoGeometrico 21p.pdf12. SeguridadNormasDisenoGeometrico 21p.pdf
12. SeguridadNormasDisenoGeometrico 21p.pdfSierra Francisco Justo
 
8 Causa&EfectoSeccionTransversal&SeguridadVial DRAFT.pdf
8 Causa&EfectoSeccionTransversal&SeguridadVial DRAFT.pdf8 Causa&EfectoSeccionTransversal&SeguridadVial DRAFT.pdf
8 Causa&EfectoSeccionTransversal&SeguridadVial DRAFT.pdfSierra Francisco Justo
 
13. CAMJ 2012 Defensa Conductores Ancianos.pdf
13. CAMJ 2012 Defensa Conductores Ancianos.pdf13. CAMJ 2012 Defensa Conductores Ancianos.pdf
13. CAMJ 2012 Defensa Conductores Ancianos.pdfSierra Francisco Justo
 
6. IngenieriaSeguridad&SeguridadIngenieria.pdf
6. IngenieriaSeguridad&SeguridadIngenieria.pdf6. IngenieriaSeguridad&SeguridadIngenieria.pdf
6. IngenieriaSeguridad&SeguridadIngenieria.pdfSierra Francisco Justo
 
3. Revision Seguridad Autopista 407 Toronto.pdf
3. Revision Seguridad Autopista 407 Toronto.pdf3. Revision Seguridad Autopista 407 Toronto.pdf
3. Revision Seguridad Autopista 407 Toronto.pdfSierra Francisco Justo
 
1516Resumenes Ingenieria Seguridad Vial x16 3p.pdf
1516Resumenes Ingenieria Seguridad Vial x16 3p.pdf1516Resumenes Ingenieria Seguridad Vial x16 3p.pdf
1516Resumenes Ingenieria Seguridad Vial x16 3p.pdfSierra Francisco Justo
 
1516Resumenes Ingenieria Seguridad Vial x16 3p.pdf
1516Resumenes Ingenieria Seguridad Vial x16 3p.pdf1516Resumenes Ingenieria Seguridad Vial x16 3p.pdf
1516Resumenes Ingenieria Seguridad Vial x16 3p.pdfSierra Francisco Justo
 
1516Resumenes Ingenieria Seguridad Vial x16 3p.pdf
1516Resumenes Ingenieria Seguridad Vial x16 3p.pdf1516Resumenes Ingenieria Seguridad Vial x16 3p.pdf
1516Resumenes Ingenieria Seguridad Vial x16 3p.pdfSierra Francisco Justo
 
11121314Resumenes Ingenieria Seguridad Vial x16 4p.pdf
11121314Resumenes Ingenieria Seguridad Vial x16 4p.pdf11121314Resumenes Ingenieria Seguridad Vial x16 4p.pdf
11121314Resumenes Ingenieria Seguridad Vial x16 4p.pdfSierra Francisco Justo
 
78Resumenes Ingenieria Seguridad Vial x16 3p.pdf
78Resumenes Ingenieria Seguridad Vial x16 3p.pdf78Resumenes Ingenieria Seguridad Vial x16 3p.pdf
78Resumenes Ingenieria Seguridad Vial x16 3p.pdfSierra Francisco Justo
 

More from Sierra Francisco Justo (20)

15 Causa y prevencion de choques.pdf
15 Causa y prevencion de choques.pdf15 Causa y prevencion de choques.pdf
15 Causa y prevencion de choques.pdf
 
10. PrediccionComportamientoCR2C Resumen.pdf
10. PrediccionComportamientoCR2C Resumen.pdf10. PrediccionComportamientoCR2C Resumen.pdf
10. PrediccionComportamientoCR2C Resumen.pdf
 
10. PrediccionComportamientoCR2C Resumen.pdf
10. PrediccionComportamientoCR2C Resumen.pdf10. PrediccionComportamientoCR2C Resumen.pdf
10. PrediccionComportamientoCR2C Resumen.pdf
 
9. Ancho Carril y Seguridad.pdf
9. Ancho Carril y Seguridad.pdf9. Ancho Carril y Seguridad.pdf
9. Ancho Carril y Seguridad.pdf
 
14 AdministracionSV SegunConocimiento EH&otros.pdf
14 AdministracionSV SegunConocimiento EH&otros.pdf14 AdministracionSV SegunConocimiento EH&otros.pdf
14 AdministracionSV SegunConocimiento EH&otros.pdf
 
10. PrediccionComportamientoCR2C Resumen.pdf
10. PrediccionComportamientoCR2C Resumen.pdf10. PrediccionComportamientoCR2C Resumen.pdf
10. PrediccionComportamientoCR2C Resumen.pdf
 
9 Ancho Carril y Seguridad Borrador.pdf
9 Ancho Carril y Seguridad Borrador.pdf9 Ancho Carril y Seguridad Borrador.pdf
9 Ancho Carril y Seguridad Borrador.pdf
 
12. SeguridadNormasDisenoGeometrico 21p.pdf
12. SeguridadNormasDisenoGeometrico 21p.pdf12. SeguridadNormasDisenoGeometrico 21p.pdf
12. SeguridadNormasDisenoGeometrico 21p.pdf
 
8 Causa&EfectoSeccionTransversal&SeguridadVial DRAFT.pdf
8 Causa&EfectoSeccionTransversal&SeguridadVial DRAFT.pdf8 Causa&EfectoSeccionTransversal&SeguridadVial DRAFT.pdf
8 Causa&EfectoSeccionTransversal&SeguridadVial DRAFT.pdf
 
13. CAMJ 2012 Defensa Conductores Ancianos.pdf
13. CAMJ 2012 Defensa Conductores Ancianos.pdf13. CAMJ 2012 Defensa Conductores Ancianos.pdf
13. CAMJ 2012 Defensa Conductores Ancianos.pdf
 
7. Seguridad&Evidencia.pdf
7. Seguridad&Evidencia.pdf7. Seguridad&Evidencia.pdf
7. Seguridad&Evidencia.pdf
 
6. IngenieriaSeguridad&SeguridadIngenieria.pdf
6. IngenieriaSeguridad&SeguridadIngenieria.pdf6. IngenieriaSeguridad&SeguridadIngenieria.pdf
6. IngenieriaSeguridad&SeguridadIngenieria.pdf
 
5 . Camino Por Recorrer.pdf
5 . Camino Por Recorrer.pdf5 . Camino Por Recorrer.pdf
5 . Camino Por Recorrer.pdf
 
4. HAUER Hwy 407 PEO Canada'97.pdf
4. HAUER Hwy 407 PEO Canada'97.pdf4. HAUER Hwy 407 PEO Canada'97.pdf
4. HAUER Hwy 407 PEO Canada'97.pdf
 
3. Revision Seguridad Autopista 407 Toronto.pdf
3. Revision Seguridad Autopista 407 Toronto.pdf3. Revision Seguridad Autopista 407 Toronto.pdf
3. Revision Seguridad Autopista 407 Toronto.pdf
 
1516Resumenes Ingenieria Seguridad Vial x16 3p.pdf
1516Resumenes Ingenieria Seguridad Vial x16 3p.pdf1516Resumenes Ingenieria Seguridad Vial x16 3p.pdf
1516Resumenes Ingenieria Seguridad Vial x16 3p.pdf
 
1516Resumenes Ingenieria Seguridad Vial x16 3p.pdf
1516Resumenes Ingenieria Seguridad Vial x16 3p.pdf1516Resumenes Ingenieria Seguridad Vial x16 3p.pdf
1516Resumenes Ingenieria Seguridad Vial x16 3p.pdf
 
1516Resumenes Ingenieria Seguridad Vial x16 3p.pdf
1516Resumenes Ingenieria Seguridad Vial x16 3p.pdf1516Resumenes Ingenieria Seguridad Vial x16 3p.pdf
1516Resumenes Ingenieria Seguridad Vial x16 3p.pdf
 
11121314Resumenes Ingenieria Seguridad Vial x16 4p.pdf
11121314Resumenes Ingenieria Seguridad Vial x16 4p.pdf11121314Resumenes Ingenieria Seguridad Vial x16 4p.pdf
11121314Resumenes Ingenieria Seguridad Vial x16 4p.pdf
 
78Resumenes Ingenieria Seguridad Vial x16 3p.pdf
78Resumenes Ingenieria Seguridad Vial x16 3p.pdf78Resumenes Ingenieria Seguridad Vial x16 3p.pdf
78Resumenes Ingenieria Seguridad Vial x16 3p.pdf
 

Recently uploaded

Raashid final report on Embedded Systems
Raashid final report on Embedded SystemsRaashid final report on Embedded Systems
Raashid final report on Embedded SystemsRaashidFaiyazSheikh
 
Passive Air Cooling System and Solar Water Heater.ppt
Passive Air Cooling System and Solar Water Heater.pptPassive Air Cooling System and Solar Water Heater.ppt
Passive Air Cooling System and Solar Water Heater.pptamrabdallah9
 
Involute of a circle,Square, pentagon,HexagonInvolute_Engineering Drawing.pdf
Involute of a circle,Square, pentagon,HexagonInvolute_Engineering Drawing.pdfInvolute of a circle,Square, pentagon,HexagonInvolute_Engineering Drawing.pdf
Involute of a circle,Square, pentagon,HexagonInvolute_Engineering Drawing.pdfJNTUA
 
8th International Conference on Soft Computing, Mathematics and Control (SMC ...
8th International Conference on Soft Computing, Mathematics and Control (SMC ...8th International Conference on Soft Computing, Mathematics and Control (SMC ...
8th International Conference on Soft Computing, Mathematics and Control (SMC ...josephjonse
 
21scheme vtu syllabus of visveraya technological university
21scheme vtu syllabus of visveraya technological university21scheme vtu syllabus of visveraya technological university
21scheme vtu syllabus of visveraya technological universityMohd Saifudeen
 
Interfacing Analog to Digital Data Converters ee3404.pdf
Interfacing Analog to Digital Data Converters ee3404.pdfInterfacing Analog to Digital Data Converters ee3404.pdf
Interfacing Analog to Digital Data Converters ee3404.pdfragupathi90
 
Basics of Relay for Engineering Students
Basics of Relay for Engineering StudentsBasics of Relay for Engineering Students
Basics of Relay for Engineering Studentskannan348865
 
handbook on reinforce concrete and detailing
handbook on reinforce concrete and detailinghandbook on reinforce concrete and detailing
handbook on reinforce concrete and detailingAshishSingh1301
 
Theory of Time 2024 (Universal Theory for Everything)
Theory of Time 2024 (Universal Theory for Everything)Theory of Time 2024 (Universal Theory for Everything)
Theory of Time 2024 (Universal Theory for Everything)Ramkumar k
 
Augmented Reality (AR) with Augin Software.pptx
Augmented Reality (AR) with Augin Software.pptxAugmented Reality (AR) with Augin Software.pptx
Augmented Reality (AR) with Augin Software.pptxMustafa Ahmed
 
Adsorption (mass transfer operations 2) ppt
Adsorption (mass transfer operations 2) pptAdsorption (mass transfer operations 2) ppt
Adsorption (mass transfer operations 2) pptjigup7320
 
Research Methodolgy & Intellectual Property Rights Series 1
Research Methodolgy & Intellectual Property Rights Series 1Research Methodolgy & Intellectual Property Rights Series 1
Research Methodolgy & Intellectual Property Rights Series 1T.D. Shashikala
 
Working Principle of Echo Sounder and Doppler Effect.pdf
Working Principle of Echo Sounder and Doppler Effect.pdfWorking Principle of Echo Sounder and Doppler Effect.pdf
Working Principle of Echo Sounder and Doppler Effect.pdfSkNahidulIslamShrabo
 
15-Minute City: A Completely New Horizon
15-Minute City: A Completely New Horizon15-Minute City: A Completely New Horizon
15-Minute City: A Completely New HorizonMorshed Ahmed Rahath
 
The Entity-Relationship Model(ER Diagram).pptx
The Entity-Relationship Model(ER Diagram).pptxThe Entity-Relationship Model(ER Diagram).pptx
The Entity-Relationship Model(ER Diagram).pptxMANASINANDKISHORDEOR
 
Autodesk Construction Cloud (Autodesk Build).pptx
Autodesk Construction Cloud (Autodesk Build).pptxAutodesk Construction Cloud (Autodesk Build).pptx
Autodesk Construction Cloud (Autodesk Build).pptxMustafa Ahmed
 
UNIT 4 PTRP final Convergence in probability.pptx
UNIT 4 PTRP final Convergence in probability.pptxUNIT 4 PTRP final Convergence in probability.pptx
UNIT 4 PTRP final Convergence in probability.pptxkalpana413121
 
What is Coordinate Measuring Machine? CMM Types, Features, Functions
What is Coordinate Measuring Machine? CMM Types, Features, FunctionsWhat is Coordinate Measuring Machine? CMM Types, Features, Functions
What is Coordinate Measuring Machine? CMM Types, Features, FunctionsVIEW
 
NEWLETTER FRANCE HELICES/ SDS SURFACE DRIVES - MAY 2024
NEWLETTER FRANCE HELICES/ SDS SURFACE DRIVES - MAY 2024NEWLETTER FRANCE HELICES/ SDS SURFACE DRIVES - MAY 2024
NEWLETTER FRANCE HELICES/ SDS SURFACE DRIVES - MAY 2024EMMANUELLEFRANCEHELI
 
Filters for Electromagnetic Compatibility Applications
Filters for Electromagnetic Compatibility ApplicationsFilters for Electromagnetic Compatibility Applications
Filters for Electromagnetic Compatibility ApplicationsMathias Magdowski
 

Recently uploaded (20)

Raashid final report on Embedded Systems
Raashid final report on Embedded SystemsRaashid final report on Embedded Systems
Raashid final report on Embedded Systems
 
Passive Air Cooling System and Solar Water Heater.ppt
Passive Air Cooling System and Solar Water Heater.pptPassive Air Cooling System and Solar Water Heater.ppt
Passive Air Cooling System and Solar Water Heater.ppt
 
Involute of a circle,Square, pentagon,HexagonInvolute_Engineering Drawing.pdf
Involute of a circle,Square, pentagon,HexagonInvolute_Engineering Drawing.pdfInvolute of a circle,Square, pentagon,HexagonInvolute_Engineering Drawing.pdf
Involute of a circle,Square, pentagon,HexagonInvolute_Engineering Drawing.pdf
 
8th International Conference on Soft Computing, Mathematics and Control (SMC ...
8th International Conference on Soft Computing, Mathematics and Control (SMC ...8th International Conference on Soft Computing, Mathematics and Control (SMC ...
8th International Conference on Soft Computing, Mathematics and Control (SMC ...
 
21scheme vtu syllabus of visveraya technological university
21scheme vtu syllabus of visveraya technological university21scheme vtu syllabus of visveraya technological university
21scheme vtu syllabus of visveraya technological university
 
Interfacing Analog to Digital Data Converters ee3404.pdf
Interfacing Analog to Digital Data Converters ee3404.pdfInterfacing Analog to Digital Data Converters ee3404.pdf
Interfacing Analog to Digital Data Converters ee3404.pdf
 
Basics of Relay for Engineering Students
Basics of Relay for Engineering StudentsBasics of Relay for Engineering Students
Basics of Relay for Engineering Students
 
handbook on reinforce concrete and detailing
handbook on reinforce concrete and detailinghandbook on reinforce concrete and detailing
handbook on reinforce concrete and detailing
 
Theory of Time 2024 (Universal Theory for Everything)
Theory of Time 2024 (Universal Theory for Everything)Theory of Time 2024 (Universal Theory for Everything)
Theory of Time 2024 (Universal Theory for Everything)
 
Augmented Reality (AR) with Augin Software.pptx
Augmented Reality (AR) with Augin Software.pptxAugmented Reality (AR) with Augin Software.pptx
Augmented Reality (AR) with Augin Software.pptx
 
Adsorption (mass transfer operations 2) ppt
Adsorption (mass transfer operations 2) pptAdsorption (mass transfer operations 2) ppt
Adsorption (mass transfer operations 2) ppt
 
Research Methodolgy & Intellectual Property Rights Series 1
Research Methodolgy & Intellectual Property Rights Series 1Research Methodolgy & Intellectual Property Rights Series 1
Research Methodolgy & Intellectual Property Rights Series 1
 
Working Principle of Echo Sounder and Doppler Effect.pdf
Working Principle of Echo Sounder and Doppler Effect.pdfWorking Principle of Echo Sounder and Doppler Effect.pdf
Working Principle of Echo Sounder and Doppler Effect.pdf
 
15-Minute City: A Completely New Horizon
15-Minute City: A Completely New Horizon15-Minute City: A Completely New Horizon
15-Minute City: A Completely New Horizon
 
The Entity-Relationship Model(ER Diagram).pptx
The Entity-Relationship Model(ER Diagram).pptxThe Entity-Relationship Model(ER Diagram).pptx
The Entity-Relationship Model(ER Diagram).pptx
 
Autodesk Construction Cloud (Autodesk Build).pptx
Autodesk Construction Cloud (Autodesk Build).pptxAutodesk Construction Cloud (Autodesk Build).pptx
Autodesk Construction Cloud (Autodesk Build).pptx
 
UNIT 4 PTRP final Convergence in probability.pptx
UNIT 4 PTRP final Convergence in probability.pptxUNIT 4 PTRP final Convergence in probability.pptx
UNIT 4 PTRP final Convergence in probability.pptx
 
What is Coordinate Measuring Machine? CMM Types, Features, Functions
What is Coordinate Measuring Machine? CMM Types, Features, FunctionsWhat is Coordinate Measuring Machine? CMM Types, Features, Functions
What is Coordinate Measuring Machine? CMM Types, Features, Functions
 
NEWLETTER FRANCE HELICES/ SDS SURFACE DRIVES - MAY 2024
NEWLETTER FRANCE HELICES/ SDS SURFACE DRIVES - MAY 2024NEWLETTER FRANCE HELICES/ SDS SURFACE DRIVES - MAY 2024
NEWLETTER FRANCE HELICES/ SDS SURFACE DRIVES - MAY 2024
 
Filters for Electromagnetic Compatibility Applications
Filters for Electromagnetic Compatibility ApplicationsFilters for Electromagnetic Compatibility Applications
Filters for Electromagnetic Compatibility Applications
 

165. argentina country report

  • 1. Sierra F.J. – Fissore A.D. 1 HIGHWAY GEOMETRIC DESIGN MANUAL ARGENTINA1 General Topics: Highway Design Manual - Technical/Research topic2 3 4 5 Francisco Justo Sierra6 Av. Centenario 1825 9A (1643) Beccar, San Isidro, Buenos Aires – Argentina7 Tel.: +54 11 47471829; Email: franjusierra@yahoo.com8 9 Alejandra Débora Fissore10 Florida 141 - 1A (4400) Salta Capital, Salta – Argentina11 Tel.: +54 9 387 4571892; Email: alejandra.fissore@gmail.com12 13 14 Word count:15 In abstract: 25016 In text: 635817 Figures: 3 x 250 words (each) = 75018 Total Word: 710819 20 21 22 Submission Date: 2015-04-2823 24 25
  • 2. Sierra F.J. – Fissore A.D. 2 Abstract1 What and When:2  In 2009, The Argentina National Highway Administration (DNV) hired to Civil Engineering3 Mountain School of National University of San Juan (EICAM) to develop the 2010 Update of Geometric4 Design Standards for DNV 1967/80.5  Term 12 months6 Update’s background:7  New knowledge on how highway’s visible elements affect traffic safety and operation8  Driver´s behaviors, technological breakthroughs, flexibility in highway design9 Title:10  STANDARDS AND RECOMMENDATIONS ON GEOMETRIC DESIGN AND ROAD11 SAFETY12 Why:13 Milestones in Geometric Design between 1967 and 2009 not covered in the current DNV:14  Clear zone15  Friction Coefficient (AASHTO 1971 Addendum)16  Design Consistency17  Modern Roundabouts18  Test Levels and reasons for energy attenuation devices19 Who:20  General Director, Technician, Writers and Consultants: 11 Engineers and 1 Architect.21  Monitoring, Review and Consultants 11 Engineers and 1 Surveyor22  Assistance from respected local and foreign engineers: John Morral (Canada); Speier,23 Echaveguren (Chile); Rocci and Xumini, (Spain).24 How:25  Bibliographical Revision: Argentina, USA, Canada, Spain, South Africa, Australia26  Non-Binding Survey on Road Standards Users: Consultants, Project Managers, Road27 Geometric Design University Teachers, Builder and Inspectors, Road Corporations28  Presentation of findings In The XV Argentinean Road And Traffic Congress, September 200929  Non-Binding Request upon the document´s draft30  Submission of Final Report Approved by DNV Studies and Projects Division:31 - 10 Chapters, Atlas, General Bibliography, Specific Bibliography per chapter)32 - Found on ingenieriadeseguridadvial.blogspot.com33  Exposure Course for DNV’s Professionals, 23 to 26th, August 2011, with invitation to present34 well-grounded and written proposals to change or disregard Update's topics (none have been received).35 The Standard has not been enforced.36 37
  • 3. Sierra F.J. – Fissore A.D. 3 1 INTRODUCTION1 The Argentine Republic is a federal republic located in southeastern South America. It is bordered by2 Bolivia and Paraguay to the north; the Drake Passage to the south; Brazil, Uruguay and the South Atlantic3 Ocean to the east; and Chile to the west.4 Some characteristic data of Argentina:5 Geographic Data6 7 Area (km2) 2,780,400 (0.3 of Canada)8 Population 2014 42,670,000 (1.2 of Canada)9 Density (inh/km2) 15.3 (4.3 of Canada)10 11 Road Network Extension/Composition12 13 Primary - National Jdx. Secondary - Provincial Jdx. Total14 km % km % km %15 Paved Road 35,500 90 43,350 23 78,850 3516 Improved Road 3,000 8 36,850 20 39,850 1717 Dirt Road 1,100 3 108,700 58 109,800 4818 Total 39,600 100 188,900 100 228,500 10019 20 21 Total Paved National Network 35,500 10022 Total Divided Highway in National Network 3,500 1023 24 Total National and Provincial Network 228,500 3625 Tertiary Network - Communal Jdx. 400,000 6426 Total Argentine Highway System 628,500 10027 28 Vehicle Fleet (N°)29 30 Cars Light Com Trucks Buses Total31 10,060,000 2,460,000 690,000 90,000 13,300,00032 76% 18% 5% 1% 100%33 34 Yearly Fatalities (N°/year)35 36 Maximum Minimum Average37 10,000 5,000 7,50038 39 Daily average Fatalities (N°/day)40 41 Maximum Minimum Average42 27 14 2143 44 45
  • 4. Sierra F.J. – Fissore A.D. 4 1.1 Summary1 The update DNV 2010, (AVN10) of de DNV – 1967/80 standards (NDGDNV’67/80) is based on how new2 knowledge affects safety and traffic operation taking into account visible elements of the road.3 The update bears in mind driver behaviour, technological advances and design flexibility (sensitivity to the4 natural and artificial environment)5 1.2 Objectives6  Synthesize, organize and standardize the general judgment for surveys, location and design of7 arterial rural roadways, and occasional urban roads, under The Argentina National Highway Administration8 (Dirección Nacional de Vialidad Argentina, DNV) jurisdiction.9  Encourage the design and construction of safe and effective roads for the welfare of the10 community and society in general11  Ensure that all road projects will be built according to a set of standards that include12 consideration of local circumstances13  Gather actual in force DNV technical documents related to the geometric design and road safety14  Define the processes and standards that provide adequate levels of roads efficiency (mobility,15 safety, economy, comfort) according to national plans and investment strategies16  To place emphasis on resulting document’s self-sufficiency17 1.3 Scope18 These standards address a broad spectrum of road types in the national network, from multilane highways19 carrying tens of thousands of vehicles per hour, to single two-lane two-way roads, with ADT<500.20 It is recommended:21  To give more flexibility to the design, emphasizing on the horizontal and vertical alignment22 coordination and consistency23  To improve safety and conditions of passing manoeuvre particularly on curves, which24 unfortunately have been diminished by the 24449 Act provision, although it would have been best to allow25 overtaking in curves to the left with appropriate visibility.26 As all road projects are different and cannot cover all specific conditions, the standards, recommendations27 and guidelines are general in nature; and are based on assumed future conditions of vehicles and drivers28 and transportation demands, which vary with time, and so it is normal to review and update them29 periodically.30 The AVN10 does not mean that the roads previously designed are unsafe.31 The purpose of the update is to provide more satisfactory designs of new roads and major reconstructions32 of existing roads.33 To assess the quality of existing roads, rules and updated new recommendations should not be used as a34 simple checklist, regardless of the limitations and predominant circumstances at the time of conception and35 application.36 These standards and recommendations do not replace the knowledge, experience or good engineering37 judgment.38 It includes techniques, graphs and tables to help solve problems of visible features design along the way.39 Rather than based on our own research, this update emerges from reading and reviewing road leading design40 agencies’ publications and an eclectic selection of the most important findings in the specialty over the past41 50 years.42
  • 5. Sierra F.J. – Fissore A.D. 5 Experiences and findings of Ken Stonex in the General Motors Proving Ground were taken into account,1 along with the Green and Yellow Books, the Roadside Design Guide, the Highway Safety Manual (draft)2 AASHTO, as well as technical rules and reports from Canada, Europe, Australia, South Africa, New3 Zealand ...4 1.4 Premises5 Platform design. Adjust the coefficients of the mathematical models used, placing emphasis on the6 coordination and consistent design.7 Roadside design. Incorporate the concepts of clear-zone, and justification of containment devices.8 At-grade intersections and interchanges. Include Modern Roundabouts and Single-Point Diamond9 interchange type.10 Urban highway crossings. Avoid them, or exceptionally design them with suitable traffic-calming devices11 Economic profitability. Consider the economic benefits that result from a reduction of crashes, resulting12 in lower costs of fatalities, injuries and property damage.13 Conceptual approach. Ezra Hauer, 199914  Roads designed according to the standards are neither safe nor unsafe or properly safe; only15 have an unknown safety level. There are only more or less safe roads16  Banish myth: Only drivers cause crashes, not roads17 1.5 Background18 1.5.1 Criteria and geometric design tools evolution19 Since automobile invention.20  Stopping Sight Distance [Chapter 3, C3]21  Road shoulders width and condition [C3]22 40/50’s.23  Design speed [C2]: maximum safe speed is a good guesswork, although is not always supported24 by reality, in which efficiency geometric design is measured by the Substantive Safety concept [C1]25 (reducing the number of deaths, number and severity of injuries, and material damage costs), and not by26 the Nominal Safety [C1], which considers that a road is safe if it complies with the standards.27  Safety = f (dynamic balance curves)28  Barnett tables (horizontal curves with spiral transitions) and Viguria (vertical curves)29 60’s.30  Clear-Zone Ken Stonex USA [C3] = f (human factor)31  Consistency Design [C3] Safety = f (ΔCm; expectations and driver comfort)32  Hans Lorenz’s criteria (German Autobahn). Curvature profile graph [C3]33 NDGDNV’67.34  Three Chapters; still in force35  Horizontal and vertical alignments coordination [C3]36  Guardrail application [C7] as safety panacea, replacing the old reinforced concrete parapets37 70’s.38  Addendum Stopping Sight Distance AASHTO Model [C3] human factor → wet road (night39 operation). Absolute minimum and desirable values.40
  • 6. Sierra F.J. – Fissore A.D. 6 80’s.1  Leisch Criteria [C3]; Safety = f (ΔVD successive curves ≤ 10 mph); VD or V: Design Speed2 NDGDNV’80.3  Five Chapters added to NDGDNV'67, still in force; intersections, interchanges, containment4 devices, lighting, culverts geometry ...5  Wide circulation of highway programs, managing large databases alignments, speeds, traffic6 crashes7  Newton → Poisson, Bayes (dynamic equilibrium statistics); obtained by mathematical8 regression models that relate the actual speed [C2] (index of driver behaviour) to average curvature (Cm)9 [C3] the horizontal alignment (best fit: linear function)10 90’s.11  Operating speed (VO) in free flow = best index of driver behaviour (desired speed)12  The horizontal curvature is geometric parameter which predominantly determines VO.13  Operating speed VO85 [C2]: VO under ideal conditions: free flow, only cars, wet road.14  Consistent Design [C3] VO85 ≈ VD15  If VO85 ≠ VD → Inconsistent design (by ranges) → crash concentration; black points16 VD ↓ Test17 Cm ↓ Alignment18 VO85→ ∆VO85 ↕ Behaviour19 ∆Crashes → ∆Cost ↕ Loop20  Safety Criteria [C3] (Lamm and others):21 Safety = f1 (VD - VO85); f2 (VO85i - VO85i+1); f3 (fR - fRA)22 fR: side friction assumed; fRA: side friction demanded23  Geometric design ranges: Good, Fair, Poor24  Modern roundabouts [C5]: global revaluation of safety benefits, capacity, cost, aesthetics.25  Traffic Calming [C8]26  Design flexibility [C1]. Context Sensitive Design, according to cultural, historical, social and27 environmental values28  Partial or full paved shoulders [C3]; for equal cost is much better than widening them.29  Access Management [C2]; greater safety, traffic flow, capacity of the arterial roads.30 90-11’s.31  Evaluation of road safety: qualitative → quantitative32  Development IHSDM, HSM [C3] programs33  Glennon, Leisch, Zeeger, Hauer, Krammes ... established the basic principles unanimously34 accepted and adopted about the new concept (philosophy, paradigm) of Geometric Design: Design taking35 into account the behaviour of the normal driver, not expecting people to behave as the designer wants ... as36 our visionary engineer Pascual Palazzo already foretold in 1937: “There is but one way to avoid crashes on37 the roads, and that is to make them unlikely. But not unlikely for an ideal species of prudent, thoughtful,38 intelligent drivers and pedestrians with rapid reactions, but for ordinary men as they are or become in the39 different circumstances of daily life.”40  The design philosophy, systems and techniques developed throughout this document are based41 on the Design Speed concept [C2] and the geometric related parameters.42  If reliable local data of operating speed 85th percentile of free flow traffic is available, design43 consistency programs (IHSDM, EICAM) can be used. They relate the operating speed profiles with44
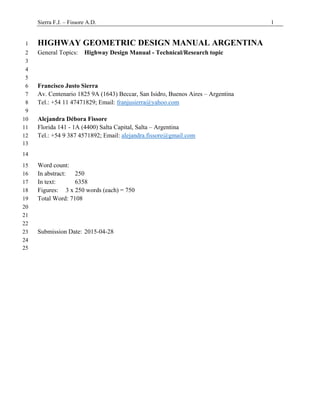
  • 7. Sierra F.J. – Fissore A.D. 7 probable crash occurrence. New coefficients which are being developed in international road activity relate1 safety with cost effectiveness, need to be applied.2 1.5.2 Chronology of Sources: 1954-19803 4 Figure 1. Chronology of Sources: 1954-19805 6 1.5.3 Chronology of Sources: 1980-20107 AASHO-BLUEBOOK1(RURAL) AASHO-REDBOOK1(URBAN) AASHO-BLUEBOOK2(RURAL) AASHO-YELLOWBOOK1+FHW AASHO-ADENDUMSIGHTDISTANCE AASHO-REDBOOK2(URBAN) AASHTO-YELLOWBOOK2+FHW AASHTOBARRIERGUIDE 54 57 65 67 68 71 73 74 77 80 STANDARDDNV67 STANDARDDNV80
  • 8. Sierra F.J. – Fissore A.D. 8 1 Figure 2. Chronology of Sources: 1980-20102 2 CONTENTS3 The update is organized in 4 Volumes and 1 Atlas:4  VOLUME 15 - CHAPTER 1 INTRODUCTION6 - CHAPTER 2 DESIGN CONTROLS7 - CHAPTER 3 GEOMETRIC DESIGN8  VOLUME 29 - CHAPTER 4 FREEWAYS10 - CHAPTER 5 INTERSECTIONS11 - CHAPTER 6 INTERCHANGES12  VOLUME 313 - CHAPTER 7 ROAD AND ROADSIDE SAFETY14 - CHAPTER 8 SPECIAL DESIGNS15  VOLUME 416 - CHAPTER 9 ROUTE LOCATION17 - CHAPTER 10 GENERAL INSTRUCTION18 AASHTO-GRRENBOOK1 AASHTO-ROADSIDEDESIGNGUIDE1 AASHTO-GRRENBOOK2 AASHTO-GRRENBOOK3 AASHTO-ROADSIDEDESIGNGUIDE2 FHWAROUNDABOUTGUIDE AASHTO-GRRENBOOK4 AASHTO-ROADSIDEDESIGNGUIDE3 PIARCROADSAFETYMANUAL AASHTO-GRRENBOOK4 80 84 89 90 94 96 97 98 99 0 1 2 3 4 5 6 7 10 STANDARDDNV80 HONDURAS AUSTRALIA COLOMBIA CANADA PERU-CENTRALAMERICA CHILE UNITEDKINGDOM SOUTHAFRICA BOLIVIA-DOCUMENTDNV ACTUALIZATIONDNV10
  • 9. Sierra F.J. – Fissore A.D. 9  ATLAS1 2.1 Chapter 1: INTRODUCTION2 2.1.1 New approaches in the design philosophy3 “Roads designed to standards are not safe, not unsafe, nor are they appropriately safe; roads designed to4 standards have an unpremeditated level of safety”. Dr. Ing. Ezra Hauer, 19995 Traditional design.6  Based on vehicle design capabilities and Newton’s laws of motion7  A design according to the design speed is safe8 New approaches.9  Design according to the standards are not necessarily safe10  Priority to road safety and issues related to driver behaviour, and environmental impact11 2.1.2 Route Location importance12 The achievement of a road design project is accomplished by successive approximations; it goes from13 generalities to the specific, from broad features to details.14 Chronologically, the exploration, survey and road location is the first phase to determine where the new15 road will go. After that, it is necessary to design the horizontal and vertical alignments, to carry on the final16 study, to design the drainage, and finally the Final Design. The choice of the route-location is direct17 responsibility of the project manager, or an experienced professional with strong technical and practical18 training, and updated in technological innovations.19 The project depends on and has to adjust to design criteria that were taken into account when the route-20 location was adopted.21 In terms of safety, economy and environmental effects, it is more costly to correct flaws in a finished project22 than to do complementary studies to reduce risks beforehand.23 2.1.3 Design Techniques24 Design-domain concept. There is a range of possibilities, between the upper and lower absolute limits,25 which could be adopted for a particular design parameter. The figure adopted in the design-domain could26 result in an acceptable, but variable, level of behaviour under average conditions, in terms of safety,27 operation, and economic and environmental consequences.28 2.1.4 Fundamental principles29 Compulsory standards. They are the essential to achieve the overall objectives of the design. They are30 indicated as “must”.31  Design speed: is a design parameter, not a visible feature. Its value may vary without violating32 the norm; i.e., when the environmental or topographical conditions change and the principles of ‘zoning’33 speeds are applied34  Stopping sight distance35  Minimum and maximum radii36  Transition spiral curve throughout all superelevated curve37  Minimum and maximum superelevation38  Vertical clearance of bridge39  Superelevation development on transition curve40  Minimum vertical curve K value41
  • 10. Sierra F.J. – Fissore A.D. 10  Maximum longitudinal grade1  Shoulder cross-slope on high side superelevated curve2  Lane width; widening lanes on horizontal curves3  Width, and full or partial paved shoulders4  Pavement Edge without Drop-Offs5  Width bridge and culverts6  Cross-slope road7  Test-level of safety devices8  Median width9  Gas Service properly located10  Paving outer shoulder on superelevated curves11  Cross-slope outer shoulder of superelevated curve, equal to adjacent lane12 Permissive standards or recommendations. All other provisions of an advisory nature, whether indicated13 by the use of “should” or “may” or “recommend” are permissive with no requirement for the intended14 application.15  Clear zone16  Fixed objects: remove, relocate, modify, protect, delineate17  Traversable slopes18  Design longitudinal barrier alignment19  Shoulder and edgeline rumble strips20  Decision sight distance at complex at-level intersection and interchanges approaches21  Maximum length (≈ 20 m) cross-slope road < 2% on flat area22  Right-Of-Way (ROW) width (including interchanges)23  Coordination horizontal and vertical alignments24  To include modern roundabouts between design options25  Auxiliary lane for slow trucks passing26  Centerline rumble strips27  Driveway and access density management28  Discourage urban crossing road29  Passing sight distance frequency30 2.1.5 Design exceptions31 They are defined as those cases where levels lower than the minimum are used. They may be approved in32 the planning or design phases. The approval of all exceptions must be documented and presented using the33 administrative steps instructed in [C10]. They must have the approval of the Manager of Studies and34 Projects DVS [C10].35 2.1.6 Nominal Safety and Substantive Safety36 Nominal safety. Evaluation of compliance with the rules, justifications, guidelines and design procedures37 approved.38 Substantive safety. Evaluation of the frequency and severity of actual or anticipated crashes for a road or39 road segment or intersection.40 2.1.7 Glossary41 To establish common ground and to facilitate the uniform understanding of the main processes of geometric42 design and road safety, Glossary [S1.9] summarizes the terminology adopted, with some terms used in the43 construction. The definitions and terms given by the 24.449 Act. are particularly important.44
  • 11. Sierra F.J. – Fissore A.D. 11 It is crucial to avoid any misunderstanding between planners, designers and builders in the specific1 activities.2 2.2 Chapter 2: DESIGN CONTROLS3 The design of the visible features of a road is influenced by:4  Topography5  Speed6  Traffic volume and composition7  Vehicle design8  Environmental factors9  Functional classification10  Access Management11 A good design will take into account simultaneously all the basic controls, according to its importance.12 2.2.1 Human Factors13 Components of the road transport system. The user, vehicle and road. Each one contributes to the quality14 of traffic, which results from complex combinations and interactions of these components.15 Humans are fallible, they make mistakes, many of which are induced by defects in the visible features of16 the roadway.17 Road design standards should be based on behaviour, needs, human capabilities and limitations.18 Crashes prevention. Generally, a car crash is the end result of a multiple-step process. According to the19 actions taken in any of these steps, a crash can or cannot be avoided.20 Driver expectations. When a design is incompatible with the drivers or other road users’ capabilities, the21 chances of making mistakes and producing crashes grow.22 If road perception is clear and consistent, the task of adaptation is easier and the response of drivers will be23 more appropriate, predictable and uniform24 Driver expectations are related to the design consistency:25  The road must confirm what drivers expect, based on previous experience.26  Drivers must deal with clear clues about what is expected from them27 Conclusion. The development of any technical system should acknowledge the possibility of error, and28 the road transport system is not the exception to this reality.29 Past. Drivers ‘accused’ of making a mistake, taking inappropriate behaviour or having limited driving30 skills.31 Present. It is recognized that effective solutions to the problem require much more than simply32 identification of the ‘guilty’ part.33 Future. A bigger number of elements is expected to be consider to minimize human errors and their effects,34 which should lead to an improvement of the safety level of the road networks.35 2.2.2 Speed36 There is an interactive relationship between road and speed. The actual speed which will be used on the37 road depends largely on the characteristics of the selected design; however estimating these speed ‘a priori’38 is a difficult task for the design team, given the lack of measurements of actual speeds in Argentina.39 Speed design - Recommendations.40
  • 12. Sierra F.J. – Fissore A.D. 12  Topography determines speed ranges1  On uniform topography, speed is constant. And its value depends on topography and road2 category3  A change of speed is justified when there is a change in topography of an appreciable length4 and the terrain predisposes the driver to accept the speed variation5  There shouldn’t be abrupt speed variations (10 to 10 km/h)6  If there is no significant cost increase, it is recommended to project a higher speed road7 category.8 2.2.3 Access Management9 Land use. Uncontrolled development. Arterial roads are vital links between communities and serve as10 essential corridors for trade, travel, tourism and recreation. These roads generally promote land division, as11 well as residential and commercial growth along the entire strip.12 This growth creates safety problems which result in more deaths, injuries, property damage and traffic13 congestion; there is consequently need for costly improvements like additional lanes, detours, turn lanes,14 intersections and traffic lights.15 Unfortunately, few communities pass by-laws and ordinances to control the type and quality of the roadside16 development. Taxpayers must bear the costs associated with this development.17 Good land use planning, sensible regulation and reasonable site planning guides help reduce congestion18 and conflicts.19 2.3 Chapter 3: GEOMETRIC DESIGN20 2.3.1 Meaning of ‘geometric’ adjective21 Geometric Design. Design of visible features of the road.22 Geometry. A useful tool for the designer.23 The ‘geometric’ design does not consist in solving geometry problems, or strictly adopting figures in tables24 and graphs without first discerning their convenience according to specific conditions of the place or the25 type of road that will be designed.26 2.3.2 Stopping Sight Distance27 The expression of the braking distance is an empirical formula of a complex phenomenon. The differences28 between the simple theoretical model and the measurements are adjusted by the longitudinal friction or29 deceleration coefficient.30 Until 1971, AASHTO criteria were to consider longitudinal friction wet pavement, and the speed between31 80 and 93% of the design speed. Marching at design speed when the pavements were wet, was considered32 unrealistic.33 The AASHTO 1971 Addendum, based on the result of numerous field observations regarding the behaviour34 of drivers on wet roads, took the criteria of designing with 100% of the design speed on wet pavement.35 AVN10. According AASHTO Green Book'94 adopts:36  Brake reaction time = 2.5 s37  fl = wet longitudinal friction38  100% speed39 VN'67/80. Still in force, adopts40  Brake reaction time: variable according to speed41
  • 13. Sierra F.J. – Fissore A.D. 13  fl: longitudinal friction between dry and wet. Variable according to speed1  100% speed2 2.3.3 Horizontal Alignment3 Horizontal alignment curvature. American Terminology: Cm. European terminology: CCR Curvature4 Change Rate, [gon/km]5          m rad L e2ce1 L Δ Cm  6 Maximum side friction coefficient (ftmáx). The AVN10 adopts ftmáx according to AASHTO Green7 Book'94.8 Absolute minimum radius (RmínAbs). For VD and Maximum Superelevation Rates (emáx) given, it9 corresponds to the border condition of safety in relation to the lateral slipping; it considers maximum side10 friction.11 ftmáx)127(emáx 2V RmínAbs  12 Desirable minimum radius (RmínDes). For VD and emáx given, it is the radius calculated considering13 average running speed (VMM) and a side friction coefficient equal to zero.14 0)127(emáx 2VMM RmínDes  15 Distribution superelevation and side friction, R function. The AVN10 adopts VN'67/80 Nº 3 method;16 similar to AASHTO Green Book Nº 4 method.17 The superelevation entirely counteracts the centrifugal force of a vehicle traveling in free flow at VMM,18 from RmínDes where superelevation is maximum. For smaller radii until RmínAbs, the maximum19 superelevation rate is maintained.20
  • 14. Sierra F.J. – Fissore A.D. 14 1 Figure 3. Distribution superelevation and side friction2 Maximum safe speed (VMS). Maximum speed that can be maintained along a single horizontal curve (R)3 when the pavement is wet, tires are in good condition, the superelevation (e) is as designed and side friction4 is maximum (ftmáx).5 R(e+ftmáx)VMS= 1276 Radius consecutive curves. The horizontal alignment is one of the most influential factors in the speed of7 drivers. Operating speed variations along a road affect the frequency of crashes; the higher and the more8 unexpected the variety value, the greater the probability of collision.9 Ratio design. It is a significant improvement over the traditional design methods, which only checked the10 accomplishment of the minimum radius.11 Transition spiral curve. Unlike VN'67/80 the length of the transition spirals is limited, and long transitions12 are not recommended.13 2.3.4 Vertical Alignment14 Vertical curvature.15  % % m KL(m) i      16
  • 15. Sierra F.J. – Fissore A.D. 15 K represents the length of horizontal projection of the vertical curve per percent change in algebraic1 difference of tangent grades.2 AVN10. Use the AASHTO model with heights as DNV practice.3  h1 = 1.1 m height of eye4  h1 = 0.6 m headlight height5  Height of object:6 - Daily operation: h2 = 0.3 m (absolute)/0.15 m (normal)/0 m (desirable)7 - Night operation: h2 = 0.6 m (rear lights height)8  Height of vehicle = 1.3 m9  Light beam angle on the longitudinal axis α = 1º10  Height of eye of trucker; h1 = 2.2 m11  Vertical clearance H = 4.5 m12 VN'67/80. Use the AASHTO model with the following heights:13  h1 = 1.1 m height of eye14  h2 = 0.20 m height of object15  h1’ = 0.65 m height of headlight16  h2’ = 1.35 m height of car17  h1’’= 2.2 m height of eye of trucker18  H = 4.5 m minimum vertical clearance19  α = 1º angle of the light beam on the longitudinal axis20 2.3.5 Cross Section21 Geometrically, the typical cross section of a rural road is defined by the travelled way (lanes) and its sides:22 shoulders, slopes, ditches, and Right of Way (ROW) borders.23 The cross section elements affect the operational characteristics, safety and aesthetic.24 It should be designed according to patterns of speed, capacity and level of service, considering dimensions25 and operating characteristics of vehicles and driver behaviour.26 2.3.6 Roadsides (RS) – Clear Zone (CZ)27 RS. Both, external and internal areas to the side of the traveled way. One measured to the limit of the ROW28 border, and the other coinciding with the median.29 CZ. It is the unobstructed, traversable area provided beyond the edge of the traveled way for the recovery30 of errant vehicles. It includes shoulders, bike lanes, and auxiliary lanes, except those auxiliary lanes that31 function like through lanes.32 Whatever the reason, the driver that leaves the road, circulates through a potentially dangerous area. The33 probability of run-off-road crashes will be minimized if hazards at RS are reduced, and side slope is34 substantially flat, firm, unobstructed.35 The CZ tries to establish a balance between the benefits of having a safe, flat, firm road side that has no36 hazards, and the economic and social cost of providing for it.37 It does not establish a precise area of responsibility of the highway authority.38 It should be seen as a convenient width for the design, rather than an absolute demarcation between safe39 and unsafe conditions.40
  • 16. Sierra F.J. – Fissore A.D. 16 The effectiveness of having a clear zone at the side of the road follows the law of diminishing returns: the1 first meter of clear zone has greater safety benefit over the second, and so on.2 Shoulders. The AVN10 adopts full or partial paved shoulders.3 Slopes. Safety conditions:4  Steeper than 1:3 are dangerous (overturning)5  Between 1:3 and 1:4 are traversable but non-recoverable; vehicles can move, but the driver will6 not be able to return to the road7  1:4 or flatter are recoverable and traversable8 Bridges cross section. The AVN10 adopts bridge width equal to its access width.9 2.3.7 Design Consistency10 The concept of design consistency came up from the frequent disparities observed between design speed,11 V, allegedly uniform in the project, and the actual variable operating speed, VO.12 The differences between the VO and V reflect discrepancies between the reality of road design and what13 the driver expects from road design.14 The driver is surprised by unexpected road visible features called geometric inconsistencies; as a result, the15 driver feels his expectations are violated.16 These geometric inconsistencies demand higher driver attention; there is disparity between the driver's17 expectations and the actual mental load requirements.18 Drivers who recognize this disparity increase their level of attention and adjust their speed and/or road path.19 Those who fail to recognize this disparity or those who take too long to react, could choose incorrect speed20 or paths increasing the likelihood of crashes.21 Therefore, abrupt changes in the VO or in the road path are manifestations of high mental load demands22 associated with geometric inconsistencies.23 Sudden changes in VO are the leading cause of crashes on rural roads. Changes in the alignment can cause24 variations in the VO that increase the risk of crashes. One of the most critical design cases is the transition25 from tangent to cute curve (especially in isolated curves).26 Design consistency evaluation. Lamm’s approach to consistency analysis, suggests that there is a27 correlation between the average curvature and the occurrence of crashes. It states that drivers select a VO28 based on the perception of curvature, which does not necessarily correspond to the actual curve.29 It deals with the driver’s behaviour in two geometric elements:30  Isolated single curves, and31  Successive curves32 Methodology for assessing design consistency. Operating speed profile, VO. To identify and correct any33 inconsistencies in the geometric design of the road will significantly improve road safety.34 The VO usually indicates inconsistencies: when the road design does not coincide with the drivers’35 expectations, they reduce VO.36 The VO profile is the most practical and widely used way to improve the consistency of the geometric37 design. It is a graph where the VO is indicated on the vertical axis VO and the stations on horizontal axis.38 Considering a speed profile,39  The difference between VO and V is a good estimator of the inconsistency of a single geometric40 element. Consistency Indicator I: ICI = │V-VO│41
  • 17. Sierra F.J. – Fissore A.D. 17  The reduction of VO between two successive geometric elements shows the inconsistencies1 experienced by drivers as they travel from one geometry element to the next. Consistency Indicator II: ICII2 = │VOI-VOI+1│3 Taking into account consistency indicator I and II, the model by Lamm quantifies design consistency and4 classifies road design into three categories:5  Good. Consistent design with a low risk of crashes.6  Fair. Tolerable level design with a significantly higher crash risk compared with the level of a7 good design. It does not necessarily imply a redesign, unless there is a serious safety problem documented.8  Bad. Improper design which can lead to high crash rates. Requires a redesign.9 Models to estimate VO. Different models for cars and trucks were developed in different countries. They10 involve variables such as curvature, rate of change of curvature, longitudinal grade, length of tangents11 between curves, and rates of acceleration and deceleration.12 2.4 Chapter 4: FREEWAYS13 An arterial road must meet all the following conditions to be a freeway:14  Two traveled ways, of at least two lanes each, which are physically separated.15  Full control of access16  Grade-separated crossroads17  Interconnection with other roadways through interchanges18  Exclusive to motor traffic19  Superior design, suitable for high speed providing safety, comfort and economy.20 In Argentina we have the following superior road designs:21 FREEWAY = 24449 ACT DEFINITION22 AUTOVÍA = FREEWAY without FULL CONTROL of ACCESS23 SEMI-FREEWAY = FREEWAY without GRADE-SEPARATED CROSSROADS24 The so called ‘Autovías’, are neither defined in 24.449 Act nor by DNV.25 Besides, as the final intended design of an Autovía or Semi-freeway is that of a freeway, the urban crossings26 should be eliminated. In that case, the bypasses must have the appropriate features of a freeway.27 2.4.1 Wrong and good practices28 They were adapted from a Comprehensive Study of the Platform of Freeway and their Roadsides – Highway29 Technical Association of Spain30 2.5 Chapter 5: INTERSECTIONS31 Intersections can be at-grade or grade-separated. When crossroad are at-grade, separation is temporary.32 When there are grade-separate crossroads, there is spatial separation.33 2.5.1 Latest improvements borrowed from international practice34  Charts to select different types of intersection (Alberta, Canada)35  Intersection sight triangles according to AASHTO36  Ramp width according to measurements of DNV37  Computer software to generate turning paths of design vehicles38  Sizing of channelization components39  Modern Roundabouts40
  • 18. Sierra F.J. – Fissore A.D. 18 2.5.2 Conflict points1 2.5.3 Modern Roundabouts2 Traffic circle. It enables high-speed merging and weaving of vehicles. Priority is given to entering3 vehicles, facilitating high-speed entries. Reference AASHO 1965 VN'67/80.4 Modern roundabouts. The circulatory roadway is a series of T-intersections. Priority is given to5 circulating traffic. The vehicles enter the intersection only when there is sufficient gaps in circulating traffic.6 Reference AASHTO 2000.7 Advantages:8  It reduces vehicle speed9  It increments the capacity and safety in comparison with other intersection at-grade10  It solves all possible movement at an intersection, even reversals11 This chapter includes location criteria and parameters of geometric design.12 2.6 Chapter 6: INTERCHANGES13 2.6.1 Contents14  Warrants15  Desirable design features16  Incorporation of interchanges Diamond single point, Directional, and Weight type17  Review and correction of speed change lanes18  Typical radii for each type of ramp (direct, semidirect, indirect)19  Complementary issues (pedestrians, lighting)20 2.7 Chapter 7: ROAD AND ROADSIDE SAFETY21 2.7.1 Roadside, encroachments and crashes22 “While most of the crashes are attributed to driver errors, then why so many drivers make the same mistakes23 at the same locations of the road network? The crash black spots are not inventions”. Ruediger Lamm24 An encroachment occurs when a vehicle deviates from the limits of the lane.25 Most encroachments do not cause crashes, but most crashes occur due to encroachments.26 Frontal crashes (FC) usually occur when a vehicle crosses the centerline or median, and collides with27 another vehicle travelling the opposite direction.28 Run-off-road (ROR) crashes are associated to vehicles that deviate from the traveled way, invading the29 roadside (RS) and, in some cases, overturning or hitting natural or artificial fixed objects. These crashes30 usually involve single vehicles.31 FC and ROR are usually relate to:32  Design constraints and visual limitations on the traveled way33  Hazards in the roadsides34 They may be the result of the driver’s actions:35  Involuntary: falling asleep, being distracted, driving too fast for the prevailing traffic conditions36 or road37  Voluntary: performing an incorrect passing manoeuvre or running off the road to avoid a38 dangerous situation.39
  • 19. Sierra F.J. – Fissore A.D. 19 Contributing Factors:1  Speeding2  Driver age3  Alcohol or drug consumption4  Health problems like fainting or having a stroke5  Vehicle type6  Weather conditions7  Animals on the road8 To reduce the number of serious injuries and deaths, the goal should be to keep vehicles on the road, and9 prevent them from invading the roadsides. When this occurs, the design should strive to minimize the risk10 of running into dangerous conditions or dangerous objects on the roadside, trying to reduce the severity of11 eventual crashes. In order of priority, the following should be taken into account:12 1. Keeping vehicles on the roadway13 2. Reducing the risk of crashes14 3. Reducing the severity of the damage in the event of a crash15 2.7.2 Keeping vehicles on the roadway16 The basic philosophy of roadway design is to make an effort to keep the vehicles on the road. In order to17 accomplish this, the designer is helped by:18  Geometric Design: through the sight distances, horizontal alignment, superelevation, vertical19 alignment, lane and shoulder widths, auxiliary lanes20  Horizontal and vertical alignments coordination and design consistency21  Friction and surface smoothness of pavement22  Drainage. Eliminating water accumulation on the traveled way in order to avoid aquaplaning23  Delineation24  Rumble strips. Between 40 and 60% of ROR crashes are due to fatigue, sleepiness or25 distraction. Rumble strips are very effective devices to alert the drivers. On high speed and high traffic26 volume roads, their effectiveness is of 90%27  Lighting. It contributes to road safety. However, it should be carefully designed, especially the28 type of light poles and their location.29 2.7.3 Involuntary run-off-road (ROR)30 The cars leave the traveled way for many reasons and move beyond it:31  Driver error: excessive speed, sleep, recklessness, inexperience, careless driving, or driving32 under the influence of alcohol or drugs. A driver can also deliberately leave the road to avoid a collision33 with another vehicle, person, animal, or object on the roadway.34  Road Condition: poor alignment, poor visibility, low friction pavement, potholes, rutting, poor35 drainage, road marking, road signing or delineation inadequate.36  Failure of vehicle components: flaws in the steering and brakes, tire problem, instability of37 truckloads.38 Second design philosophy to reduce most of crashes: If accidental encroachments are inevitable, the sides39 of the road should be as clear and indulgent as reasonably possible, to give the opportunity to recover errant40 vehicles, stop safely, or back to the road, or reduce the severity of the damage resulting crash.41 2.7.4 Roadside hazards42 Fixed objects or conditions of the RS that its structure and location are, or may result, in a greater likelihood43 of material injury or death damage when a vehicle leaves the roadway.44
  • 20. Sierra F.J. – Fissore A.D. 20 Hazardous roadside elements.1  Trees and tree stumps. Specific hazards (a single tree), continuous hazards (rows of trees along2 the road)3  Poles: lighting, utilities, gates, road signs, traffic lights, SOS poles4  Bridge piers and abutments and tunnel walls placed at the median or external RS5  Side Barriers which are old or improperly installed6  Hazardous barrier end treatments poorly designed or wrongly located7  Headwall culverts and parallel and transverse culverts8  Large rock masses left at the RS9 Hazardous conditions.10  Steep slopes11  Ditches and backslopes12  Rough backslopes13  Permanent bodies of water: lakes, reservoirs, sea, rivers parallel to the road14  Pavement Edge Drop-Offs15 2.7.5 Hazard treatments on forgiving roadsides16 The basic concept of a forgiving roadside is that of providing a clear recovery area where an errant vehicle17 can be redirected back to the roadway, stop safely or slow enough to mitigate the effects of the crash.18 Hazardous objects. There are six options for mitigation of objects within the forgiving roadside:19  Remove them20  Redesign the obstacle so it can be traversed safely21  Relocate the obstacle to a point where it is less likely to be struck22  Reduce impact severity by using an appropriate breakaway device23  Redirect the errant vehicle with a longitudinal traffic barrier or use a crash cushion or both if24 the obstacle cannot be eliminated, relocated, or redesigned25  Delineate the obstacle if the above alternatives are not appropriate26 Hazardous conditions. Concerning slopes and drainage conditions:27  Flattening slopes more than 1:428  Designing traversable profile ditches and rounded edges.29 Hazards. Recommendations for the following hazards:30  Headwall culverts31  Slopes32  Trees33  Poles34  Pavement Edge Drop-Offs35  Curb and barrier/guardrail36 2.7.6 Zegger Risk Rate37 The Zegger risk rate system considers the clear zone width, slope, the existence of hazardous objects and38 the roughness of the ground.39 The level of risk increases from 1 to 7. Seven being the most risky concerning frequency and severity.40 2.7.7 Barrier needs41
  • 21. Sierra F.J. – Fissore A.D. 21 Barriers are not an indisputable choice for road safety. They are hazardous and can only be justified if a1 crash against it is less severe than crashing in the absence of a barrier.2 Every effort should be made in the design and construction stages to eliminate the need for barriers.3 Modern practice tends to design roads where barriers are unnecessary, resulting in greater safety and a4 lower cost.5 2.7.8 Containment and redirection systems6 The AASHTO Manual for Assessing Safety Hardware (MASH) contains the current recommendations for7 testing and evaluating the crashworthy performance of safety devices and has replaced NCHRP Report 350.8 In the update, it is shown a comparison between the Containment Level of the European Standard (EN-9 1317) and Test Level of the American Standard.10 To AVN10, crashworthiness of safety devices is currently accepted if the system has met all of the11 evaluation criteria listed in MASH or NCHRP Report 350 for each of the required crash tests.12 Longitudinal barriers. Classification according to deformation:13  Rigid14  Semi-rigid15  Flexible16 Classification according to location:17  Shoulder18  Median19 This update establishes the design characteristics and use of each type of barrier.20 Transitions. Transition sections are necessary to provide continuity of protection when two roadside21 barriers of differing lateral stiffness are joined together. Transition sections with gradually increasing lateral22 stiffness are necessary when a roadside barrier joins another barrier system with dissimilar deflection23 characteristics, such as a W-beam guardrail connected to a bridge rail.24 This update establishes recommendations for transition design.25 Barrier end treatments. A vehicle impacting an untreated end of a barrier can result in serious damage.26 It may be stopped abruptly, barrier elements could penetrate the passenger compartment, or the vehicle may27 become unstable and eventually roll over.28 This update establishes recommendations for barrier end treatment.29 2.8 Chapter 8: SPECIAL DESIGNS30 2.8.1 Vehicle facilities31  Vehicle inspection stations32  Safe rest areas33  Halts in historic sites and scenic overlooks34  Modal transfer stations35  Load control stations36  Stations brake test37  Escape ramps38  Bus stops and docks39  High Occupancy Vehicle lanes40  Bus stop on freeways41
  • 22. Sierra F.J. – Fissore A.D. 22  Recreational roads1  Access to commercial facilities – Gas stations2 2.8.2 Pedestrian facilities3  Paths and trails: justifications, types, location and width4  At-grade intersections: crosswalks5  Grade-separated: under/high pass crosswalks, curb ramps, refuge islands6  Mid-block crosswalks7  Ramps8  Stairs9  Pedestrian safety10 2.8.3 Cycling facilities11 2.8.4 Railway at level crossings12 2.8.5 Utilities13 Especially the problem of poles14 2.8.6 Environment designs15 2.8.7 Fencing16 2.8.8 Plantations17 2.8.9 Landscaping18 2.8.10 Urban crossings19 Especially Mobility/Accessibility urban crossings, Traffic Calming20 2.9 Chapter 9: ROUTE-LOCATION21 The route-location seeks a combination of straight and curved alignments to suit the terrain and to meet the22 requirements.23 It is necessary to do preliminary work which basically comprises the comparative study of all corridors to24 select the one that has the best economical, technical, social, and aesthetic characteristics, trying to make it25 eco-friendly.26 2.9.1 Route-location selection factors27 Route-locations depends on design speed, and this depends on the function of the road, traffic and28 topography.29 When the area is mountainous, human, traffic and topography factors determine the Route-location. In a30 flat area, human, traffic and the land use factors are of key importance.31 2.9.2 Route-location stages32 They are tasks with similar characteristics. Route-location is not a linear process in which the stages take33 place one after another. It is rather a successive approximation process in which there is an overlap of the34 stages.35 2.9.3 Key technique for a good technical route-location36 In flat topography, the route-location technique is relatively simple. Tangents are considered first and then37 curves are drawn according to [C3].38
  • 23. Sierra F.J. – Fissore A.D. 23 In mountainous topography the best technique is the opposite. On the contours of the terrain digital model,1 circular curves are placed first, taking into account the minimum gap required for spiral curves; and then2 tangents are drawn.3 2.10 Chapter 10: GENERAL INSTRUCTIONS4 This chapter deals with the stages definition and project documentation, topographic surveys, measurement5 tolerance, project plans, symbols, engineering reports submission, technical and administrative procedures6 for design exceptions.7 2.11 ATLAS8 Model plans of horizontal and vertical alignment, cross sections, graphs, charts, nomograms, studies and9 projects instructions.10 3 STATUS11 Up to now -November 2014- the Standard has not been enforced.12 4 ACKNOWLEDGMENT13 The authors are grateful for the help and the permanent encouragement of the Dr. John Morrall, P.Eng14 5 REFERENCES15 The full text of the update and all references can be downloaded from:16 http://ingenieriadeseguridadvial.blogspot.com/2012/11/normas-y-recomendaciones-de-diseno_6.html17 5.1 General Reference Literature18 Spanish or translated to Spanish documents included. Total 4019 5.2 Particular Reference Literature20 For chapter, Spanish or translated to Spanish documents included. Total: 22421 22
  • 24. Sierra F.J. – Fissore A.D. 24 LIST OF FIGURES1 Figure 1. Chronology of Sources: 1954-1980............................................................................................... 72 Figure 2. Chronology of Sources: 1980-2010............................................................................................... 83 Figure 3. Distribution superelevation and side friction............................................................................... 144 5