This document discusses lane width and its relationship to road safety based on a review of previous research studies. It makes the following key points:
1. Early research that looked at accident rates versus lane width alone was flawed because it did not account for other factors correlated with lane width like traffic volume.
2. More recent studies that controlled for traffic volume have found mixed or inconclusive results on the safety effects of lane width. Wider lanes do not consistently show reductions in accident rates.
3. The relationship between safety and lane width is complex due to driver behavior adaptations - wider lanes may induce higher speeds but also provide more room for error. The empirical evidence does not clearly show whether wider lanes improve or harm safety
Safer Curves On Multiple Lane Roads GranlundJohan Granlund
Many road users have crashed at high speed in sharp curves during slippery road conditions. To reduce the skid risk following high lateral forces, outercurves are banked into superelevation. Road designers are guided by design codes into what superelevation values to select among, given a reference speed and curve radius. Curve design codes are based on analysis of cornering forces acting on AASHO’s point-mass model of a vehicle. While the design codes typically yield curves with acceptable safety level, there is a systematic problem with skid accidents on multiple lane curves. This paper discusses a causal factor and recommends changes in curve design codes as well as actions to improve safety in existing unsafe curves. Current road design practise approximates the vehicle travelled path (and thus lateral force) by the road curvature, which is reasonable on small roads. On multiple lane roads however, many drivers are changing lane also in sharp curves since no oncoming traffic is present. When shifting lane quickly, the vehicle experience a transient “curve radius” much sharper than indicated by the road curve radius. This can yield higher lateral force than the road design code have considered. Then the superelevation may be insufficient - when the road is slippery - to outbalance the cornering force. As a rule by thumb, sharp curves on multiple lane roads with high speed traffic should have maximum allowed cross slope in order to increase stability.
Study On Traffic Conlict At Unsignalized Intersection In Malaysia IOSR Journals
The research conducted is traffic conflict at unsignalized intersections . The purpose of this research
is to study accident data used as an identification of hazardous location leads to less accurate countermeasures.
It is because accidents are not always reported especially accident involving damage only and this situation can
reduce good comparative analysis. To overcome these lacks of accident data, many ways of employing nonaccident
data have been suggested. One of the ways using non-accident data is traffic conflicts, which is defined
as critical incidents not necessarily involving collisions. The traffic conflict technique was originally set up to
provide more reliable data and information of traffic problems at intersections which actually would replace the
unclear and incomplete recorded data accident. The conflict study was done at the selected unsignalized
intersection where types of traffic conflict can be identified and classified. Various road users involved in the
conflict at the unsignalized intersection were also observed. Then conflicts data captured were analyzed using
the computer program to observe for any conflicts at the intersections. The linear regression graph was used to
show the relationship between conflict and accident data where two different equations were derived from the
graph. This equation may be used to make a prediction for the relationship that might exist between those two
variables at another location.
INFLUENCE OF ROAD GEOMETRY AND PERCENTAGE OF HEAVY VEHICLES ON CAPACITY AT MU...IAEME Publication
Multi-lane highways symbolize the plurality of the overall length of highway network in Egypt. The most serious factors affecting the capacity for any roadway are counted the road geometry and the percentage of heavy vehicles (HV). Subsequently, this research aims to discuss the relationship between the road geometric characteristics and HV, and capacity by statistical modeling. The modeling is divided into two models. First is the modeling for capacity on one direction of flow (COD) and second is the modeling for capacity on right lane (CRL). In this study, the road geometric and traffic data are collected from straight section at 28 various sites that are located in desert highways. These sites are separated into 14 sections in divided four-lane roads, 7 sections in divided six-lane roads, and 7 sections in divided eight-lane roads. The results showed that the statistical modeling gives models with high R 2 (coefficient of determination) and low ǁδǁ (percent error) values for estimating COD and CRL. In addition, the most influential variables on COD in all sites are lane number (NL), median width (MW), and HV respectively, while the most influential variables on CRL in all sites are MW and HV, respectively. These results are so important for road authorities in Egypt as they can determine capacity for different straight sections and improve the traffic performance of them in the future.
In this paper, I argue that modern roundabouts are a highly favorable solution for roadway intersections because of their benefits with regards to safety, environmental factors, and traffic flow efficiency. I begin by addressing public opinion of roundabouts and then explaining their safety benefits. Next, I demonstrate how roundabouts can overcome commonly perceived drawbacks related to usage by pedestrians, cyclists, oversize vehicles, and emergency vehicles. The penultimate sections are devoted to the cost and land considerations and the environmental benefits associated with roundabouts. Lastly, I show how roundabouts improve traffic flow efficiency and conclude that, all factors considered, roundabouts are a highly favorable design solution.
The Effects of Vehicle Speeds on Accident Frequency within Settlements along ...IJMER
Literature provides overwhelming evidence that a strong relationship exist between
vehicle speed and accident risk, and an outcome severity in the event of an accident. Excessive speed
is said to be a major causal factor of road accidents on trunk roads; contributing 60% of all vehicular
accidents. However, speed rationalization measures implemented on a number of trunk roads in
Ghana have realized very little success. This study therefore investigated the effects of vehicle speeds
on accident frequency within settlements along trunk roads. Data was collected on accidents, vehicle
speeds and other road and environment-related features for ninety-nine (99) settlements delineated
from four (4) trunk roads. Correlation analysis was employed to establish useful relationships and
provided insight into the contributions of relevant road and environmental-related variables to the
occurrence of road traffic accidents. Using the Negative Binomial error structure within the
Generalized Linear Model framework, core (flow-based) models were formulated based on accident
data and exposure variables (vehicle mileage, daily pedestrian flow and travel speed). Incremental
addition of relevant explanatory variables further expanded the core models into comprehensive
models. Findings indicate the main risk factors are number of accesses, daily pedestrian flow and
total vehicle kilometers driven, as vehicle speed did not appear to influence the occurrence of road
traffic accidents within settlements along trunk roads. In settlement corridors, mitigating accident
risks should not focus only on traffic calming but rather on measures that reduce pedestrian and
vehicular conflict situations as well as improve conspicuity around junctions
Overestimating the road traction of one's own car can be fatal while taking a sharp turn. I suggest the integration of an instrument which calculates the lateral forces over the next 10 seconds and displays a warning if physical stability limits will be exceeded.
The graph will respond in real time to the vehicle velocity, providing valuable feedback for the driver, especially in critical situations.
Current sensory data (GPS, map data and electronic traction control) are sufficient to provide a steady stability prediction, and existing gauges can be used as display.
If the study proves to be successful, transition towards the new technology would be only a matter of a software update.
CALIBRATION OF VEHICLE EMISSIONS-SPEED RELATIONSHIPS FOR THE GREATER CAIRO ROADSIAEME Publication
The air pollution in Cairo is a matter of serious concern. The air pollution in greater Cairo is more than 10 to 100 times of acceptable world standards. There is a wide range of speed variation in Cairo. Consequentially, there is a wide range of emission rates. This research explains the relationship between vehicle speed and emissions for small cars using field tests. The representative car in this research is the Daewoo Lanus model 2000. This car is a representative for most small modern cars in Egypt. The mobile emission detector has been fixed on the car emission source. Tests have been implemented in two roads: Salah Salem road and Auto strad road. More than 1000 readings have been taken from the detector at various speeds. The speed varied between 0 and 85 km per hour and the relationships between speed and four types of emissions have been studied
Accident Analysis At The Black Spot: A Case Studyiosrjce
Humans prefer comfort in every form. The same reason has prompted him to lay the roads and invent
motor vehicles. This is the era we are seeing very huge number of vehicles on the roads. But to his dismay, with this
comfortless, there came the problem of accidents due to increase in traffic volume. The increased human misery and
serious economic loss caused by road accidents demand the attention of the society and call for the solution of this
problem. The causes for accidents are many. It may be either due to the fault of the driver or vehicular defect, tough
weather condition or due to improper road design and many more. Precisely, if accidents occur frequently at a
particular road stretch then, the location is coined as Black Spot. In the present work, an attempt has been made to
evaluate the effects of highway geometrics and speed parameters in increased accident rates at the black spot. The
black spot of our interest is Busthenahalli bypass (spot-A) on National Highway-48 between Bangalore and
Mangalore, Karnataka, India. The mixed traffic condition prevailing on the road and the inadequate geometric
conditions on field create the problem of increased accident rates. The regression equation for the condition
prevailing has been found for the location under consideration which represents the variation of accident rate with
age of the driver, rise and fall, pavement width, Stopping Sight Distance for operating speed and regulating speed and
Annual Daily Traffic(ADT).
The Impact of the Combination of Circular Curve and Transition Curve on Highw...IJERA Editor
By investigating the accident in 2009 and 2011 of Taijiu Expressway, the study analyzed the relationship
between the horizontal curve radiuses, the length of horizontal curve, the length of transition curve and the
number of accidents, established the corresponding regression model. The trend of accidents was determined
with different length of transition curve and different combination of circular curve according to this model. The
results show that the circular curve radius and length of transition curve increase with the decreases of accidents
number, the number of accidents decreases with the increase of the ratio of the length of the transition curve and
the length of the round curve. When the ratio of the parameters of the transition curve and the radius of the circle
is between 0.3-0.6, the accidents are more focused. The bigger change rate of curves is, there are more accidents
of flat curve. To evaluate road traffic safety from the perspective of horizontal curve alignment design, these
regularities have very important reference.
Hvtt13 granlund et al lowered crash risk with banked curves designed for heav...Johan Granlund
Outer-curves are banked into superelevation in order to reduce the crash risk due to high demand for side friction between tyres and road. Road design codes use analysis of cornering forces acting on a point-mass model of a vehicle, where the Centre-of-Gravity (CoG) is assumed to be located at the tyre footprint. This may be relevant for low passenger cars. The scope here was to investigate the need for superelevation for heavy goods vehicles (HGV) with high CoG. The study used a vehicle model including both vertical and lateral position of CoG, as well as road split friction under left/right wheels. The results showed that superelevation demand increases with height and lateral displacement of CoG, and peaks when the curve is more slippery under outer wheels than under inner wheels. A conclusion was that the traditional point-mass “car model” can underestimate the superelevation needed for safe HGV operations. The paper recommends some improvements in road design codes for new curves, as well as some actions to improve safety in existing curves.
International Refereed Journal of Engineering and Science (IRJES)irjes
The core of the vision IRJES is to disseminate new knowledge and technology for the benefit of all, ranging from academic research and professional communities to industry professionals in a range of topics in computer science and engineering. It also provides a place for high-caliber researchers, practitioners and PhD students to present ongoing research and development in these areas.
Notes on the formula for minimum horizontal radius. Rev. 05 (January 2016) - Added notes on different measures of speed and different speeds for horizontal and vertical
design. Added row h to values table. Modified layout. Added extra note and reference on 3D road design.
Road bumps reduce vehicle speeds on residential streets and other densely populated areas, thus improving safety and comfort for pedestrians and bicyclists. Unfortunately, the effects on health and safety for drivers and passengers passing these obstacles are rarely considered by road agencies, consultants and contractors. Many current bumps induces harmful whole-body vibration and shock when passing, even at legal speeds. Injuries can be immediate, e.g. fracture of vertebrae, or long term, e.g. low back pain. Bus drivers in many cities pass up to 40.000 bumps per year. The bumps will also cause additional longitudinal and vertical stress to the vehicle. A literature review shows that previous research on the subject of road bumps has been severely misinterpreted. As a result, bumps are in many countries today designed to cause a high maximum vertical acceleration (shock) level. To cause shocks on purpose, is in obvious conflict with ergonomic knowledge such as in directive 2002/44/EC. In a project described in this paper, a “shock-free” speed hump has been designed using vibration engineering. The new hump cause uncomfortable vibration at high driving speeds, but only a minimum of shock occur when passing. In 2003 the first hump ramps of this design were casted in Portland Cement Concrete, available from www.gunnarprefab.se
Impact of Vehicle Class and Tire Pressure on Pavement Performance in MEPDGIJERA Editor
The new Mechanistic-Empirical Pavement Design Guide (MEPDG) design and analysis procedures defines
the exact traffic loading by defining the specific number of each vehicle class and the use of axle load
distribution factors instead of the equivalent single axle load (ESAL). The number of traffic inputs (parameters)
in MEPDG was found to be 17024. This research aimed to evaluate the sensitivity of the predicted flexible
pavement distress to vehicle class and tire pressure in MEPDG. To evaluate the impact of vehicle (truck) class
on pavement sections, different cases of loading were analyzed. For each case, the MEPDG Ver. 1.1 was used to
evaluate the effect of tire pressure by solving each case for a tire pressure of 120 and 140 psi. The effect of the
traffic parameters on asphalt pavement (AC) rutting, base rutting, subgrade rutting, international roughness
index (IRI), longitudinal cracking and fatigue (alligator) cracking were investigated.
It was found that vehicle class distribution (VCD) would cause clear impact (comparable to the effect of
AADTT level) only if the major traffic is of specific class (very light or very heavy). If this is not the case, the
vehicle class distribution will not be a significant factor that affects the final design because most of the trucks
had similar impact on flexible pavement distresses. The impact of tire pressure is clear on longitudinal cracking,
fatigue cracking and AC rutting, and have no significant impact on both base and subgrade rutting.
The International Journal of Engineering & Science is aimed at providing a platform for researchers, engineers, scientists, or educators to publish their original research results, to exchange new ideas, to disseminate information in innovative designs, engineering experiences and technological skills. It is also the Journal's objective to promote engineering and technology education. All papers submitted to the Journal will be blind peer-reviewed. Only original articles will be published.
The papers for publication in The International Journal of Engineering& Science are selected through rigorous peer reviews to ensure originality, timeliness, relevance, and readability.
Saudi Arabia stands as a titan in the global energy landscape, renowned for its abundant oil and gas resources. It's the largest exporter of petroleum and holds some of the world's most significant reserves. Let's delve into the top 10 oil and gas projects shaping Saudi Arabia's energy future in 2024.
Explore the innovative world of trenchless pipe repair with our comprehensive guide, "The Benefits and Techniques of Trenchless Pipe Repair." This document delves into the modern methods of repairing underground pipes without the need for extensive excavation, highlighting the numerous advantages and the latest techniques used in the industry.
Learn about the cost savings, reduced environmental impact, and minimal disruption associated with trenchless technology. Discover detailed explanations of popular techniques such as pipe bursting, cured-in-place pipe (CIPP) lining, and directional drilling. Understand how these methods can be applied to various types of infrastructure, from residential plumbing to large-scale municipal systems.
Ideal for homeowners, contractors, engineers, and anyone interested in modern plumbing solutions, this guide provides valuable insights into why trenchless pipe repair is becoming the preferred choice for pipe rehabilitation. Stay informed about the latest advancements and best practices in the field.
TECHNICAL TRAINING MANUAL GENERAL FAMILIARIZATION COURSEDuvanRamosGarzon1
AIRCRAFT GENERAL
The Single Aisle is the most advanced family aircraft in service today, with fly-by-wire flight controls.
The A318, A319, A320 and A321 are twin-engine subsonic medium range aircraft.
The family offers a choice of engines
Automobile Management System Project Report.pdfKamal Acharya
The proposed project is developed to manage the automobile in the automobile dealer company. The main module in this project is login, automobile management, customer management, sales, complaints and reports. The first module is the login. The automobile showroom owner should login to the project for usage. The username and password are verified and if it is correct, next form opens. If the username and password are not correct, it shows the error message.
When a customer search for a automobile, if the automobile is available, they will be taken to a page that shows the details of the automobile including automobile name, automobile ID, quantity, price etc. “Automobile Management System” is useful for maintaining automobiles, customers effectively and hence helps for establishing good relation between customer and automobile organization. It contains various customized modules for effectively maintaining automobiles and stock information accurately and safely.
When the automobile is sold to the customer, stock will be reduced automatically. When a new purchase is made, stock will be increased automatically. While selecting automobiles for sale, the proposed software will automatically check for total number of available stock of that particular item, if the total stock of that particular item is less than 5, software will notify the user to purchase the particular item.
Also when the user tries to sale items which are not in stock, the system will prompt the user that the stock is not enough. Customers of this system can search for a automobile; can purchase a automobile easily by selecting fast. On the other hand the stock of automobiles can be maintained perfectly by the automobile shop manager overcoming the drawbacks of existing system.
About
Indigenized remote control interface card suitable for MAFI system CCR equipment. Compatible for IDM8000 CCR. Backplane mounted serial and TCP/Ethernet communication module for CCR remote access. IDM 8000 CCR remote control on serial and TCP protocol.
• Remote control: Parallel or serial interface.
• Compatible with MAFI CCR system.
• Compatible with IDM8000 CCR.
• Compatible with Backplane mount serial communication.
• Compatible with commercial and Defence aviation CCR system.
• Remote control system for accessing CCR and allied system over serial or TCP.
• Indigenized local Support/presence in India.
• Easy in configuration using DIP switches.
Technical Specifications
Indigenized remote control interface card suitable for MAFI system CCR equipment. Compatible for IDM8000 CCR. Backplane mounted serial and TCP/Ethernet communication module for CCR remote access. IDM 8000 CCR remote control on serial and TCP protocol.
Key Features
Indigenized remote control interface card suitable for MAFI system CCR equipment. Compatible for IDM8000 CCR. Backplane mounted serial and TCP/Ethernet communication module for CCR remote access. IDM 8000 CCR remote control on serial and TCP protocol.
• Remote control: Parallel or serial interface
• Compatible with MAFI CCR system
• Copatiable with IDM8000 CCR
• Compatible with Backplane mount serial communication.
• Compatible with commercial and Defence aviation CCR system.
• Remote control system for accessing CCR and allied system over serial or TCP.
• Indigenized local Support/presence in India.
Application
• Remote control: Parallel or serial interface.
• Compatible with MAFI CCR system.
• Compatible with IDM8000 CCR.
• Compatible with Backplane mount serial communication.
• Compatible with commercial and Defence aviation CCR system.
• Remote control system for accessing CCR and allied system over serial or TCP.
• Indigenized local Support/presence in India.
• Easy in configuration using DIP switches.
Immunizing Image Classifiers Against Localized Adversary Attacksgerogepatton
This paper addresses the vulnerability of deep learning models, particularly convolutional neural networks
(CNN)s, to adversarial attacks and presents a proactive training technique designed to counter them. We
introduce a novel volumization algorithm, which transforms 2D images into 3D volumetric representations.
When combined with 3D convolution and deep curriculum learning optimization (CLO), itsignificantly improves
the immunity of models against localized universal attacks by up to 40%. We evaluate our proposed approach
using contemporary CNN architectures and the modified Canadian Institute for Advanced Research (CIFAR-10
and CIFAR-100) and ImageNet Large Scale Visual Recognition Challenge (ILSVRC12) datasets, showcasing
accuracy improvements over previous techniques. The results indicate that the combination of the volumetric
input and curriculum learning holds significant promise for mitigating adversarial attacks without necessitating
adversary training.
CFD Simulation of By-pass Flow in a HRSG module by R&R Consult.pptxR&R Consult
CFD analysis is incredibly effective at solving mysteries and improving the performance of complex systems!
Here's a great example: At a large natural gas-fired power plant, where they use waste heat to generate steam and energy, they were puzzled that their boiler wasn't producing as much steam as expected.
R&R and Tetra Engineering Group Inc. were asked to solve the issue with reduced steam production.
An inspection had shown that a significant amount of hot flue gas was bypassing the boiler tubes, where the heat was supposed to be transferred.
R&R Consult conducted a CFD analysis, which revealed that 6.3% of the flue gas was bypassing the boiler tubes without transferring heat. The analysis also showed that the flue gas was instead being directed along the sides of the boiler and between the modules that were supposed to capture the heat. This was the cause of the reduced performance.
Based on our results, Tetra Engineering installed covering plates to reduce the bypass flow. This improved the boiler's performance and increased electricity production.
It is always satisfying when we can help solve complex challenges like this. Do your systems also need a check-up or optimization? Give us a call!
Work done in cooperation with James Malloy and David Moelling from Tetra Engineering.
More examples of our work https://www.r-r-consult.dk/en/cases-en/
Quality defects in TMT Bars, Possible causes and Potential Solutions.PrashantGoswami42
Maintaining high-quality standards in the production of TMT bars is crucial for ensuring structural integrity in construction. Addressing common defects through careful monitoring, standardized processes, and advanced technology can significantly improve the quality of TMT bars. Continuous training and adherence to quality control measures will also play a pivotal role in minimizing these defects.
Student information management system project report ii.pdfKamal Acharya
Our project explains about the student management. This project mainly explains the various actions related to student details. This project shows some ease in adding, editing and deleting the student details. It also provides a less time consuming process for viewing, adding, editing and deleting the marks of the students.
Overview of the fundamental roles in Hydropower generation and the components involved in wider Electrical Engineering.
This paper presents the design and construction of hydroelectric dams from the hydrologist’s survey of the valley before construction, all aspects and involved disciplines, fluid dynamics, structural engineering, generation and mains frequency regulation to the very transmission of power through the network in the United Kingdom.
Author: Robbie Edward Sayers
Collaborators and co editors: Charlie Sims and Connor Healey.
(C) 2024 Robbie E. Sayers
NO1 Uk best vashikaran specialist in delhi vashikaran baba near me online vas...Amil Baba Dawood bangali
Contact with Dawood Bhai Just call on +92322-6382012 and we'll help you. We'll solve all your problems within 12 to 24 hours and with 101% guarantee and with astrology systematic. If you want to take any personal or professional advice then also you can call us on +92322-6382012 , ONLINE LOVE PROBLEM & Other all types of Daily Life Problem's.Then CALL or WHATSAPP us on +92322-6382012 and Get all these problems solutions here by Amil Baba DAWOOD BANGALI
#vashikaranspecialist #astrologer #palmistry #amliyaat #taweez #manpasandshadi #horoscope #spiritual #lovelife #lovespell #marriagespell#aamilbabainpakistan #amilbabainkarachi #powerfullblackmagicspell #kalajadumantarspecialist #realamilbaba #AmilbabainPakistan #astrologerincanada #astrologerindubai #lovespellsmaster #kalajaduspecialist #lovespellsthatwork #aamilbabainlahore#blackmagicformarriage #aamilbaba #kalajadu #kalailam #taweez #wazifaexpert #jadumantar #vashikaranspecialist #astrologer #palmistry #amliyaat #taweez #manpasandshadi #horoscope #spiritual #lovelife #lovespell #marriagespell#aamilbabainpakistan #amilbabainkarachi #powerfullblackmagicspell #kalajadumantarspecialist #realamilbaba #AmilbabainPakistan #astrologerincanada #astrologerindubai #lovespellsmaster #kalajaduspecialist #lovespellsthatwork #aamilbabainlahore #blackmagicforlove #blackmagicformarriage #aamilbaba #kalajadu #kalailam #taweez #wazifaexpert #jadumantar #vashikaranspecialist #astrologer #palmistry #amliyaat #taweez #manpasandshadi #horoscope #spiritual #lovelife #lovespell #marriagespell#aamilbabainpakistan #amilbabainkarachi #powerfullblackmagicspell #kalajadumantarspecialist #realamilbaba #AmilbabainPakistan #astrologerincanada #astrologerindubai #lovespellsmaster #kalajaduspecialist #lovespellsthatwork #aamilbabainlahore #Amilbabainuk #amilbabainspain #amilbabaindubai #Amilbabainnorway #amilbabainkrachi #amilbabainlahore #amilbabaingujranwalan #amilbabainislamabad
1. The terms lane width, roadway width, carriageway or pavement width will be used
1
interchangeably.
Earlier drafts of this papers were prepared in the course of a project for UMA
2
Engineering (for the new Canadian Geometric Design Guide) and for DELCAN (in ORSAM 98).
“On rural two-lane roads capacities of 10 and 11-fr lanes, expressed as a percentage of
3
12-ft lane capacity are 77 and 88 percent, respectively.r four lane undivided highways these
percentages are 89 and 95 . . .” (Green book, 1984, p. 360). Capacity is the reciprocal value of
the average minimum headway. Thus, with wider lanes drivers choose shorter headways.
1.1
C:workPROJECTSHSISIHSDM-MultilaneLiterature Reviews1. Lane widthlane width.wpd
This is an unedited draft reflecting my personal opinions. Ezra Hauer
Lane Width and Safety.
1
E. Hauer. Draft , March 7, 2000.
2
1. Introduction.
The link between lane width and safety is woven of two principal strands. First, the wider the
lanes the larger will be the average separation between vehicles moving in adjacent lanes. This may
provide a wider buffer to adsorb the small random deviations of vehicles from their intended path.
However, drivers adapt to the road they see. Wider lanes tend to induce somewhat faster travel and
perhaps closer following (as evident in the relationship between lane width and capacity ). Whether
3
this complex adaptation to wider lanes benefits safety or whether it harms it, cannot be anticipated
by speculation. Useful information can be extracted only from empirical evidence. As will become
evident, the preconceived notion that wider lanes must be safer has, at times, intruded on the
judgement of researchers. The second strand in the link between safety and lane width is that a wider
lane may provides more room for correction in near-accident circumstances. Thus, e.g., for a narrow
lane a moment’s inattention may lead a vehicle off the edge-drop and onto a gravel shoulder but if
the lane is wider and the shoulder paved the same inattention will still leave the vehicle on the paved
surface. In these near-accident circumstances, it will be difficult to separate between the effect of lane
width, shoulder width, shoulder paving, edge-drops etc.
It is likely that lane width plays a somewhat different role in single and multilane roads. The
lane width requirements for single-lane roads were originally derived from the observation of driver
behaviour. That lane width at which drivers did not feel the need to shift to the right when meeting
and oncoming truck was deemed appropriate. The same criterion may apply to the inner lane of an
undivided multilane lane road, but it does not apply to the other lanes nor to divided roads.
2. 1.5
1.75
2
2.25
2.5
Accidents/MVM
16 18 20 22 24
Carriageway Width [ft]
1.2
C:workPROJECTSHSISIHSDM-MultilaneLiterature Reviews1. Lane widthlane width.wpd
Figure 1. Non-junction accidents for two-
lane roads in Buckhinghampshire.
2. One matter of method.
Before embarking on the survey of what researchers have found, at least one methodological
issue requires airing. Early research relied on the examination of variables one-by-one: Accident rate
was plotted on the vertical axis against lane width (or degree of curve, grade, etc.) on the horizontal
axis. This intuitively appealing practice may lead astray.
To illustrate, consider an early study (Research on Road Traffic, p.411), most likely based on
Coburn, T.M., The relation between accidents and layout on rural roads. International Road Safety
and Traffic Review, Autumn 1962, pp. 15-20) which shows the relationship in Figure 1.
The squares show theaccident rates for the four carriageway width categories in which data
has been reported. Thus, carriageways that are 16-17 ft wide had 2.3 accidents/MVM (MVM=Million
Vehicle Miles) as shown by point A while carriageways 22 to 24 ft wide had an accident rate of 1.7
accidents/MVM as shown by point B. It is tempting to interpret this to mean that widening the
carriageway will reduce the number of accidents.
However, narrower roads usually carry less traffic. Indeed, in this case, the relationship
between carriageway width and average ADT (ADT=Average Daily Traffic) is shown in Figure 2.
3. 0
1000
2000
3000
Average
Daily
Traffic
16 18 20 22 24
Carriageway Width [ft]
0
1
2
Accidents/(mile-year)
0 1000 2000 3000
Average Daily Traffic (ADT)
1.3
C:workPROJECTSHSISIHSDM-MultilaneLiterature Reviews1. Lane widthlane width.wpd
Figure 2
Figure 3
It is normal and proper
engineering practice for roads that
carry little traffic to be built and
maintained to lesser standards.
Therefore one may expect not only
carriageway width but also shoulder
width, horizontal curvature, distance
to obstacles, gradients, sight distances,
side access etc., all these to be
associated with ADT. It follows that
the association seen in Figure 1 may
represent not only (or mainly) the
effect of carriageway width but also (perhaps predominantly) the effect of all the other causal factors
that affect accident occurrence and are associated with traffic flow.
How, in this case, accident frequency
and ADT are associated is shown in
Figure 3. The non-linear
relationship between traffic and
accident frequency in Figure 3 is found
in many data sets by many researchers.
It reflect not only the tendency of
design and maintenance standards to
be a function of traffic, but also the
complexities of car following, speed
choice, driver vigilance, accident
severity, inclination to report accidents
etc., all of which vary with the
intensity of traffic.
The squares in Figure 3 are the data from Research on Road Ttraffic to which the smooth
curve 0.003×ADT has been fitted. If this expression correctly represents reality, then the accident
0.8
rate is given by accidents/MVM=0.003×ADT / (ADT×365×10 ). This follows from the definition
0.8 -6
4. 1
2
3
Accidents/MVM 0 1000 2000 3000
Average Daily Traffic ADT
A
B
1.4
C:workPROJECTSHSISIHSDM-MultilaneLiterature Reviews1. Lane widthlane width.wpd
Figure 4
of the accident rate. How this accident ra te varies with ADT is shown by the smooth curve in Figure
4.
If then Figure 3 correctly
represents the association between
accident frequency and traffic flow, it
is a logical consequence that the
accident rate must decline with traffic
flow. This decline is a reflection of the
many things that change when traffic
flow changes - design standards, road
maintenance, traffic characteristics,
driver behaviour - not only of the
change in carriageway width. It
follows that what is pictured in Figure
1 as the influence of carriageway width
is in reality only a reflection of the fact that all low traffic flows the accident rate tends to be high for
various reasons, and that narrow carriageways tend to go with low traffic flows. When commenting
on the same report, (Research on Road Ttraffic) say, Roy Jorgensen and Associates say that:
“Therefore, ADT may be affecting the accident rates because it was not held constant for the
analysis”.
The kind of relationship between accident frequency and ADT that is depicted in Figure 3
has been found repeatedly when data was examined (see, e.g., Roy Jorgensen Associates, p.18 or
Zegeer, Deen, et al. 1981 ). Other researchers (see, e.g.,Silyanov , Slatterly & Cleveland 1969 p.
312} report an upward curving relationship, implying that accident rate increases with ADT. Be it
as it may, when the accident rate decreases or increases with ADT and the feature of interest (here
lane width) is associated with ADT, one may not come to conclusions about the effect of that feature
on safety, without separating what part of the changein the accident rate is due to the ADT and what
part is due to the feature of interest.
One could perhaps try to argue that it is still unclear whether the relationship in Figure 3
(accident frequency versus ADT) is the primary one, explaining the curve in Figure 1 as an illusory
artifact, or whether the relationship in Figure 1 is the primary one, and is the main cause of the
curvilinear relationship in Figure 3. To settle this question I use the results recently obtained by
Stewart & Council for two-lane rural roads with 6 ft shoulders in North Carolina and Washington.
5. 0
1
2
3
4
5
Accidents/(mile-year)
0 5000 10000 15000 20000
Average Daily Traffic
Wa, 24 ft
Wa, 22
NC, 24 ft
NC, 22 ft
0
0.5
1
1.5
2
Accidents/(mile-year)
0 5000 10000 15000 20000
Average Daily Traffic
Wa, 24 ft
Wa, 22
NC, 24 ft
NC, 22 ft
1.5
C:workPROJECTSHSISIHSDM-MultilaneLiterature Reviews1. Lane widthlane width.wpd
Figure 5. Total accidents Figure 6. Injury Accidents
The model equation is of the form: Accidents/(mile-year)="(ADT) . The estimated parameter values
are given in Table 1 and the functions depicted in Figures 5 and 6.
Table 1
22 ft. travel way with 6 N=497 =0.0311 =0.4733
ft .shoulders North Carolina =0.083 =0.5408
Totla
Injury
Total
Injury
24 ft. travelway with 6 N=433 =0.0133 =0.5775
ft. Shoulders =0.0072 =0.5550
Total
Injury
Total
Injury
22 ft. travel way with 6 N=222 =0.000612 =0.919
ft .shoulders Washington =0.000112 =1.033
Total
Injury
Total
Injury
24 ft. travelway with 6 N=213 =0.00760 =0.607
ft. Shoulders =0.00331 =0.602
Total
Injury
Total
Injury
Since roadway width (and shoulder width) are constant for each curve, these cannot be
responsible for the non-linear form of the best fitting curve. It follows that the declining accident rate
noted in Figure 3 is probably not due to the association of roadway width with ADT. Also
noteworthy is that in Figures 5 and 6, the contribution of the wider roadway to safety is not clear cut.
Thus, e.g., if one is to believe the model equation, then, in North Carolina, 11 ft and 12 ft lane roads
have very nearly the same injury accident frequency for all ADTs. Surprisingly, for ADT5000, roads
with 12 ft lanes in North Carolina have somewhat more accidents than roads with 11 ft lanes. The
opposite seems to hold In Washington.
6. 1.6
C:workPROJECTSHSISIHSDM-MultilaneLiterature Reviews1. Lane widthlane width.wpd
The point of this section was to show that much of the early research, which relies on single-
variable tables and graphs of the relationship between the accident rate and roadway width (e.g.,
Figure 1) suffers from serious confounding. Roads with little traffic come with several traits that
affect their safety, only one of the traits is the lane width. The accident frequency on such roads
reflects the effect of all these traits, not only of lane width. When lane width is made to be the sole
independent variable, as in Figure 1, the apparent relationship is a mixture of the joint effect of all the
other traits that tend to go with narrowlanes - narrow shoulders, sharp curves, unforgiving roadside,
etc. In conclusion:
the tendency of accident rates to decline as lane width increases is not an indication of a
cause-effect relationship. The accident rate usually declines as ADT increases for a variety of
reasons. Narrow roads and lanes tend to be associated with low traffic and therefore with
higher accident rates.
Since ADT is a major determinant of road features, the safety effect of a feature can be
investigated only when ADT is held constant or its influence is otherwise accounted for.
3. Empirical evidence.
In this section I will attempt to review what empirical evidence exists in the literature. I will
do so without dwelling on those items which suffer from the one-variable-only confounding discussed
in section 2.
1953. Recognizing the complex interactions between the many variables, Raff (1953) examined
accident rates on two-lane tangents by volume of traffic, shoulder width and pavement width. He
concludes that “neither pavement width nor shoulder width nor any combination of them has a
determinable effect on the accident rates on two-lane tangents.”(p.29). This conclusion may reflect
the poor quality of the data available for analysis and the fact that data has been pooled for 15 states
with differing reporting requirements and reporting standards..
1954. One of the classical studies is by Belmont. Although the focus of the inquiry was on shoulder
width, the paper contains valuable evidence about the effect of lane width. The data pertains to rural
two-lane tangents, without structures or intersections, predominantly straight and level and with a
55 mph speed limit. Since techniques of analysis have improved in the interim, it seemed worthwhile
to embark on a re-analysis. The model accidents/mile-year=0.0006ADT was obtained by Poisson
1.003
7. 0
0.5
1
1.5
2
Ratio
+/-
one
standard
deviation
15 20 25 30
Pavement width [ft]
Least squares fit
1.7
C:workPROJECTSHSISIHSDM-MultilaneLiterature Reviews1. Lane widthlane width.wpd
Figure 7
regression. Using this model, the ratio (accident count)/(predicted accidents) has been computed for
various pavement widths and is shown by squaresin Figure 7. It varies mildly in the range of practical
lane width.
Including pavement width in the Poisson
regression I find:
a c c i d e n t s / ( m i l e - y e a r ) =
0.0019×ADT ×(1-34.04/PW
1.028
+383.4/PW )
2
in which PW is pavement width in ft. This
leads to the accident modification factors
(AMFs) in Table 2
Table 2. AMFs based on Belmont’s data.
Pavement Width in ft 18 20 22 24 26 28 30
AMF 1.21 1.05 1.00 1.01 1.06 1.13 1.21
The merit of Belmont’s data is that they pertain to fairly homogeneous road sections (straight, level,
no structures) and exclude intersection accidents.
1955. The earliest before-after study of pavement wideningis by Cope. The data are for 22 pavement
widening projects 244.3 miles long. In most cases, widening was from 18 to 22 feet. Accidents at
driveways, entrances and intersections were not included in the study. The dramatic reductions in
accident rates in Table 3 are reported.
Table 3. Before-After results by Cope
Accidents/MVM Number of projects Percent reduction in
Before accidents/MVM
1.5 2 21.5
1.5-1.9 6 25.2
2.0-2.4 7 34.4
2.5 7 46.6
8. 0
0.5
1
1.5
AMF
1 2 3 4
Accident rate (Before)
Sites which have a higher-than-average observed accident frequency in one time period
2
are expected to return to their average accident frequency in the next time period. This
spontaneous reduction in accident frequency is not a sign of safety improvement. If such a
spontaneous return to what is normal is claimed to be a safety improvement, a ‘regression-to-
mean’ bias is said to exist.
1.8
C:workPROJECTSHSISIHSDM-MultilaneLiterature Reviews1. Lane widthlane width.wpd
Figure 8
The statewide average ratefor this type of accident was 2.0. Thus one may suspect that a part of the
increase in effect with accident rate is a reflection of regression to the mean . That is, sections that
4
during the before period had unusually high accident rates may have been selected for widening and
therefore part of the apparent improvement is just a return to the true mean for these sections. It is
now impossible to know whether this conjecture is true. I re-analysed the data in the form presented
below. Each square represents one project. The abscissa is the accident modification factor obtained
in a project. In project ‘A’ accidents increased by some 20% (AMF=1.2) while in project ‘B’ they
decreased about 65% (AMF=0.35).
There is indeed an indication that when
the before accident rate was unusually
high the apparent reduction is very
large. Ascribing this to the regression-
to-mean bias, the unbiased effect
seems to be indicated by the dashed
line. Thus, for a widening from 18 to
22 ft the AMFM0.7. This is equivalent
to a 8% reduction per foot of lane
widening up to 22 ft. This finding is
consistent with Belmont’s except that
the effect is somewhat larger.
1957. The next data analysis is by Perkins who, whilst interested mainly in the safety effect of
shoulder width, also provided and analysed data on accidents, lane width and ADT for two- lane
rural highways in Connecticut. His conclusion was that:
“ there is no definite relationship of accident rates to shoulder width. The accident
rates vary . . . and do notin any casefollow a consistenttrend. The same is true of the
relationship of the accident rate to pavement width.”
9. 0
1
2
Accidents/MVM
9 10 11 12
Lane width [ft]
1.9
C:workPROJECTSHSISIHSDM-MultilaneLiterature Reviews1. Lane widthlane width.wpd
Figure 9
I re-analysed this data set as well and came to the same conclusion. That is, after accounting for the
effect of ADT, the ups and downs of the accident frequency are haphazard and there is no apparent
relationship to either pavement or shoulder width. This may reflect poor data quality or the absence
of a relationship. Note that, unlike Belmont, Perkins did not take care to eliminate intersection
accidents from the data, nor to control for horizontal curvature, presence of structures etc. It is
therefore not surprising that no relationship with lane of shoulder width can be discerned.
1959. In this study Head extended his Oregon inquiries about the effect of shoulders to ‘urban
extensions of the highway system’. Of a total of 466 urban highway sections, 426 (186.4 miles)
permitted parallel parking and these were used as data. Accident records were for two years.
When examining correlation with accident rate, Head finds that “pavement width showed positive
correlations with accident rates. However, ....was normally fairly low. . . .The effective lane width
was generally positively correlated, howevr, there were frequent negative correlations ...”
The regressions were linear. Separate equations were estimated 2-lane and 4-lane in several ADT
categories and settings (urban, suburban, corporate, business, residential, mixed,...). Pavement width
(PA) has a positive regression coefficient in 11 equations, negative in 8 and is not included in 12. It
seems that if lane width has a n effect on safety, it has not been clarified by this work.
1970. Figure 9 is based on data in Dart and Mann. Since this is a one-variable-at-a-time
presentation, it is of little interest except for the slight increase in accident rate from 11 ft to 12 ft
lanes. Such an increase is difficult to reconcile with the argument in Section 2 and the shape of the
ADT vs. accident frequency relationship in Figure 3. That is, if the accident rate is declining as ADT
increases, and if roads with more traffic tend to have wider lanes, then one should see in a figure such
as 9 a monotonous decline in accident rate. Since
we see an increase at the right tail, this may be an
indication of a dis-benefit that goes with lanes
wider than 11 ft. This too is consistent with
Belmont’s findings and lends them more credibility.
Recognizing the multivariate nature of the
problem, Dart and Mann (1970) estimate a
regression model for accident rates. This being an
early attempt, the model suffers from many
10. 1.10
C:workPROJECTSHSISIHSDM-MultilaneLiterature Reviews1. Lane widthlane width.wpd
shortcomings and the results can hardly be trusted. (Thus, e.g., the average accident rate is estimated
as 0.29 accidents/MVM when it should be around 2). In any case, the model implies that an increase
of lane width by 1 ft is associated with a decrease of the accident rate by 3.5%.
1973, 1975. Silyanov and Babkov show graphs similar to Figure 1 and Figure 8 on which they
compile data by many researchers from various countries (USSR, UK, Sweden, Germany, Hungary,
USA). They all form a band as in Figure 1, showing declining accident rates with roadway width. As
far as I can tell, the method of all these studies is the same as that discussed in Section 2. That is,
accident rates were computed for road sections having the same roadway width. The association
between ADT and roadways width has not been accounted for. This means that the results are
confounded and one cannot say whatis due to roadway width and what is due to all the other factors
which vary with ADT. The noted decline in rates may be caused by the many factors that are
associated with traffic flow. Drawing a bold curve through the diverse results by many researchers,
Babkov (1975) gives the numbers in Table 4.
Table 4. Relative Accident Rate by Babkov (1975).
Roadway width [m] 4.5 5.0 5.5 6.0 6.5 7.0 7.5 8.0 9.0
Roadway width [ft] 15.0 16.7 18.3 20.0 21.7 23.3 25.0 26.7 30.0
Relative Accident rate 2.2 1.7 1.4 1.3 1.1 1.05 1.0 0.9 0.8
1978. An elaborate regression analysis was performed by Roy Jorgensen Associates . Based on data
from Maryland, New York and Washington,initially 36linear regression models were fitted in 4 ADT
categories × 3 categories of horizontal curvature × 3 categories of shoulder type. Terrain, pavement
width and shoulder width were the independent variables. The model was found to explain little. The
authors comments that: “. . . this approach was not adequate. Changes in sign of the regression
coefficients were commonplace, indicating that the model was not explaining the true physical
relationship between accident rate and highway geometrics,if one existed. These findings indicate that
straight lines do not effectively explain how accident rates vary . . . (with) shoulder and pavemen t
width or across ADT levels ” p.13. Thus, abandoning the linear regression model fitting idea, th e
authors resolved to estimate a multiplicative model for accident modification factors. The result is
shown in Table 5.
11. 1.11
C:workPROJECTSHSISIHSDM-MultilaneLiterature Reviews1. Lane widthlane width.wpd
Table 5. Accident Modification Factors for rural two-lane highways based on
combined and smoothed accident rates in Maryland and Washington (p.18).
Pavement width [ft]
Shoulder 18 19-20 21-22 23
width [ft]
1-2 1.76 1.55 1.41 1.57
3-4 1.44 1.27 1.15 1.29
5-6 1.27 1.13 1.02 1.14
7-8 1.14 1.00 0.91 1.02
9 1.11 0.99 0.90 1.00
The authors note that the increase from the 21-22 ft category to the 23 ft group is “inconsistent with
the expectation” but also emphasize that “it is consistent with the research findings”(p. 20.) In spite
of this, they decided to join the two rightmost columns into one width categories saying that “This
has the effect of conservatism in estimating the geometric effects on safety”. McLean ,( p.192)
questions this decision and maintains that while the increase in accident rates from the 21-22 ft
category to the 23ft category “. . . may have been anomalous in terms of conventional engineering
expectations, they are consistent with the general hypothesis of an interaction between driver
behaviour and geometric standard.”. The questionable reasoning in Roy Jorgensen and Associates
(1978) resulted in the oft-quoted AMFs from their Table 13 and reproduced in row 2 of Table 6 as
AMF (modified). Were the unmodified data used the result would be that in Table 7.
Table 6. Modified AMFs
Pavement Width in feet 18 or less 20 22 24
AMF (modified) 1.18 1.04 1.00 1.00
Table 7. Unmodified AMFs
Pavement Width in feet 18 or less 19-20 21-22 23
AMF (unmodified) 1.25 1.10 1.00 1.11
Note that the unmodified results are a more pronounced version of the re-analysis of Belmont’s data
and indicate that for rural two-lane roads, pavement widening beyond a certain point (21 to 22 ft) is
detrimental to safety.
12. 0
0.5
1
1.5
2
Run-Off-The-Road
Accidents/MVM
0 2000 4000 6000 8000 10000
Average ADT
18-20 ft.
22-24 ft.
0
0.5
1
1.5
2
Opposite
Direction
Accidents/MVM
0 2000 4000 6000 8000 10000
Average ADT
18-20
22-24
ft.
14-16
ft.
1.12
C:workPROJECTSHSISIHSDM-MultilaneLiterature Reviews1. Lane widthlane width.wpd
Figure 10 Figure 11
1980, 1981. Zegeer et al. merged data for about 17,000 accidents (in Kentucky) with highway
section data for 25,670 km of road. The authors focussed on run-off-the-road and opposite-direction
accidents (apparently excluding rear-end, intersection and driveway related accidents as unrelated to
the issue of lane or shoulder width). The large majority of roads (70%) had no shoulders. The main
results are shown in Figures 10 and 11.
If one may assume that in the regions of overlapping ADT the compared road sections have similar
traits except for lane width, the results indicate that increased lane width is associated with very
substantive accident reductionsin ‘run-off-the road’ and ‘opposite direction’ accidents. The average
increase in run-off-the-road accidents is by a factor of 1.12 per foot decrease in pavement width.
Thus, 18' pavements may be expected to have 1.12 =1.57 time more run-off-the-road accidents than
4
22' wide pavements. The averageincrease in ‘opposite-direction’ accidents is by a factor of 1.21 per
foot of decrease in pavement width. The pavement width groupings in this report do not allow one
to judge whether accident frequency increases as pavements width grows beyond 23 or 24 feet.
These results indicate amuch larger effect of pavement width than earlier studies. However,
one must remember that earlier studies estimated the effect on all accidents whereas in this study the
effect on two accident types was estimated. The relevant proportions are shown below.
13. 0
1
2
3
4
5
Accidents/MVM
7 8 9 10 11 12
Lane width [ft.]
No Shoulder
1'-3'
4'-6'
7'-9'
10'-12'
1.13
C:workPROJECTSHSISIHSDM-MultilaneLiterature Reviews1. Lane widthlane width.wpd
Figure 12
Table 8. Proportions of accidents by type.
Run-off-road 0.45
Opposite Direction 0.16
Other 0.39
Total 1.00
The authors note that: “Accident ratesfor other accidents generally increased as lane width increased,
indicating that the only accidents which would be expected to decrease with lane widening were the
run-off-the-road and opposite-direction accidents.” (1980, p.4). Of course, if one assumes that lane
widening reduces some accident types, one must be willing to accept that other accident types are
increased by lane widening (perhaps due to increased speed). It is the joint effect on all accident types
which ought to be of interest. Since thisjoint effectis not estimated here, one may only conclude that
it is lesser than what has been estimated in this study and may be in line with the results obtained in
the earlier studies.
The authors also show how accident rates vary with shoulder and lane width (Figure 12)
It is interesting to note that here, as on many previous occasions, there is an upturn in the accident
rate after a width of about 11 feet. Of course, as noted in section 1, not much credence should be
given to representations that do not account for the possible non-linearity in the effect of ADT on
accident frequency. Comparing accident rates in overlapping bands of ADT as in Figure 10 and 11
14. 1.14
C:workPROJECTSHSISIHSDM-MultilaneLiterature Reviews1. Lane widthlane width.wpd
is much more convincing. ADT alone may not sufficiently account for differences in roadside hazard,
horizontal curvature, terrain etc.
1982. McBean studied the prevalence of selected geometric features at sites where an accident has
occurred and nearby sites subject to the same traffic and other influences. There were 197 site-pairs.
As is shown in Table 9 (his Table 13), 95 control sites but 121 accident sites had a carriageway width
wider than 6 m. Were carriageway width unrelated to accident occurrence, one would expect to find
both numbers to be approximately the same. Thus the finding is that accident sites tended to have a
wider carriageway
Table 9. Number of accident and control sites by carriageway width.
Accident sites
6 m or less wider than 6 m
Control 6 m or less 60 42
sites wider than 6 m 16 79
Thus, while 121 accident sites had a carriageway width wider than 6 m, only 95 control sites did.
This association persisted even when sites on curves were eliminated.
1983. Heimbach et al. use data for 57 sections of four-lane undivided urban highways with
intersections more than 2000 feet apart in eight urbanized areas in North Carolina. A total of 1936
accidents was used to develop multivariate linear regression models. In these, accident frequency is
related to ADT, intersection density, access density, lane width and alignment change magnitude. The
authors conclude that as lane width increases accidents decrease. While the regression equations are
complex, in an illustrative example the authors show that decreasing the total lane width from 48 ft.
to 40 ft. increases the number of accidents by a factor of 1.25. This is in line with the examination of
Heimbach’s results by McLean (1997) who estimates that thereis a reduction of 2%-2.5% in accident
rate for an increase of 0.25 m in lane width.
1986. Harwood assembled a data base intended to study the effect of cross section design on
multilane suburban highways. He finds that the accident rate depends on the proportion of truck
traffic, type of development, shoulder width, driveway and intersection density. He concludes that
the effect of ADT,lane width, left-turn demand and speed are not statistically significant. This does
15. 0.02
0.04
0.06
0.08
0.1
0.12
0.14
0.16
acc./mile-year
18 20 22 24 26 28
pavement width
0ADT400
0.05
0.1
0.15
0.2
0.25
0.3
0.35
0.4
acc./mile-year
18 20 22 24 26 28
pavement width
400ADT700
0.1
0.2
0.3
0.4
0.5
0.6
0.7
0.8
acc./mile-year
18 20 22 24 26 28
pavement width
700ADT1000
0
0.1
0.2
0.3
0.4
0.5
0.6
0.7
acc./mile-year
18 20 22 24 26 28
pavement width
1000ADT1500
1.15
C:workPROJECTSHSISIHSDM-MultilaneLiterature Reviews1. Lane widthlane width.wpd
not mean that the effect does not exist, only that with the available data and modelling strategy it
could not be identified.
1987 a. Griffin and Mak examined the benefits that could be achieved by widening rural two-lane
farm-to-market roads in Texas. The data pertains to 36,215 miles of such road in 1985. The bulk of
the data was for roads 18, 20, 22, 24, 26 and 28 ft. wide. Safety was measured in accidents (either
single-vehicle or multi-vehicle) per mile-year in four ADT categories (0-400, 400-700, 700-1000 and
1000-1500). The results are shown in Figures 12-19 in which the estimates (shown as squares) are
bracketed by one standard deviation (shown by triangles).
Figures 13-16. Single-Vehicle Accidents.
16. 0
0.02
0.04
0.06
0.08
0.1
0.12
0.14
acc./mile-year
18 20 22 24 26 28
pavement width
0ADT400
0.02
0.04
0.06
0.08
0.1
0.12
0.14
0.16
acc./mile-year
18 20 22 24 26 28
pavement width
400ADT700
0
0.1
0.2
0.3
0.4
0.5
0.6
acc./mile-year
18 20 22 24 26 28
pavement width
1000ADT1500
0.1
0.15
0.2
0.25
0.3
0.35
0.4
0.45
acc./mile-year
18 20 22 24 26 28
pavement width
700ADT1000
1.16
C:workPROJECTSHSISIHSDM-MultilaneLiterature Reviews1. Lane widthlane width.wpd
Figures 16-19. Multi-Vehicle Accidents.
The emergingpicture is far from clear. The erraticjumps are explainable partly by the imprecision that
is due to limitations of sample size. Attempts to fit a curve to the data met with limited success. On
the whole, the authors conclude that “Surface width has no demonstrable effect on multi-vehicle
accident rate on rural, two-lane farm to market roads with ADT’s up to 1,500 (which are about 33%
of the total) and that “surface widening can reduce single vehicle accident rate ...” (single vehicle
accidents are about 67% of the total in this data).
1987.b. Zegeer and Deacon use data from Kentucky (Zegeer, Deen, et al. 1980) and from Ohio
(Foody Long ) to provide the best estimate then available. After making a series of assumptions
they find:
17. 1.17
C:workPROJECTSHSISIHSDM-MultilaneLiterature Reviews1. Lane widthlane width.wpd
(Number of Run-Off-Road + Opposite Direction Accidents)/MVM=4.1501×0,8907W
×0.9562 ×1.0026 ×0.9403 ×1.0040W
S W×S P L×P
in which W is Lane width in feet, S shoulder width and P is the width of the stabilized component of
the shoulder.
Because of the several judgement-based ‘correction factors’ the equation is not the result of a curve
fit in the usual sense but a judgement-composite of several data sets and research results. The authors
state that: “Because of the many assumptions necessary . . ., this model is not considered to be a
precise representation of the effects of lane and shoulder conditions on accident rates . . .”.(p.20).
This agglomeration of assumptions was necessary in order to come up with some guidance for TRB
Special Report 214 ( Designing Safer Roads, 1987). In spite of the speculative nature of this model
and its lack of representation of the data on which it is based, it has had a substantive influence on
practice.
1987 c. Zegeer et al. (1987) conducted a major study intended to quantify the benefits of lane
widening, shoulder widening, sideslope flattening etc.. Accident, traffic, roadway and roadside data
was collected on 1,944 road sections covering 4,951 miles of two-lane roads in seven states and
62,676 accidents. The main product of this work is a number of multivariate models. The models of
interest here are:
Total Accidents/(mile-year)=0.0015×ADT ×0.8897 ×0.9403 ×0.9602 ×1.2
0.9711 W PA UP H
Relevant Accidents/(mile-year)=0.0019×ADT ×0.8786 ×0.9192 ×0.9316 ×
0.8824 W PA UP
1.2365 ×0.8822 × 1.3221
H T1 T2
in which
ADT is the average daily traffic, W is the lane width in feet, PA is the average width
of the paved shoulderin feet, UP is the average width of the unpaved shoulder, H is
the median or roadside hazard rating(1 to 7), T1 is 1 if the terrain is flat and 0
otherwise, T2 is 1 if the terrain is mountainous and 0 otherwise, and ‘relevant’ are
single-vehicle+opposite direction head-on+opposite direction sideswipe+same
direction sideswipe accidents.
18. 1.18
C:workPROJECTSHSISIHSDM-MultilaneLiterature Reviews1. Lane widthlane width.wpd
If these relationship can be taken to represent cause and effect, then, changing lane width from
W1 to W2 means that the frequency accidents is expected to change be a factor of 0.8897 . To
W2-W1
illustrate, if on a stretch of road with 11 ft lanes ,10 accidents/year are expected, then with 12 foot
lanes 10×0.8897 =8.9 accidents/year would be expected. The same (11% reduction) would obtain
1
by going from 12 to 13 foot lanes or by going from 13 to 14 foot lanes. Much of the eralier evidence
indicates that the benefit of lane widening tapers off as lanes get wider and perhaps at certain width
further increase is detrimental to safety. The contrary result in the equations above comes not from
the data, but from the choice of the model equation. The function used (constant ) can never
W
represent a relationship that becomes flat at a certain lane width and begins to turn up.
As a rule, multivariate models of this kind cannot be trusted to represent cause-and-effect.
They only reflect the various co-variations that are present in the data used. In this case, data have
been pooled from 7 states without accounting for differences between them. Yet major differences
have been found between their accident rates, perhaps due to differences in accident reporting. If the
states differ in some systematic way in their lane-width inventory, then what is attributed here to lane
width may in fact be a reflection of differences in accident reporting. Similarly, while lane width is
correlated with average curvature (r=-0.36) and driveway density (r=-0.296), these variables do not
show up in the equations. Thus, since wider lanes are associated with less curvy roads and fewer
driveways, the safety benefit attributed to wider lanes may be a reflection of less curvy roads or
fewer driveways.
1991. Goldstine analysed data from 25 projects on 152 miles of two-lane rural roads in New
Mexico. The thrust of the paper is to compare accident rates before and after roadway widening
based usually on 2years of accident data before and after construction. The accident rate was found
to be markedly reduced. The possibility of regression to the mean has not been considered. It is
difficult to know how much of the reduction is due to lane widening, how much due to shoulder
paving and how much due to other improvements (many projects had changes in sideslopes and in
vertical curvature).
1990. Harwood examined whether narrower lanes on urban arterials affect safety adversely. Data
were availablefor 35 (27miles) projectsinvolving narrowing of lanes. All involved changes in cross-
section where lanes were added. Therefore,it was not possi ble to isolate the effect of narrower lanes
from changes such as the introduction of TWLTL or the removal of a median.
Where a two-lane undivided road was converted to a four-lane undivided road, there was a large
increase in accidents. But the increase was at intersections and driveways and had little to do with
19. 1.8
2
2.2
2.4
2.6
2.8
3
Related
accidents/MVM
15 20 25 30 35 40 45
Width of lanes + shoulders [ft]
1.19
C:workPROJECTSHSISIHSDM-MultilaneLiterature Reviews1. Lane widthlane width.wpd
Figure 21
lane width. Where a five lane (with TWLTL) cross-section was made into a seven lane (with
TWLTL) cross-section both mid-block and intersection accident rates increase (20-30%). Where a
six-lane divided road was made into an eight-lane divided road accident rate increased at intersections
but not mid-block.
1994 a. Zegeer et al. examined the effect of lane and shoulder width on low volume roads carrying
fewer than 2000 vehicles per day. The ‘primary’ database entailed 4,137 miles of road in seven states.
An additional ‘cross-section data’ base from three states was used to validate the results.
As in Zegeer et al. (1980, 1981), only single-vehicle and opposite-direction accidents were
considered ‘relevant’. The authors state that: “Rates for other accident types were found not to be
significantly related to lane or shoulder width.” (p.163). This seems contrary to the earlier quote
(“Accident rates for other accidents generally increased as lane width increased, indicating that the
only accidents which would be expected to decrease with lane widening were the run-ff-the-road and
opposite-direction accidents.”1980, p.4). The ‘relevant’ accidents are 63% of the primary data base
and only 39% of the cross-section data base. If the remaining 37%-61% accidents tend to become
more numerous as lane width increases, they should not be omitted from the analysis.
Surprisingly, the method of analysis chosen was to examine how accident rates vary with lane
and shoulder width, without accounting for the possibility of non-linear effect of traffic flow (but
adjusting for roadside hazard, terrain, State, and driveway density). Thus, the results may be subject
to the confounding discussed in Section 2. That is, an undetermined part of the decline in accident
rate with lane+shoulder width may be
due to the non-linear relationship
between accident frequency and ADT.
The main results are shown in Figure
21 .
20. 1.20
C:workPROJECTSHSISIHSDM-MultilaneLiterature Reviews1. Lane widthlane width.wpd
An attempt has been made to examine the surprisingly low accident rate for pavement width of 18
ft. or less by examining new data from Illinois, Minnesota and North Carolina as shown in Table 9.
Table 9. ‘Related’ Accidents/MVM.
Lane width [ft] 8 9 10 11 12
Illinois 3.57 1.13 2.03
Minnesota 2.32 0.85 1.03 0.67
North Carolina 1.95 1.94 1.73 1.69
One may expect that the true relationship between safety and lane width is smooth and gradual. Thus,
e.g., it would be most perplexing if in Illinois 9 ft lane width was associated with a third of the
accidents for 8 ft lanes but twice as many as for10 ft. lanes. The accident rate jumps in Figure 21 and
in Table 9 make it difficult to distinguish between what is signal and what is noise. In general, jumps
of this kind may be an indication of:
a. Insufficient data, so that some estimates have a large standard error;
b. Poor data quality;
c. Presence of co-variation with other variable that are not represented in the analysis or
considered incorrectly.
If the general trend in Figure 21 is a reflection of the safety effect of lane+shoulder width, then one
might conclude that increasing this width by 1 foot is associated with a 1.5% decrease in the rate of
‘related’ accidents. This is much less than what has ben found in all earlier studies. The ‘related’
accidents (single vehicle and opposite direction) are 37%-61% of all accidents.
The author also haveimportant data (Table 9) to shed light on the question whether lanes wider than
11 of 12 feet are safer.
21. 1.21
C:workPROJECTSHSISIHSDM-MultilaneLiterature Reviews1. Lane widthlane width.wpd
Illinois Minnesota
11 12 11 12
Shoulders [ft.] 0-2 3 0-2 3 0-2 3 0-2 3
Related accidents/MVM 1.12 0.88 0.84 0.85 0.67 0.61 0.72 0.52
Table 9
The authors conclude that “littleif any rea l accident benefit can be gained from increasing lane width
from 3.4 m (11 ft.) To 3.7 m (12 ft.) On low volume roads.”
1994 b. Urbanik discusses the experience gained in narrowing lanes and shoulders on urban
freeways. Based on work reported in (McCasland and Urbanik Bonilla) they maintain that
following the implementation of 24 projects (in which capacity was increased by adding a new lane
at the expenseof shoulder and lane width) “... most sites experienced decreased accident rates after
the projects were implemented ...”(p. 126). They also note that “narrowing of lanes to 11 feet (or
occasionally 10.5 feet) while maintaining shoulders did not change accident rates.” Based on the
review of several projects in California the authors note that: “. . . higher accident rates had not
materialized several years after lanes were narrowed and left shoulders were removed . . .”. They also
claim that “accident migration is not a problem on well designed projects”.
1995 a. Zegeer and Council review (briefly) what is known about the safety effects of cross-section
elements. No new data is analysed. On the effect of lane width the recommend to rely on the findings
by Zegeer et al. (1987).
1995 b. Hadi et al used four years of Florida crash data to estimate NB models for nine road classes.
The function e has been chosen to represent the influence of lane width. The following
×Lane width
values of $ were obtained.
22. 0
100
200
300
Acc./100-MVM
Altered
segment
0 100 200 300
Acc./100-MVM Unalrered segment
1.22
C:workPROJECTSHSISIHSDM-MultilaneLiterature Reviews1. Lane widthlane width.wpd
Figure 22
Table 10. Regression coefficients for Lane Width and Pavement Width, Mid-block crashes.
Lane width Pavement width
Two-lane, rural -0.0857
Four-lane, rural, divided Not included Not included
Four and six-lane rural freeways Not included Not included
two-lane, urban, -0.355
four-lane, urban, undivided -0.1127
four-lane, urban, divided Not included Not included
six-lane, urban, divided Not included Not included
four-lane, urban, freeway -0.3909
six-lane, urban freeway -0.3504
Whether lane width was included amongst the regressor variables has been decided in the stepwise
regression by the Akaike information criterion. Thus, the non-inclusion of lane width in certain
models merely indicates that it was deemed statistically insufficiently important. The functional form
used forces the conclusion that crash frequency decreases with lane width no matter how wide the
lane. The implied reduction in crash frequence per foot increase in width (e.g., 39% on four-lane
urban freeways) seems quite excessive.
For some cases the authorsgive the lanewidth category that minimizes crashes. For two-lane
rural roads =4 m; four-lane, rural divided=3.0-3.7 m; two-lane, urban 3.7 m; four-lane urban,
undivided=4.0 m; four-lane, urban, divided= 3.0 m; four-lane, urban, freeway= 4.0 m.
1995 c. Curren examined the safety consequences of
increasing freeway capacity by use of shoulders and
narrow lanes. Accident data were for 3-3.5 year for
corridors I-95, I-395, I-5, I-90, I-85 and I-10 in Virginia,
Washington, Georgia and California. A total of 12795
accidents was used on 49.49 altered miles and 35.03
unaltered miles on the same corridor. The comparison
of accident rate for ‘altered’ and ‘unaltered’ segments is
shown in Figure 22.
23. 1.23
C:workPROJECTSHSISIHSDM-MultilaneLiterature Reviews1. Lane widthlane width.wpd
Treated Comparison
Before 86 89
After 122 75
Table 10. Suburban Freeway
Treated Comparison
Before 257 206
After 287 183
Table 11. Urban Freeway
As is obvious, different freeways segments have very different accident rates Ranging from 80 to
280). The idea that one can learn something form comparing altered and unaltered segments rests
on the expectation that the compared segments (Altered and Unaltered) should have the same
accident rate. This expectation is not well founded.
One segment (I-5) provided the opportunity to do a Before/After comparison.
It seems that where shoulders and narrow lanes were used that accident rate increased by a factor of
1.68 (suburban freeway) and 1.26 (urban freeway).
1995 c Miaou used datafrom Utah for 11539 two-lane rural undivided road sections and 6680 single
vehicle accidents for eight years to estimate a multivariate model. The effect of lane width was not
statistically significant, most likely because 96.5% of the road sections had 12 ft. lanes.
1996 a. In a synthesis of Australian and international experience for rural roads McLean also relies
mainly on results by Zegeer et al (1987) as being “the most comprehensive of the studies and
(therefore) should be regarded as the benchmark against which others are compared”(p.9).
1996 b. Miaou used data on 596 two-lane rural road sectionsin Alabama, Michigan and Washington
to model the relationship between 4632 single vehicle accidents in 1980-84 and various geometric
and traffic traits. He finds that increasing lane width by one foot decreases the number of single
vehicle run-of-the-road accidents by 14%.
1996 c. Miaou used the data originally analysed by Zegeer et al. in 1987. Of the 1944 sections
originally used a subset of 1282 pure rural sections was selected. With 29,262 accidents. The
covariates used were: dummy variable for ‘State’ AADT/lane, Lane width, Shoulder width, roadside
recovery distance, horizontal curvature, terrain type, vertical grade, sideslope, intersections/mile,
driveways/mile, bridges/mile, RHR. The regression coefficient is $ =-0.078. Thus increasing
lane width
lane width by ) ft. Has an AMF=e .
-0.078
24. 1
1.2
1.4
1.6
Accident
Modification
Function
0 500 1000 1500 2000 2500 3000
Average Daily Traffic
Run-Off-road and Opposite Direction
1.50; 9 ft.
1.30; 10 ft.
1.15; 11 ft.
1.00; 12 ft.
1.05
1.02 1.01
1.24
C:workPROJECTSHSISIHSDM-MultilaneLiterature Reviews1. Lane widthlane width.wpd
Figure 23
1997. In September 1997 a group of experts met in Washington for a few days with the purpose of
reaching consensus on the accidentmodification factors needed as input for the Interactive Highway
Safety Design Model (IHSDM). The results of this deliberation are shown in Figure 22. Thus, the
effect on single-vehicle and opposite direction accidents is minimal for ADT400 and increases
linearly up to the limiting values shown. Because of the results obtained by Zegeer et al. (1994) the
panel thought that the widening of 9 ft lanes to 10 ft. is undesirable.
The assumption is that only run-off-road and opposite direction accidents are affected by lane
widening. The proportion of such accidents depends on ADT. If the information in Figure 22 is to
be applied to total accidents an appropriate correction needs to be applied. Thus, e.g., if half of the
accidents are of the run-off-road and opposite direction accidents type, the AMF in figure 22 needs
to be halved.
1998 a. Wang et al. examined the influence of cross-section elements on the safety of rural, multi-
lane, non-freeway roads using HSIS and photolog data from Minnesota. Although data about
number of lanes and road surface width were available, the estimated model does not include these
variables; presumably they did not reach a desired level of statistical significance.
1998 b. Stewart and Council fitted simple models to data from North Carolina and Washington for
rural two-lane and four-lane roads.
A. Two-lane roads NC.
When separate models were fitted to data with 22 and 24 ft pavement width (keeping shoulder width
at 6 ft.), then for ADT
5000 the wider pavement was safer and for ADT5000 the narrower
25. 1.25
C:workPROJECTSHSISIHSDM-MultilaneLiterature Reviews1. Lane widthlane width.wpd
Driveways
/km
To
0.1 5 10 15 20 25 30
From
0.1 1.00 1.05 1.11 1.16 1.23 1.29 1.36
5 0.95 1.00 1.05 1.11 1.17 1.23 1.29
10 0.90 0.95 1.00 1.05 1.11 1.17 1.23
15 0.86 0.90 0.95 1.00 1.05 1.11 1.17
20 0.82 0.86 0.90 0.95 1.00 1.05 1.11
25 0.78 0.82 0.86 0.90 0.95 1.00 1.05
30 0.74 0.77 0.82 0.86 0.90 0.95 1.00
Table 12. AMFs for ADT=10,000
pavement was safer. However, up to ADT8000, there waslittle difference between the two. When
a single model was fitted to data (surface width 20-24 ft., shoulder width 4-10ft) $ =-0.037
surface width
and $ =-0.037 were obtained. For injury accidents $ =-0.042 and $ =-0.048
shoulder width surface width shoulder width
were obtained.
B. Four-lane rural, non-freeways NC.
For one class of undivided highways surface width were in the 44-52 ft. Range with shoulders from
4-12 ft. The regression parameters for surface and shoulder width were not statistically significant.
For another class (with curbs) surface wifth ranged from 60 to 68 ft. No comment about the effect
of surface width has been made.
C. Two-lane roads WA.
When separate models were fitted to data with 22 and 24 ft. pavement width (keeping shoulders at
6 ft.) There is again a crossover as in NC, but in the opposite direction. The two curves are quite
dissimilar for higher ADT values. When a single model was fitted to the data $ was 0.000.
suface width
(The effect of shoulder width was now suspiciously large).
D. Four-lane rural, Non-freeway, WA.
For undivided roads neither shoulder nor surface width were found to have statistically significant
regression parameters. For divided roads there was no variation in surface width.
1998c. Vogt and Bared used data from Minnesota (704.5 miles, 1694 accidents in three years) and
Washington (535 miles,1706 accidents in three years) to estimate models for rural two-lane roads.
The models account for ADT, roadway width, Roadside Hazard rating, driveway density , average
horizontal curvature, average vertical curvature and average grade. The resulting regression
26. 1.26
C:workPROJECTSHSISIHSDM-MultilaneLiterature Reviews1. Lane widthlane width.wpd
Two-lane Four-lane, Undivided Four-lane, Divided
North Carolina 4900 325 insufficient data
Washington 1796 67 insufficient data
Minnesota 4370 414 insufficient data
California 3747 279 110
Table 13. Miles of road in sample.
0 1 2 3
North Carolina 2-lane -2.9915 0.6725 -0.123 -0.1506
4-lane,divided -4.6914 0.7615 -0.2877
Washington 2-lane -6.2152 0.9669 -0.4541
4-lane,divided -4.5387 0.6355
Minnesota 2-lane -8.1823 1.1758 -0.2949
4-lane,divided -7.2548 1.0644 -0.2339
California 2-lane -3.0188 0.9048 -0.3419 -0.4167
4-lane,divided -8.9871 1.0707
4-lane,
undivided
-8.7176 1.1213
Table 14. Parameter estimates.
coefficients for lane width when data from bath states was combined was $ =-0.085. Thus an
lane width
increase of lane with by ) ft. Gives an AMF of e- .
0.085
1999. Council and Stewart developed models to predict crashes/km-year for typical two-lane, four-
lane undivided and four-lane divided roads. Data from California, Washington, Michigan and North
Carolina served for analysis. The available miles of road by state and road type is in Table 13.
Only non-intersection and non-intersection-related crashes were used in the comparison. The model
was of the form: crashes/km=Length×e ×ADT ×e ×e . The parameter
0 1 2×shoulder width 3×Surface width
estimates are in Table 14.
The parameter for surface width was statistically significant only for two-lane roads and only in two
of the four states. In North Carolina widening the surface width by 1 m reduces crashes by 15%, in
California by 41%.
27. 1.27
C:workPROJECTSHSISIHSDM-MultilaneLiterature Reviews1. Lane widthlane width.wpd
4. Summary
1. A great deal of empirical evidence has been accumulated over several decades. The bulk of
it pertains to two-lane rural roads. Little is known about the effect of lane width on multilane roads
or urban roads.
2. When road sections differ in lane width they tend to differ also in other important respects.
This makes the isolation of the safety effect of lane width difficult.
3. In spite of this difficulty, there is a great deal of congruence between the results. Thus, the
AMFs obtained by Belmont (1954), Cope (1955), Roy Jorgensen (1978), Zegeer et al. (1987) and
Miaou (1996) are very similar when brought to the common denominator of ‘all accidents’.
4. There is, however, one issue on which opinions differ. Most early researchers found that the
safety benefit of lane widening bottoms out somewhere between 11 ft. and 12 ft. Further widening
seemed to be to the detriment of safety. Later researchers, using perhaps better data and methods of
analysis, unfortunately choose to use in their models a functional form that can never reach a
‘bottom’. Nor is there any evidence in their work that before choosing this functional form they
examined whether their data indicated an increase for wide lanes. For this reason, in my opinion, the
weight of the extant empirical evidenceindicates that there is little safety benefit to be obtained from
widening lanes beyond 11 ft and that widening beyond 12 ft may be to the detriment of safety.
5. There is some empirical evidence about the safety effect of reducing lane width on urban
arterials and freeways when the aim is to add a lane to increase capacity. This evidence is difficult to
interpret in terms of the safety effect of lane width because when a lane is added (even when no other
changes are made) the flow/lane is significantly changed.
References.
(1965). Research on road traffic. Her Majesty's Stationary Office, London.
(1987). Relationship between safety and key highway features. 6. State of the Art Report, Transportation research
Board, Washington D.C.
Babkov, V. F. (1975). Road conditions and traffic safety. Mir, Moscow.
Belmont.D.M.,(1954), Effect of shoulder width on accidents on two-lane tangents. Highway Research Bulletin. 91,
29-32.
Council, F. and Stewart, J. R. (2000) Safety effects of the conversion of two-lane rural to four-lane rural roadways based
on cross-sectional models. Transportation Research Board Annual Meeting.
Cope, A. J.,(1955), Traffic accident experience - before and after pavement widening. Traffic Engineering. 114-115
28. 1.28
C:workPROJECTSHSISIHSDM-MultilaneLiterature Reviews1. Lane widthlane width.wpd
Curren, J. E.,(1995). Use of shoulders and narrow lanes to increase freeway capacity. 369. National Cooperative
Highway Research Program, AASHTO, Washington, D.C.
Dart, K. O. and Mann, L., Jr.,(1970), Relationship of rural highway geometry to accident rates in Louisiana. Highway
Research Record. 313, 1-15
Foody, T. J. and Long, M. D.,(1974). The identification of relationships between safety and roadway obstructions.
Ohio-DOT-06-74. Ohio Department of Transportation, Columbus, Ohio.
Goldstine, R.,(1991), Influence of road width on accident rates by traffic volume. Transportation Research
Record. 1318, 64-69
Griffin, L. I. III and Mak, K. K.,(1987). The Benefits to be achieved from widening rural, two-lane farm-to-market
roads in Texas. 67- th Annual Meeting of the Transportation Research Board, 1988. The Texas State Department of
Highways and Public Transportation, Texas.
Hadi, M.A., Aruldhas, J., Chow, L-F, Wattleworth, J.A., (1995) Estimating safety effects of cross-section design for
various highway types using negative binomial regression, Transportation Research Record 1500, 169-177,
Washington, D.C.
Harwood, D. W.,(1986). Multilane design alternatives for improving suburban highways. 282. National Cooperative
Highway Research Program, Washington, D.C.
Harwood, D. W.,(1990). Effective utilization of street width on urban arterials. 330. National Cooperative Highway
research Program, Washington, D.C.
Head, J. A.,(1959), Predicting traffioc accidents from roadway elements on urban extensions of state highways.
Highway Research Board Bulletin. 208, 45-63
Heimbach, C. L., Cribbins, P. A., and Chang, M-S,(1983), Some partial consequences of reduced traffic lane widths
on urban arterials. Transportation Research Record. 923, 69-72
McBean, P. A.,(1982). The influence of road geometry at a sample of accident sites. 1053. TRRL Laboratory Report,
Transport and Road Research Laboratory, Crowthorne, UK.
McCasland, W. R.,(1980). Freeway modifications to increase traffic flow. FHWA-TS-80-203. FHWA,
McLean, J.,(1996). Review of accidents and rural cross section elements including roadsides. ARR 297. ARR, ARRB
Transport research Ltd., Victoria, Australia.
McLean, J.,(1997). Review of accident and urban arterial cross-section treatments. 309. ARR, ARRB Transport
Research,
McLean, J. R. (1980) The safety implications of geometric standards. Canberra. Unpublished Work.
Miaou, S-P, (1996). Measuring the goodness-of-fit of accident prediction models. U.S. DOT, Federal Highway
Administration, FHWA-RD-96-040.
Miaou, S-P. (1996) Progress report. ORNL's modelling of two-lane rural road data. 1996. Oak Ridge National
Laboratory. Personal Communication
Perkins, E. T., (1957), Relationship of accident rate to highway shoulder width. Highway Research Bulletin. 151,
13-14.
Raff, M. S., (1953), Interstate highway-accident study. Highway Research Bulletin. 74, 18-43.
Roy Jorgensen Associates, Inc.,(1978). Cost and safety effectiveness of highway design elements. National Cooperative
Highway Research Program Report 197, Washington D.C.
Silyanov, V. V.,(1973), Comparison of the pattern of accident rates on roads of different countries. Traffic Engineering
and Control. 14(9) 432-435.
29. 1.29
C:workPROJECTSHSISIHSDM-MultilaneLiterature Reviews1. Lane widthlane width.wpd
Slatterly, G. T. and Cleveland, (1969) D. E. Traffic control roadway elements - their relationship to highway
safety/revise. Traffic volume. Highway Users federation for Safety and Mobility, Washington, D.C.
Stewart, D and Council, F. (1998)To smooth or not to smooth, that is the question. An analysis of accidents on rural
NC two-lane and four-lane roads. Personal communication.
Urbanik T, II,(1994), Factors affecting selection of lane width and shoulder width on urban freeways. Transportation
Research Record. 1445, 125-129.
Urbanik, T., II and Bonilla, C. R.,(1987). Safety and operational evaluation of shoulders on urban freeways.
FHWA/TX-87/32.
Vogt, A. and Bared, J.,(1998), Accident models for two-lane rural segments and intersections. Transportation
Research Record. 1635, 18-29
Wang, J., Hughes, W. E., and Stewart, R.,(1998). Safety effects of cross-section desing on rural multi-lane highways.
FHWA-RD-98-071.
Zegeer, C. V. and Council, F. M.,(1995), Safety relationships associated with cross-sectional roadway elements.
Transportation Research Record. 1512, 29-35.
Zegeer, C. V., Deen, R. C., and Mayes, J. G.,(1980). Effect of lane width and shoulder widths on accident reduction
on rural, two-lane roads. Research Report for the Kentucky Department of Transportation.
Zegeer, C. V., Deen, R. C., and Mayes, J. G.,(1981), Effect of lane width and shoulder widths on accident reduction
on rural, two-lane roads. Transportation Research Record. 806, 33-43.
Zegeer, C. V., Reinfurt, D., Hummer, J., Herf, L., and Hunter, W.,(1987). Safety effects of cross-section design for two-
lane roads. FHWA-RD-87/008. Federal Highway Administration.
Zegeer, C. V., Stewart, R., Council, F., and Neuman, T.,(1994 a), Accident relationships of roadway width on low-
volume roads. Transportation Research Record. 1445, 160-168.
Zegeer, C. V., Stewart, R., Council, F., and Neuman, T.,(1994 b), Roadway widths for low-traffic-volume roads.
National Cooperative Highway research Program Report 362, Washington D.C.
Zegeer, C. V. and Council, F. M.,(1995), Safety relationships associated with cross-sectional roadway elements.
Transportation Research Record. 1512, 29-35
Zegeer, C.V. and Deacon, J.A., Effect of lane width, shoulder width, and shoulder type on highway safety. In:
Relationship between safety and key highway features. State of the Art Report 6, Transportation Research Board,
Washington, D.C., 1987.
View publication stats
View publication stats
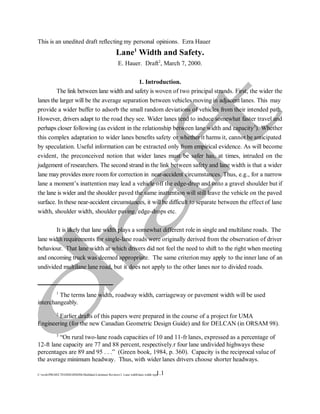
![1.5
1.75
2
2.25
2.5
Accidents/MVM
16 18 20 22 24
Carriageway Width [ft]
1.2
C:workPROJECTSHSISIHSDM-MultilaneLiterature Reviews1. Lane widthlane width.wpd
Figure 1. Non-junction accidents for two-
lane roads in Buckhinghampshire.
2. One matter of method.
Before embarking on the survey of what researchers have found, at least one methodological
issue requires airing. Early research relied on the examination of variables one-by-one: Accident rate
was plotted on the vertical axis against lane width (or degree of curve, grade, etc.) on the horizontal
axis. This intuitively appealing practice may lead astray.
To illustrate, consider an early study (Research on Road Traffic, p.411), most likely based on
Coburn, T.M., The relation between accidents and layout on rural roads. International Road Safety
and Traffic Review, Autumn 1962, pp. 15-20) which shows the relationship in Figure 1.
The squares show theaccident rates for the four carriageway width categories in which data
has been reported. Thus, carriageways that are 16-17 ft wide had 2.3 accidents/MVM (MVM=Million
Vehicle Miles) as shown by point A while carriageways 22 to 24 ft wide had an accident rate of 1.7
accidents/MVM as shown by point B. It is tempting to interpret this to mean that widening the
carriageway will reduce the number of accidents.
However, narrower roads usually carry less traffic. Indeed, in this case, the relationship
between carriageway width and average ADT (ADT=Average Daily Traffic) is shown in Figure 2.](data:image/gif;base64,R0lGODlhAQABAIAAAAAAAP///yH5BAEAAAAALAAAAAABAAEAAAIBRAA7)