SlideShare a Scribd company logo
1 of 5
Download to read offline
Vapor-Liquid Equilibria
Back to previous section: Single Component Liquid
Continue to next section: Using VLE to Solve Mass Balances
Importance of VLE
Vapor-liquid equilibrium (VLE) undergirds the bulk of industrial separation processes, particularly
in distillation processes. We will consider only binary (two-component) mixtures here for simplicity.
The composition of the liquid phase will be designated by the mole fraction of the more volatile
component (lower boiling point), represented by x. The mole fraction of the other component in the
liquid is of course 1 - x. Likewise, the mole fraction of the vapor will be represented by y, with 1 - y
being the composition of the other component in the vapor phase. When the liquid mixture is heated
to its boiling point, the vapor produced will, in general, have a different composition than the liquid;
i.e., x will not equal y. Thus, boiling the mixture produces a partial separation of the components. If
the vapor is collected, it can be condensed and boiled again to further change the composition.
Distillation columns use this principle, effectively repeating
the separation process at individual trays within a column.
Such columns may have over a hundred trays on which
VLE is occurring. Depicted at the left is a cartoon cut-away
of a small section of a tray-type distillation column. Two
sieve trays are shown. Hot vapor (shown in white) flows up
through the holes in the sieve tray and vigorously bubbles
through the liquid (shown in blue). The vapor and liquid
mix on this tray and the new mixture boils. The composition
of the liquid, x, leaving the will be enriched in the less
volatile component while the composition of the vapor, y,
will be enriched in the more volatile component. The vapor
rises up to the next tray where it will contact a liquid of
larger x and mixing and re-equilibration will again occur.
The liquid leaving the tray will flow over the weir and down
the downcomer to the next tray where it will mix with the
vapor on that tray. In this way, x tends to become smaller at
each lower tray, while y tends to increase at each tray higher
in the column. VLE refers to the relationship between the x and y values on each tray.
At equilibrium, the temperature and pressure of the liquid and vapor phases will be equal, but the
compositions will not. Why is this? There are two main factors that make the vapor and liquid
compositions different at equilibrium: the pure component vapor pressures and the nonidealities in
the liquid phase. In this class, we will not deal with the nonidealities in the liquid; this topic will be
discussed in ChEn 373. We will focus only on ideal liquid mixtures for which Raoult's Law applies.
When we discussed the phase behavior of pure fluids, we found that the temperature and pressure
were constant when the two phases were in equilibrium. Thus, the saturated liquid and vapor points
were both at the same temperature. When the liquid is heated it will boil at the same temperature as
that at which the vapor will condense when it is cooled. Another way of saying the same thing is
that the bubble point (boiling point) and dew point are the same for a pure fluid.
When we have two components in both the vapor and liquid phases, the bubble point and dew points
no longer coincide. There is a difference in composition between the liquid and vapor phases that are
in equilibrium at the same T and P. This is extremely important! It means that when you raise the
temperature of a mixture until it boils, more of the more-volatile component ends up in the vapor
phase. The liquid phase is left enriched in the less-volatile component. Thus, you can achieve a
partial separation in the mixture. This is the principle behind distillation that accounts for most of
the separation done in the chemical industry.
Using Phase Diagrams to Understand VLE
This difference between the bubble-point and dew-point temperatures is probably best understood
from phase diagrams like those we presented for pure fluids. Unfortunately, with a binary mixture
we must add another independent variable, composition of component 1. This makes the phase
diagram four dimensional instead of three dimensional. We can greatly simplify the diagrams by not
including volumes, which reduces the figures to 3D. Furthermore, we will pick a particular pressure
in order to look at a specific T-x plane or we will pick a particular temperature and look at a specific
P-x plane.
The Txy graph below shows binary mixtures of n-pentane and n-heptane at a fixed pressure of 1.5
atm. Like all phase diagrams, areas outside of enclosed regions represent a single phase, and areas
enclosed by coexistence lines represent two phases in equilibrium, with the boundary lines
representing the two phases that are in equilibrium. The temperature is plotted as a function of x
(mole fraction of n-pentane in the liquid) and y (mole fraction of n-pentane in the vapor).
Everywhere above the red line we will have only vapor; everywhere below the blue line we will
have only liquid. Between the blue and red lines we will have both liquid and vapor coexisting.
The blue line represents the saturated liquid line, or bubble line. Suppose a liquid containing 12
mol% n-pentane is heated up at constant pressure. It would remain liquid until it reached 370 K (see
the green dotted line at the left), at which point it would boil. This is the boiling point temperature
of this mixture (12 mol% pentane) at this pressure (1.5 atm). The vapor that boils off will not be the
same composition of the liquid. Pentane is more volatile than heptane so there will be more pentane
in the vapor mixture. Remember, on these plots we are using x to represent the mole fraction of n-
pentane (the more volatile component) and 1-x to represent the mole fraction of n-heptane in the
liquid. Likewise, we use y to represent the mole fraction of n-pentane in the vapor and 1-y to
represent the mole fraction of n-heptane in the vapor. The two phases that are in equilibrium are at
the same temperature and pressure, so they can be thought of as being connected through the two
phase region by a horizontal line (the horizontal green dotted line on the graph). This horizontal line
connecting the two equilibrium phases is called a tie line. The plot therefore shows us that the vapor
that boils off at 370 K will be 40 mol% pentane (and 60 mol% hexane). This is found from the end
of the tie line where it intersects the saturated vapor or dew line (red line). Notice that at the right
and left ends of the graph that the bubble and dew points meet. For example, at x = 1.0 we have pure
n-pentane, which is seen from the graph to boil at 322 K. The vapor given off will also be pure n-
pentane and so the bubble and dew point temperatures are the same. Does it seem strange to you that
x = 1 and y = 1 at this point? If it does, then you are confusing the definitions of these terms.
Remember that x applies to the liquid and y to the vapor for the same component; the mole fraction
of the other component is 1-x in the liquid and 1-y in the vapor. When a pure pentane boils, of course
the vapor will also be pure pentane.
Summary:
A liquid containing 12 mol%
pentane (x = 0.12) could be
heated to 370 K at which
point it would start to boil
(blue line). The saturated
vapor (red line) in
equilibrium with the boiling
liquid is at the same
temperature, but is richer in
the more volatile component,
n-pentane. The composition
of this saturated vapor is 40
mol% n-pentane (y = 0.4).
Likewise a vapor containing
40 mol% n-pentane could be
cooled to 370 K before it
started to condense. At 370
K, the vapor is saturated and
the first liquid droplets
appear. The composition of
these liquid droplets will be
12 mol% n-pentane.
We could have chosen instead to plot the phase diagram on a constant temperature diagram and
allow the pressure to vary. The Pxy diagram for n-pentane + n-heptane mixtures at 400 K is shown
below. At 400 K, the vapor pressure of pure n-pentane is just over 10 atm while the vapor pressure
of n-heptane is just over 2 atm. Can you see these from the graph below? Note that on a constant
temperature graph the liquid is on top and the vapor on bottom, whereas the reverse was true for the
constant pressure plot. This is because liquids exist at high pressures; vapors at low pressures.
Likewise, vapors exist at high temperatures; liquids at low temperatures. Again, the blue line
represents the saturated liquid, and the red line represents the saturated vapor. The region between
the blue and red lines is where two phases exist, the compositions of which are given by the blue
and red lines themselves. Thus, if the pressure of a 400 K vapor containing 90 mol% n-pentane is
increased isothermally, it will remain a vapor until it reaches 7.5 atm. At this point, the pressure is
high enough that we reach the dew point, and it will begin to condense. The liquid that condenses
will have a composition of 65 mol% n-pentane, as given by the end of the tie line that links the
saturated vapor (red line) to the equilibrium saturated liquid (blue line).
Summary:
A vapor containing 90 mol%
pentane (y = 0.9) could be
compressed to 7.5 atm (at
400 K), at which point it
would be a saturated vapor
(red line), and it would begin
to condense. The saturated
liquid (blue line) in
equilibrium with the vapor
contains less of the more
volatile component, n-
pentane. The composition of
this saturated liquid is 65
mol% n-pentane (y = 0.65).
Likewise a liquid containing
65 mol% n-pentane could be
expanded to 7.5 atm before it
started to evaporate. The
vapor that begins to come off
from the liquid at this
pressure has a composition
of 90 mol% n-pentane.
The yx Plot
On the Txy and Pxy plots shown above, both the saturated liquid (blue line) and saturated vapor (red
line) phases were plotted on the same graph. Thus, when you read the composition for the saturated
vapor (any point on the red line), you are reading y values from the abscissa (horizontal axis), and
when you read the composition for the saturated liquid (any point on the blue line), you are reading
x values from the abscissa. The length of the tie line (green line) in the two-phase region is how
much different the composition of n-pentane will be in the vapor phase than in the liquid phase. For
each x value on the blue line there is a corresponding y value on the red line representing the
composition of the vapor in equilibrium with the liquid. For the purposes of identifying the
separation that occurs when we boil the mixture, it is convenient to plot y values versus the x value
with which it is equilibrium. This is done for this system on the yx plot below.
Summary:
The red line represents the vapor
composition of n-pentane (y) that is
in equilibrium with the liquid (x).
The diagonal black line represents y
= x. The deviation of the red line
from the diagonal line is therefore an
indication of how wide the tie lines
are, or the amount of separation that
will take place.
See if you can match x and y values
shown on this diagram with those
that you obtain from the ends of tie
lines on the Pxy or Txy diagrams
given above.
All of this new information can be somewhat confusing the first few time you look at these graphs.
Re-read this page and then go to the next page where some interactive drills and questions will help
clarify the concepts and fix them in your mind.
Continue to next section: VLE Practice

More Related Content

What's hot

VLE VAPOR LIQUID EQUILIBRIUM - Introduction
VLE VAPOR LIQUID EQUILIBRIUM -  Introduction VLE VAPOR LIQUID EQUILIBRIUM -  Introduction
VLE VAPOR LIQUID EQUILIBRIUM - Introduction Usama Khan
 
Liquid liquid equilibrium for the ternary system of isopropyl acetate 2 propa...
Liquid liquid equilibrium for the ternary system of isopropyl acetate 2 propa...Liquid liquid equilibrium for the ternary system of isopropyl acetate 2 propa...
Liquid liquid equilibrium for the ternary system of isopropyl acetate 2 propa...Josemar Pereira da Silva
 
R&ac lecture 16
R&ac lecture 16R&ac lecture 16
R&ac lecture 16sayed fathy
 
Properties of pure substances
Properties of pure substancesProperties of pure substances
Properties of pure substancesRonak520
 
Chapter03.pure substance
Chapter03.pure substanceChapter03.pure substance
Chapter03.pure substancePASRINIVASAN_79
 
Propiedades termodinámicas de las sustancias puras
Propiedades termodinámicas de las sustancias purasPropiedades termodinámicas de las sustancias puras
Propiedades termodinámicas de las sustancias purasNorman Rivera
 
2- States of matter & phase equilibria - part 2 (Physical Pharmacy)
2- States of matter & phase equilibria - part 2 (Physical Pharmacy)2- States of matter & phase equilibria - part 2 (Physical Pharmacy)
2- States of matter & phase equilibria - part 2 (Physical Pharmacy)Rawa M. Ahmed
 
Thermodynamics by Bilal Mughal
Thermodynamics by Bilal MughalThermodynamics by Bilal Mughal
Thermodynamics by Bilal MughalBilal Mughal
 
Thermodynamics lecture 6
Thermodynamics lecture 6Thermodynamics lecture 6
Thermodynamics lecture 6Archit Gadhok
 
Chem 2 - Pressure/Temperature: Phase Diagrams III
Chem 2 - Pressure/Temperature: Phase Diagrams III Chem 2 - Pressure/Temperature: Phase Diagrams III
Chem 2 - Pressure/Temperature: Phase Diagrams III Lumen Learning
 
Vapour pressure and roults law
Vapour pressure and roults lawVapour pressure and roults law
Vapour pressure and roults lawUzmaBilal3
 

What's hot (20)

Liquid-liquid Solution Systems
Liquid-liquid Solution SystemsLiquid-liquid Solution Systems
Liquid-liquid Solution Systems
 
VLE VAPOR LIQUID EQUILIBRIUM - Introduction
VLE VAPOR LIQUID EQUILIBRIUM -  Introduction VLE VAPOR LIQUID EQUILIBRIUM -  Introduction
VLE VAPOR LIQUID EQUILIBRIUM - Introduction
 
Liquid liquid equilibrium for the ternary system of isopropyl acetate 2 propa...
Liquid liquid equilibrium for the ternary system of isopropyl acetate 2 propa...Liquid liquid equilibrium for the ternary system of isopropyl acetate 2 propa...
Liquid liquid equilibrium for the ternary system of isopropyl acetate 2 propa...
 
Soave1972
Soave1972Soave1972
Soave1972
 
Clausius-clapeyron Equation
Clausius-clapeyron EquationClausius-clapeyron Equation
Clausius-clapeyron Equation
 
R&ac lecture 16
R&ac lecture 16R&ac lecture 16
R&ac lecture 16
 
Properties of pure substances
Properties of pure substancesProperties of pure substances
Properties of pure substances
 
Vapour-Liquid and Solid-Vapour-Liquid Equilibria of the System (CO2 + H2) at ...
Vapour-Liquid and Solid-Vapour-Liquid Equilibria of the System (CO2 + H2) at ...Vapour-Liquid and Solid-Vapour-Liquid Equilibria of the System (CO2 + H2) at ...
Vapour-Liquid and Solid-Vapour-Liquid Equilibria of the System (CO2 + H2) at ...
 
Unit iii thermodynamics
Unit iii thermodynamicsUnit iii thermodynamics
Unit iii thermodynamics
 
1.1 Vapor Liquid Equilibrium
1.1 Vapor Liquid Equilibrium1.1 Vapor Liquid Equilibrium
1.1 Vapor Liquid Equilibrium
 
Chapter03.pure substance
Chapter03.pure substanceChapter03.pure substance
Chapter03.pure substance
 
Propiedades termodinámicas de las sustancias puras
Propiedades termodinámicas de las sustancias purasPropiedades termodinámicas de las sustancias puras
Propiedades termodinámicas de las sustancias puras
 
Chap3a jan13
Chap3a jan13Chap3a jan13
Chap3a jan13
 
The phase rule
The phase ruleThe phase rule
The phase rule
 
2- States of matter & phase equilibria - part 2 (Physical Pharmacy)
2- States of matter & phase equilibria - part 2 (Physical Pharmacy)2- States of matter & phase equilibria - part 2 (Physical Pharmacy)
2- States of matter & phase equilibria - part 2 (Physical Pharmacy)
 
Thermodynamics by Bilal Mughal
Thermodynamics by Bilal MughalThermodynamics by Bilal Mughal
Thermodynamics by Bilal Mughal
 
Unit8
Unit8Unit8
Unit8
 
Thermodynamics lecture 6
Thermodynamics lecture 6Thermodynamics lecture 6
Thermodynamics lecture 6
 
Chem 2 - Pressure/Temperature: Phase Diagrams III
Chem 2 - Pressure/Temperature: Phase Diagrams III Chem 2 - Pressure/Temperature: Phase Diagrams III
Chem 2 - Pressure/Temperature: Phase Diagrams III
 
Vapour pressure and roults law
Vapour pressure and roults lawVapour pressure and roults law
Vapour pressure and roults law
 

Similar to Vapour Liquid Equilibirium using digramatic representation

1649011617114008.hhgggggggggfffffffffffffff
1649011617114008.hhgggggggggfffffffffffffff1649011617114008.hhgggggggggfffffffffffffff
1649011617114008.hhgggggggggfffffffffffffffAbdlaDoski
 
THERMODYNAMICS-I PROPERTIES OF PURE SUBSTACES
THERMODYNAMICS-I PROPERTIES OF PURE SUBSTACES THERMODYNAMICS-I PROPERTIES OF PURE SUBSTACES
THERMODYNAMICS-I PROPERTIES OF PURE SUBSTACES MUHAMMADOKASHA3
 
Pure Substance Pure substance is a chemically homogenous s.docx
Pure Substance Pure substance is a chemically homogenous s.docxPure Substance Pure substance is a chemically homogenous s.docx
Pure Substance Pure substance is a chemically homogenous s.docxamrit47
 
UNIT-2_Part1_NOTES-PKNAG-SPATI.pdf
UNIT-2_Part1_NOTES-PKNAG-SPATI.pdfUNIT-2_Part1_NOTES-PKNAG-SPATI.pdf
UNIT-2_Part1_NOTES-PKNAG-SPATI.pdfYOGESH AHIRE
 
Bab 3 Thermodynamic of Engineering Approach
Bab 3 Thermodynamic of Engineering ApproachBab 3 Thermodynamic of Engineering Approach
Bab 3 Thermodynamic of Engineering ApproachIbnu Hasan
 
Properties of Pure Substances and Property Diagram.pdf
Properties of Pure Substances and Property Diagram.pdfProperties of Pure Substances and Property Diagram.pdf
Properties of Pure Substances and Property Diagram.pdfAishikChowdhury
 
chapter two ppt.pptx
chapter two ppt.pptxchapter two ppt.pptx
chapter two ppt.pptxmihretu7
 
Rayegan thermo i-cengel-chapter 3-p1
Rayegan thermo i-cengel-chapter 3-p1Rayegan thermo i-cengel-chapter 3-p1
Rayegan thermo i-cengel-chapter 3-p1Larry Howard
 
R&ac lecture 16
R&ac lecture 16R&ac lecture 16
R&ac lecture 16Eswar Eswar
 
dilute solution bounce back.pdf
dilute solution bounce back.pdfdilute solution bounce back.pdf
dilute solution bounce back.pdftvelocity2022
 
chapter03_7sdsdsdfsaerssssssssa.pptfgggggggggse
chapter03_7sdsdsdfsaerssssssssa.pptfgggggggggsechapter03_7sdsdsdfsaerssssssssa.pptfgggggggggse
chapter03_7sdsdsdfsaerssssssssa.pptfgggggggggsektmbych2016
 
CAPE Chemistry 2016 U2 P2 Q5 Past Paper Answer - Theory And Mark Scheme
CAPE Chemistry 2016 U2 P2 Q5 Past Paper Answer - Theory And Mark Scheme CAPE Chemistry 2016 U2 P2 Q5 Past Paper Answer - Theory And Mark Scheme
CAPE Chemistry 2016 U2 P2 Q5 Past Paper Answer - Theory And Mark Scheme Denison Dwarkah
 

Similar to Vapour Liquid Equilibirium using digramatic representation (20)

1649011617114008.hhgggggggggfffffffffffffff
1649011617114008.hhgggggggggfffffffffffffff1649011617114008.hhgggggggggfffffffffffffff
1649011617114008.hhgggggggggfffffffffffffff
 
THERMODYNAMICS-I PROPERTIES OF PURE SUBSTACES
THERMODYNAMICS-I PROPERTIES OF PURE SUBSTACES THERMODYNAMICS-I PROPERTIES OF PURE SUBSTACES
THERMODYNAMICS-I PROPERTIES OF PURE SUBSTACES
 
Pure Substance Pure substance is a chemically homogenous s.docx
Pure Substance Pure substance is a chemically homogenous s.docxPure Substance Pure substance is a chemically homogenous s.docx
Pure Substance Pure substance is a chemically homogenous s.docx
 
UNIT-2_Part1_NOTES-PKNAG-SPATI.pdf
UNIT-2_Part1_NOTES-PKNAG-SPATI.pdfUNIT-2_Part1_NOTES-PKNAG-SPATI.pdf
UNIT-2_Part1_NOTES-PKNAG-SPATI.pdf
 
Bab 3 Thermodynamic of Engineering Approach
Bab 3 Thermodynamic of Engineering ApproachBab 3 Thermodynamic of Engineering Approach
Bab 3 Thermodynamic of Engineering Approach
 
Pure substances
Pure substancesPure substances
Pure substances
 
Properties of Pure Substances and Property Diagram.pdf
Properties of Pure Substances and Property Diagram.pdfProperties of Pure Substances and Property Diagram.pdf
Properties of Pure Substances and Property Diagram.pdf
 
chapter two ppt.pptx
chapter two ppt.pptxchapter two ppt.pptx
chapter two ppt.pptx
 
Chapter 03 thermo
Chapter 03 thermoChapter 03 thermo
Chapter 03 thermo
 
Masas ii, trabajo 1 (1)
Masas ii, trabajo 1 (1)Masas ii, trabajo 1 (1)
Masas ii, trabajo 1 (1)
 
Masas ii, trabajo 1 (1)
Masas ii, trabajo 1 (1)Masas ii, trabajo 1 (1)
Masas ii, trabajo 1 (1)
 
Thermodynemics
ThermodynemicsThermodynemics
Thermodynemics
 
Distillation
DistillationDistillation
Distillation
 
Rayegan thermo i-cengel-chapter 3-p1
Rayegan thermo i-cengel-chapter 3-p1Rayegan thermo i-cengel-chapter 3-p1
Rayegan thermo i-cengel-chapter 3-p1
 
R&ac lecture 16
R&ac lecture 16R&ac lecture 16
R&ac lecture 16
 
dilute solution bounce back.pdf
dilute solution bounce back.pdfdilute solution bounce back.pdf
dilute solution bounce back.pdf
 
Flash distillation
Flash distillationFlash distillation
Flash distillation
 
chapter03_7sdsdsdfsaerssssssssa.pptfgggggggggse
chapter03_7sdsdsdfsaerssssssssa.pptfgggggggggsechapter03_7sdsdsdfsaerssssssssa.pptfgggggggggse
chapter03_7sdsdsdfsaerssssssssa.pptfgggggggggse
 
Distillation
DistillationDistillation
Distillation
 
CAPE Chemistry 2016 U2 P2 Q5 Past Paper Answer - Theory And Mark Scheme
CAPE Chemistry 2016 U2 P2 Q5 Past Paper Answer - Theory And Mark Scheme CAPE Chemistry 2016 U2 P2 Q5 Past Paper Answer - Theory And Mark Scheme
CAPE Chemistry 2016 U2 P2 Q5 Past Paper Answer - Theory And Mark Scheme
 

Recently uploaded

(SHREYA) Chakan Call Girls Just Call 7001035870 [ Cash on Delivery ] Pune Esc...
(SHREYA) Chakan Call Girls Just Call 7001035870 [ Cash on Delivery ] Pune Esc...(SHREYA) Chakan Call Girls Just Call 7001035870 [ Cash on Delivery ] Pune Esc...
(SHREYA) Chakan Call Girls Just Call 7001035870 [ Cash on Delivery ] Pune Esc...ranjana rawat
 
Structural Analysis and Design of Foundations: A Comprehensive Handbook for S...
Structural Analysis and Design of Foundations: A Comprehensive Handbook for S...Structural Analysis and Design of Foundations: A Comprehensive Handbook for S...
Structural Analysis and Design of Foundations: A Comprehensive Handbook for S...Dr.Costas Sachpazis
 
Sheet Pile Wall Design and Construction: A Practical Guide for Civil Engineer...
Sheet Pile Wall Design and Construction: A Practical Guide for Civil Engineer...Sheet Pile Wall Design and Construction: A Practical Guide for Civil Engineer...
Sheet Pile Wall Design and Construction: A Practical Guide for Civil Engineer...Dr.Costas Sachpazis
 
CCS335 _ Neural Networks and Deep Learning Laboratory_Lab Complete Record
CCS335 _ Neural Networks and Deep Learning Laboratory_Lab Complete RecordCCS335 _ Neural Networks and Deep Learning Laboratory_Lab Complete Record
CCS335 _ Neural Networks and Deep Learning Laboratory_Lab Complete RecordAsst.prof M.Gokilavani
 
UNIT - IV - Air Compressors and its Performance
UNIT - IV - Air Compressors and its PerformanceUNIT - IV - Air Compressors and its Performance
UNIT - IV - Air Compressors and its Performancesivaprakash250
 
(PRIYA) Rajgurunagar Call Girls Just Call 7001035870 [ Cash on Delivery ] Pun...
(PRIYA) Rajgurunagar Call Girls Just Call 7001035870 [ Cash on Delivery ] Pun...(PRIYA) Rajgurunagar Call Girls Just Call 7001035870 [ Cash on Delivery ] Pun...
(PRIYA) Rajgurunagar Call Girls Just Call 7001035870 [ Cash on Delivery ] Pun...ranjana rawat
 
MANUFACTURING PROCESS-II UNIT-5 NC MACHINE TOOLS
MANUFACTURING PROCESS-II UNIT-5 NC MACHINE TOOLSMANUFACTURING PROCESS-II UNIT-5 NC MACHINE TOOLS
MANUFACTURING PROCESS-II UNIT-5 NC MACHINE TOOLSSIVASHANKAR N
 
UNIT-II FMM-Flow Through Circular Conduits
UNIT-II FMM-Flow Through Circular ConduitsUNIT-II FMM-Flow Through Circular Conduits
UNIT-II FMM-Flow Through Circular Conduitsrknatarajan
 
UNIT-III FMM. DIMENSIONAL ANALYSIS
UNIT-III FMM.        DIMENSIONAL ANALYSISUNIT-III FMM.        DIMENSIONAL ANALYSIS
UNIT-III FMM. DIMENSIONAL ANALYSISrknatarajan
 
IMPLICATIONS OF THE ABOVE HOLISTIC UNDERSTANDING OF HARMONY ON PROFESSIONAL E...
IMPLICATIONS OF THE ABOVE HOLISTIC UNDERSTANDING OF HARMONY ON PROFESSIONAL E...IMPLICATIONS OF THE ABOVE HOLISTIC UNDERSTANDING OF HARMONY ON PROFESSIONAL E...
IMPLICATIONS OF THE ABOVE HOLISTIC UNDERSTANDING OF HARMONY ON PROFESSIONAL E...RajaP95
 
Microscopic Analysis of Ceramic Materials.pptx
Microscopic Analysis of Ceramic Materials.pptxMicroscopic Analysis of Ceramic Materials.pptx
Microscopic Analysis of Ceramic Materials.pptxpurnimasatapathy1234
 
College Call Girls Nashik Nehal 7001305949 Independent Escort Service Nashik
College Call Girls Nashik Nehal 7001305949 Independent Escort Service NashikCollege Call Girls Nashik Nehal 7001305949 Independent Escort Service Nashik
College Call Girls Nashik Nehal 7001305949 Independent Escort Service NashikCall Girls in Nagpur High Profile
 
Introduction to Multiple Access Protocol.pptx
Introduction to Multiple Access Protocol.pptxIntroduction to Multiple Access Protocol.pptx
Introduction to Multiple Access Protocol.pptxupamatechverse
 
UNIT-V FMM.HYDRAULIC TURBINE - Construction and working
UNIT-V FMM.HYDRAULIC TURBINE - Construction and workingUNIT-V FMM.HYDRAULIC TURBINE - Construction and working
UNIT-V FMM.HYDRAULIC TURBINE - Construction and workingrknatarajan
 
SPICE PARK APR2024 ( 6,793 SPICE Models )
SPICE PARK APR2024 ( 6,793 SPICE Models )SPICE PARK APR2024 ( 6,793 SPICE Models )
SPICE PARK APR2024 ( 6,793 SPICE Models )Tsuyoshi Horigome
 
OSVC_Meta-Data based Simulation Automation to overcome Verification Challenge...
OSVC_Meta-Data based Simulation Automation to overcome Verification Challenge...OSVC_Meta-Data based Simulation Automation to overcome Verification Challenge...
OSVC_Meta-Data based Simulation Automation to overcome Verification Challenge...Soham Mondal
 
(RIA) Call Girls Bhosari ( 7001035870 ) HI-Fi Pune Escorts Service
(RIA) Call Girls Bhosari ( 7001035870 ) HI-Fi Pune Escorts Service(RIA) Call Girls Bhosari ( 7001035870 ) HI-Fi Pune Escorts Service
(RIA) Call Girls Bhosari ( 7001035870 ) HI-Fi Pune Escorts Serviceranjana rawat
 
APPLICATIONS-AC/DC DRIVES-OPERATING CHARACTERISTICS
APPLICATIONS-AC/DC DRIVES-OPERATING CHARACTERISTICSAPPLICATIONS-AC/DC DRIVES-OPERATING CHARACTERISTICS
APPLICATIONS-AC/DC DRIVES-OPERATING CHARACTERISTICSKurinjimalarL3
 
Processing & Properties of Floor and Wall Tiles.pptx
Processing & Properties of Floor and Wall Tiles.pptxProcessing & Properties of Floor and Wall Tiles.pptx
Processing & Properties of Floor and Wall Tiles.pptxpranjaldaimarysona
 

Recently uploaded (20)

(SHREYA) Chakan Call Girls Just Call 7001035870 [ Cash on Delivery ] Pune Esc...
(SHREYA) Chakan Call Girls Just Call 7001035870 [ Cash on Delivery ] Pune Esc...(SHREYA) Chakan Call Girls Just Call 7001035870 [ Cash on Delivery ] Pune Esc...
(SHREYA) Chakan Call Girls Just Call 7001035870 [ Cash on Delivery ] Pune Esc...
 
Structural Analysis and Design of Foundations: A Comprehensive Handbook for S...
Structural Analysis and Design of Foundations: A Comprehensive Handbook for S...Structural Analysis and Design of Foundations: A Comprehensive Handbook for S...
Structural Analysis and Design of Foundations: A Comprehensive Handbook for S...
 
Sheet Pile Wall Design and Construction: A Practical Guide for Civil Engineer...
Sheet Pile Wall Design and Construction: A Practical Guide for Civil Engineer...Sheet Pile Wall Design and Construction: A Practical Guide for Civil Engineer...
Sheet Pile Wall Design and Construction: A Practical Guide for Civil Engineer...
 
CCS335 _ Neural Networks and Deep Learning Laboratory_Lab Complete Record
CCS335 _ Neural Networks and Deep Learning Laboratory_Lab Complete RecordCCS335 _ Neural Networks and Deep Learning Laboratory_Lab Complete Record
CCS335 _ Neural Networks and Deep Learning Laboratory_Lab Complete Record
 
UNIT - IV - Air Compressors and its Performance
UNIT - IV - Air Compressors and its PerformanceUNIT - IV - Air Compressors and its Performance
UNIT - IV - Air Compressors and its Performance
 
(PRIYA) Rajgurunagar Call Girls Just Call 7001035870 [ Cash on Delivery ] Pun...
(PRIYA) Rajgurunagar Call Girls Just Call 7001035870 [ Cash on Delivery ] Pun...(PRIYA) Rajgurunagar Call Girls Just Call 7001035870 [ Cash on Delivery ] Pun...
(PRIYA) Rajgurunagar Call Girls Just Call 7001035870 [ Cash on Delivery ] Pun...
 
MANUFACTURING PROCESS-II UNIT-5 NC MACHINE TOOLS
MANUFACTURING PROCESS-II UNIT-5 NC MACHINE TOOLSMANUFACTURING PROCESS-II UNIT-5 NC MACHINE TOOLS
MANUFACTURING PROCESS-II UNIT-5 NC MACHINE TOOLS
 
UNIT-II FMM-Flow Through Circular Conduits
UNIT-II FMM-Flow Through Circular ConduitsUNIT-II FMM-Flow Through Circular Conduits
UNIT-II FMM-Flow Through Circular Conduits
 
UNIT-III FMM. DIMENSIONAL ANALYSIS
UNIT-III FMM.        DIMENSIONAL ANALYSISUNIT-III FMM.        DIMENSIONAL ANALYSIS
UNIT-III FMM. DIMENSIONAL ANALYSIS
 
IMPLICATIONS OF THE ABOVE HOLISTIC UNDERSTANDING OF HARMONY ON PROFESSIONAL E...
IMPLICATIONS OF THE ABOVE HOLISTIC UNDERSTANDING OF HARMONY ON PROFESSIONAL E...IMPLICATIONS OF THE ABOVE HOLISTIC UNDERSTANDING OF HARMONY ON PROFESSIONAL E...
IMPLICATIONS OF THE ABOVE HOLISTIC UNDERSTANDING OF HARMONY ON PROFESSIONAL E...
 
Microscopic Analysis of Ceramic Materials.pptx
Microscopic Analysis of Ceramic Materials.pptxMicroscopic Analysis of Ceramic Materials.pptx
Microscopic Analysis of Ceramic Materials.pptx
 
College Call Girls Nashik Nehal 7001305949 Independent Escort Service Nashik
College Call Girls Nashik Nehal 7001305949 Independent Escort Service NashikCollege Call Girls Nashik Nehal 7001305949 Independent Escort Service Nashik
College Call Girls Nashik Nehal 7001305949 Independent Escort Service Nashik
 
Introduction to Multiple Access Protocol.pptx
Introduction to Multiple Access Protocol.pptxIntroduction to Multiple Access Protocol.pptx
Introduction to Multiple Access Protocol.pptx
 
UNIT-V FMM.HYDRAULIC TURBINE - Construction and working
UNIT-V FMM.HYDRAULIC TURBINE - Construction and workingUNIT-V FMM.HYDRAULIC TURBINE - Construction and working
UNIT-V FMM.HYDRAULIC TURBINE - Construction and working
 
SPICE PARK APR2024 ( 6,793 SPICE Models )
SPICE PARK APR2024 ( 6,793 SPICE Models )SPICE PARK APR2024 ( 6,793 SPICE Models )
SPICE PARK APR2024 ( 6,793 SPICE Models )
 
DJARUM4D - SLOT GACOR ONLINE | SLOT DEMO ONLINE
DJARUM4D - SLOT GACOR ONLINE | SLOT DEMO ONLINEDJARUM4D - SLOT GACOR ONLINE | SLOT DEMO ONLINE
DJARUM4D - SLOT GACOR ONLINE | SLOT DEMO ONLINE
 
OSVC_Meta-Data based Simulation Automation to overcome Verification Challenge...
OSVC_Meta-Data based Simulation Automation to overcome Verification Challenge...OSVC_Meta-Data based Simulation Automation to overcome Verification Challenge...
OSVC_Meta-Data based Simulation Automation to overcome Verification Challenge...
 
(RIA) Call Girls Bhosari ( 7001035870 ) HI-Fi Pune Escorts Service
(RIA) Call Girls Bhosari ( 7001035870 ) HI-Fi Pune Escorts Service(RIA) Call Girls Bhosari ( 7001035870 ) HI-Fi Pune Escorts Service
(RIA) Call Girls Bhosari ( 7001035870 ) HI-Fi Pune Escorts Service
 
APPLICATIONS-AC/DC DRIVES-OPERATING CHARACTERISTICS
APPLICATIONS-AC/DC DRIVES-OPERATING CHARACTERISTICSAPPLICATIONS-AC/DC DRIVES-OPERATING CHARACTERISTICS
APPLICATIONS-AC/DC DRIVES-OPERATING CHARACTERISTICS
 
Processing & Properties of Floor and Wall Tiles.pptx
Processing & Properties of Floor and Wall Tiles.pptxProcessing & Properties of Floor and Wall Tiles.pptx
Processing & Properties of Floor and Wall Tiles.pptx
 

Vapour Liquid Equilibirium using digramatic representation

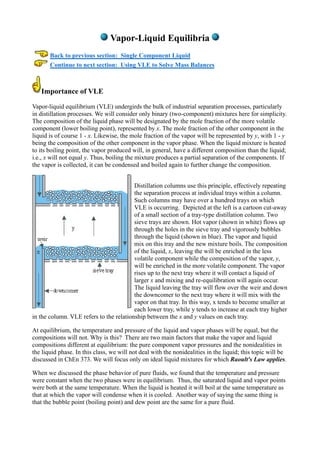
  • 1. Vapor-Liquid Equilibria Back to previous section: Single Component Liquid Continue to next section: Using VLE to Solve Mass Balances Importance of VLE Vapor-liquid equilibrium (VLE) undergirds the bulk of industrial separation processes, particularly in distillation processes. We will consider only binary (two-component) mixtures here for simplicity. The composition of the liquid phase will be designated by the mole fraction of the more volatile component (lower boiling point), represented by x. The mole fraction of the other component in the liquid is of course 1 - x. Likewise, the mole fraction of the vapor will be represented by y, with 1 - y being the composition of the other component in the vapor phase. When the liquid mixture is heated to its boiling point, the vapor produced will, in general, have a different composition than the liquid; i.e., x will not equal y. Thus, boiling the mixture produces a partial separation of the components. If the vapor is collected, it can be condensed and boiled again to further change the composition. Distillation columns use this principle, effectively repeating the separation process at individual trays within a column. Such columns may have over a hundred trays on which VLE is occurring. Depicted at the left is a cartoon cut-away of a small section of a tray-type distillation column. Two sieve trays are shown. Hot vapor (shown in white) flows up through the holes in the sieve tray and vigorously bubbles through the liquid (shown in blue). The vapor and liquid mix on this tray and the new mixture boils. The composition of the liquid, x, leaving the will be enriched in the less volatile component while the composition of the vapor, y, will be enriched in the more volatile component. The vapor rises up to the next tray where it will contact a liquid of larger x and mixing and re-equilibration will again occur. The liquid leaving the tray will flow over the weir and down the downcomer to the next tray where it will mix with the vapor on that tray. In this way, x tends to become smaller at each lower tray, while y tends to increase at each tray higher in the column. VLE refers to the relationship between the x and y values on each tray. At equilibrium, the temperature and pressure of the liquid and vapor phases will be equal, but the compositions will not. Why is this? There are two main factors that make the vapor and liquid compositions different at equilibrium: the pure component vapor pressures and the nonidealities in the liquid phase. In this class, we will not deal with the nonidealities in the liquid; this topic will be discussed in ChEn 373. We will focus only on ideal liquid mixtures for which Raoult's Law applies. When we discussed the phase behavior of pure fluids, we found that the temperature and pressure were constant when the two phases were in equilibrium. Thus, the saturated liquid and vapor points were both at the same temperature. When the liquid is heated it will boil at the same temperature as that at which the vapor will condense when it is cooled. Another way of saying the same thing is that the bubble point (boiling point) and dew point are the same for a pure fluid.
  • 2. When we have two components in both the vapor and liquid phases, the bubble point and dew points no longer coincide. There is a difference in composition between the liquid and vapor phases that are in equilibrium at the same T and P. This is extremely important! It means that when you raise the temperature of a mixture until it boils, more of the more-volatile component ends up in the vapor phase. The liquid phase is left enriched in the less-volatile component. Thus, you can achieve a partial separation in the mixture. This is the principle behind distillation that accounts for most of the separation done in the chemical industry. Using Phase Diagrams to Understand VLE This difference between the bubble-point and dew-point temperatures is probably best understood from phase diagrams like those we presented for pure fluids. Unfortunately, with a binary mixture we must add another independent variable, composition of component 1. This makes the phase diagram four dimensional instead of three dimensional. We can greatly simplify the diagrams by not including volumes, which reduces the figures to 3D. Furthermore, we will pick a particular pressure in order to look at a specific T-x plane or we will pick a particular temperature and look at a specific P-x plane. The Txy graph below shows binary mixtures of n-pentane and n-heptane at a fixed pressure of 1.5 atm. Like all phase diagrams, areas outside of enclosed regions represent a single phase, and areas enclosed by coexistence lines represent two phases in equilibrium, with the boundary lines representing the two phases that are in equilibrium. The temperature is plotted as a function of x (mole fraction of n-pentane in the liquid) and y (mole fraction of n-pentane in the vapor). Everywhere above the red line we will have only vapor; everywhere below the blue line we will have only liquid. Between the blue and red lines we will have both liquid and vapor coexisting. The blue line represents the saturated liquid line, or bubble line. Suppose a liquid containing 12 mol% n-pentane is heated up at constant pressure. It would remain liquid until it reached 370 K (see the green dotted line at the left), at which point it would boil. This is the boiling point temperature of this mixture (12 mol% pentane) at this pressure (1.5 atm). The vapor that boils off will not be the same composition of the liquid. Pentane is more volatile than heptane so there will be more pentane in the vapor mixture. Remember, on these plots we are using x to represent the mole fraction of n- pentane (the more volatile component) and 1-x to represent the mole fraction of n-heptane in the liquid. Likewise, we use y to represent the mole fraction of n-pentane in the vapor and 1-y to represent the mole fraction of n-heptane in the vapor. The two phases that are in equilibrium are at the same temperature and pressure, so they can be thought of as being connected through the two phase region by a horizontal line (the horizontal green dotted line on the graph). This horizontal line connecting the two equilibrium phases is called a tie line. The plot therefore shows us that the vapor that boils off at 370 K will be 40 mol% pentane (and 60 mol% hexane). This is found from the end of the tie line where it intersects the saturated vapor or dew line (red line). Notice that at the right and left ends of the graph that the bubble and dew points meet. For example, at x = 1.0 we have pure n-pentane, which is seen from the graph to boil at 322 K. The vapor given off will also be pure n- pentane and so the bubble and dew point temperatures are the same. Does it seem strange to you that x = 1 and y = 1 at this point? If it does, then you are confusing the definitions of these terms. Remember that x applies to the liquid and y to the vapor for the same component; the mole fraction of the other component is 1-x in the liquid and 1-y in the vapor. When a pure pentane boils, of course the vapor will also be pure pentane. Summary: A liquid containing 12 mol% pentane (x = 0.12) could be heated to 370 K at which point it would start to boil
  • 3. (blue line). The saturated vapor (red line) in equilibrium with the boiling liquid is at the same temperature, but is richer in the more volatile component, n-pentane. The composition of this saturated vapor is 40 mol% n-pentane (y = 0.4). Likewise a vapor containing 40 mol% n-pentane could be cooled to 370 K before it started to condense. At 370 K, the vapor is saturated and the first liquid droplets appear. The composition of these liquid droplets will be 12 mol% n-pentane. We could have chosen instead to plot the phase diagram on a constant temperature diagram and allow the pressure to vary. The Pxy diagram for n-pentane + n-heptane mixtures at 400 K is shown below. At 400 K, the vapor pressure of pure n-pentane is just over 10 atm while the vapor pressure of n-heptane is just over 2 atm. Can you see these from the graph below? Note that on a constant temperature graph the liquid is on top and the vapor on bottom, whereas the reverse was true for the constant pressure plot. This is because liquids exist at high pressures; vapors at low pressures. Likewise, vapors exist at high temperatures; liquids at low temperatures. Again, the blue line represents the saturated liquid, and the red line represents the saturated vapor. The region between the blue and red lines is where two phases exist, the compositions of which are given by the blue and red lines themselves. Thus, if the pressure of a 400 K vapor containing 90 mol% n-pentane is increased isothermally, it will remain a vapor until it reaches 7.5 atm. At this point, the pressure is high enough that we reach the dew point, and it will begin to condense. The liquid that condenses will have a composition of 65 mol% n-pentane, as given by the end of the tie line that links the saturated vapor (red line) to the equilibrium saturated liquid (blue line). Summary: A vapor containing 90 mol% pentane (y = 0.9) could be compressed to 7.5 atm (at 400 K), at which point it would be a saturated vapor (red line), and it would begin to condense. The saturated liquid (blue line) in equilibrium with the vapor contains less of the more volatile component, n- pentane. The composition of
  • 4. this saturated liquid is 65 mol% n-pentane (y = 0.65). Likewise a liquid containing 65 mol% n-pentane could be expanded to 7.5 atm before it started to evaporate. The vapor that begins to come off from the liquid at this pressure has a composition of 90 mol% n-pentane. The yx Plot On the Txy and Pxy plots shown above, both the saturated liquid (blue line) and saturated vapor (red line) phases were plotted on the same graph. Thus, when you read the composition for the saturated vapor (any point on the red line), you are reading y values from the abscissa (horizontal axis), and when you read the composition for the saturated liquid (any point on the blue line), you are reading x values from the abscissa. The length of the tie line (green line) in the two-phase region is how much different the composition of n-pentane will be in the vapor phase than in the liquid phase. For each x value on the blue line there is a corresponding y value on the red line representing the composition of the vapor in equilibrium with the liquid. For the purposes of identifying the separation that occurs when we boil the mixture, it is convenient to plot y values versus the x value with which it is equilibrium. This is done for this system on the yx plot below. Summary: The red line represents the vapor composition of n-pentane (y) that is in equilibrium with the liquid (x). The diagonal black line represents y = x. The deviation of the red line from the diagonal line is therefore an indication of how wide the tie lines are, or the amount of separation that will take place. See if you can match x and y values shown on this diagram with those that you obtain from the ends of tie
  • 5. lines on the Pxy or Txy diagrams given above. All of this new information can be somewhat confusing the first few time you look at these graphs. Re-read this page and then go to the next page where some interactive drills and questions will help clarify the concepts and fix them in your mind. Continue to next section: VLE Practice